F Using spreadsheets
F.2 How to do it in spreadsheets
F.2.1 Probability distributions
Similar to R (E.2.2), spreadsheet applications also provide functions for basic probability distribution calculations.
For example, in the case of the normal distribution:
- The normal distribution's probability density function can be obtained using the function
NORMDIST(Excel, Google), withFALSE(or0) as the fourth argument. This corresponds to the functiondnormin R:
=NORMDIST(183.5, 180, 6, FALSE) in a spreadsheet is equivalent to dnorm(183.5, 180, 6) in R.
- The cumulative distribution function (CDF) of the normal distribution is obtained using the same function with the argument
TRUEor1:
=NORMDIST(183.5, 180, 6, 1) in a spreadsheet is equivalent to pnorm(183.5, 180, 6) in R.
- The inverse cumulative distribution function (quantile function) of the normal distribution can be computed using the function
NORMINV(Excel, Google):
=NORMINV(0.72, 180, 6) in a spreadsheet is equivalent to qnorm(0.72, 180, 6) in R.
- Sampling from a normal distribution can be done by transforming values drawn from a uniform distribution using the inverse cumulative distribution function:
=NORMINV(RAND(), 180, 6) in a spreadsheet is equivalent to rnorm(1, 180, 6) in R.
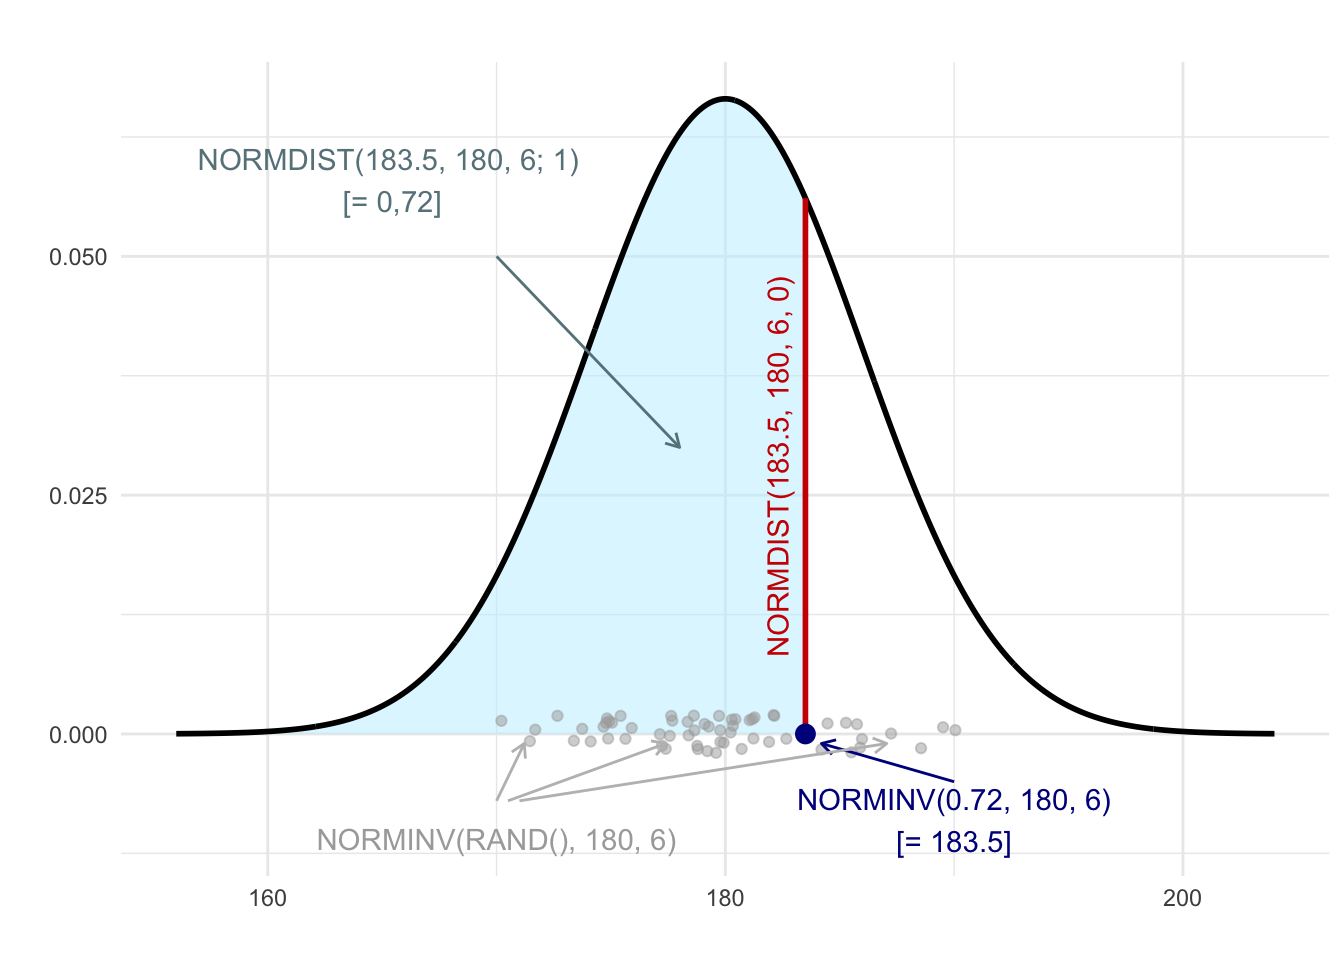
Figure F.1: Illustration of the application of the functions NORMDIST and NORMINV for a distribution with mean equal to 180 and standard deviation equal to 6.