
Ψlogical
Testing
Office keeping 💼
- Not tested on formulas
- Concepts are fair game
- Project:
- Citi training
- Share 2-3 empirical articles
(intragroup) - Discuss construct
(intragroup)


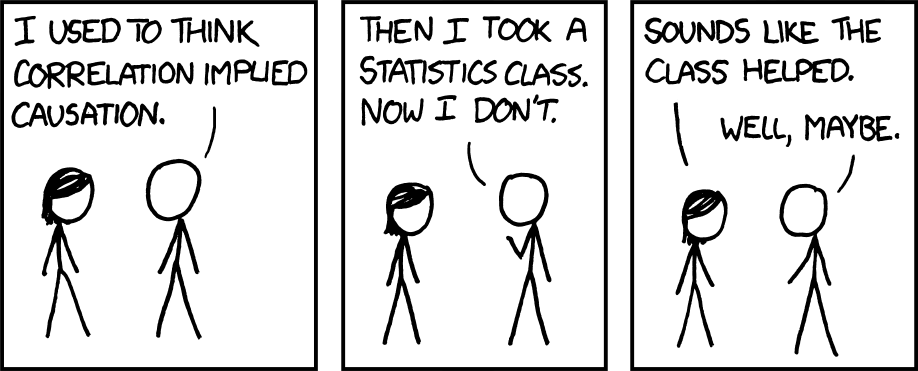
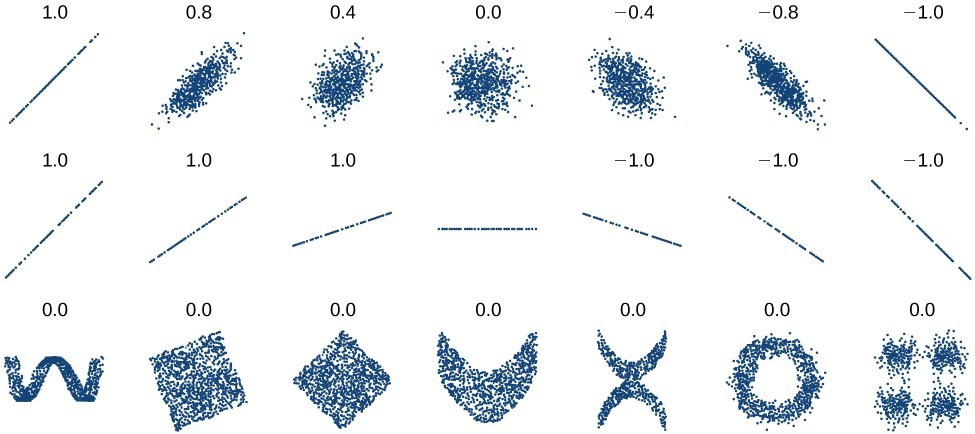
Correlation
- index of association between 2 variables
- can be either descriptive or inferential
- look for p-value
- reflects both magnitude and valence of association
- 0 \(\rightarrow\) 1
- positive (+) or negative (-)
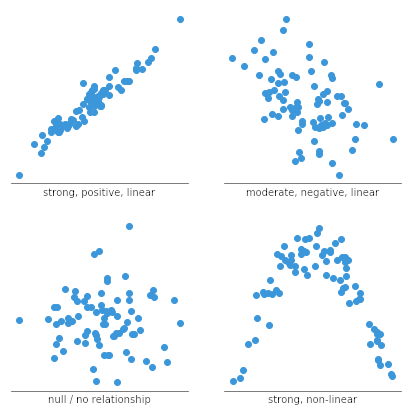
Visualizing association
Scatterplot – visual representation of association
typically 2 variables but can be 3


Scatterplot…
aka Scatter Diagram typically focused on bivariate distribution
- Histograms & Polygons focus on univariate distribution
- simply refers to:
- one thing at a time, or
- two things simultaneously
- simply refers to:
- Sometimes individual histograms also included in visual

![]()
Forms of association

Scatterplot and correlation


Let’s construct one!

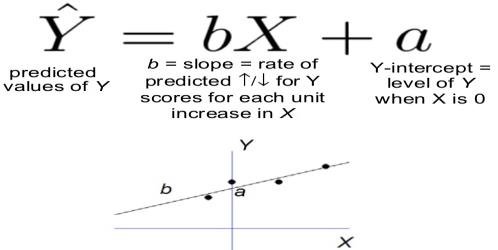
Regression
Line of best fit through scatterplot
- Useful for prediction
- Can have one or more predictor variables
- 1 = simple regression
- \(>\) 1 = multiple regression
Warning
Figure 3.4 has an error (p. 68)
Explore Simple Regression
Different datasets:

Try to beat the statistic:

Predicted scores
- Typically designated \(\hat{Y}\) or \(Y^{\prime}\)
- Predicted “Criterion” score
- “Criterion” = DV
- Select predictor score, then use line of best fit to identify likely \(Y^{\prime}\)

Other indices of association…
…exist as alternatives to the “typical” correlation coefficient (Pearson’s r)
- Based primarily on
- level of measurement
- NOIR
- end-purpose
- level of measurement
Cross-validation
Always a good idea – check to see if association / prediction still good with different sample or scenario
- Shrinkage – decrease in predictive accuracy when regression estimated in Sample A is later applied to Sample B

Factor analysis
Important data-reduction analytical procedure for measurement specialists
- Provides us with statistical justification to group item responses into aggregate scale scores
- Helps confirm:
- appropriate number of scale scores
- items to retain or delete from larger measure
