3 Genome Alignment Profiles
Since the transcriptome coverage directly affects the accuracy of vital features of all gene expression studies1, it may be informative to compare the coverage distribution of reads mapped in unaligned (unmapped bases), intergenic, intronic, and exonic/protein coding and UTR regions by RNA-seq platform.
In the plot_GAP function, each percentage is defined as a proportion in the total regions of the genome using metrics about the alignment of RNA-seq reads.
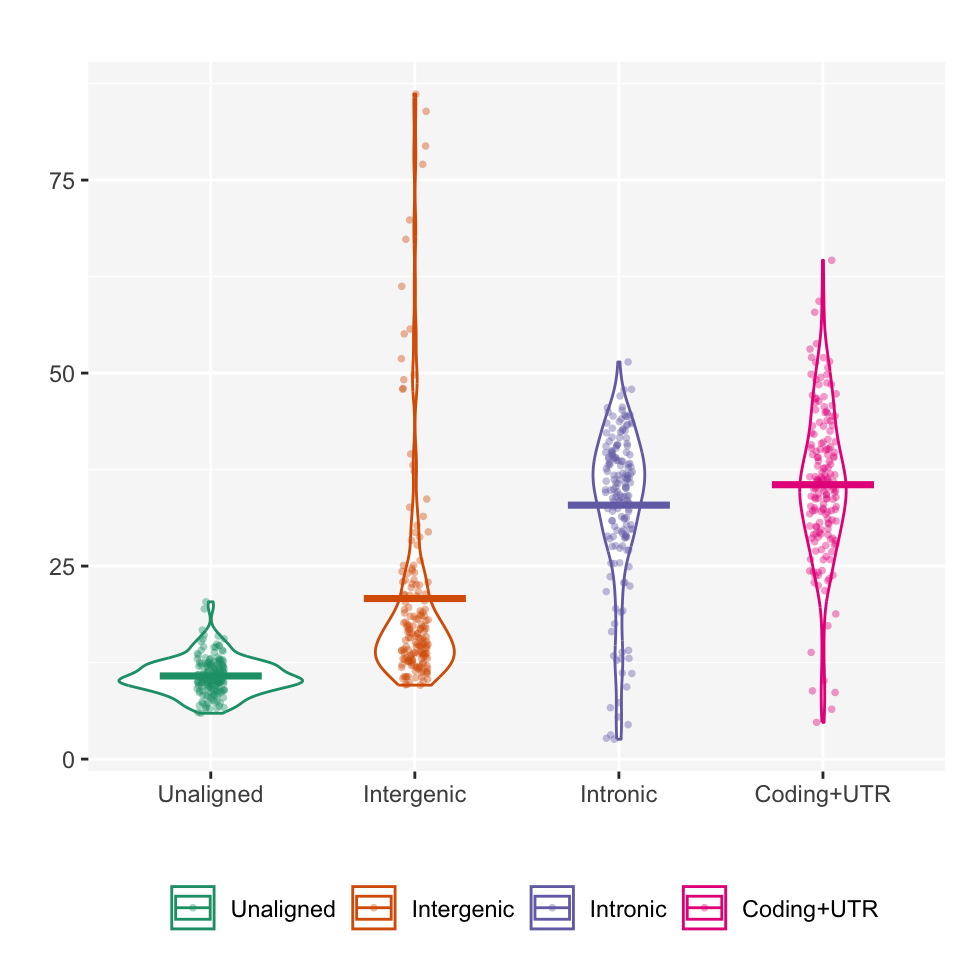
Within the FFT samples from the example data, the coding and UTR regions compose 35.54% total bases on average and the distribution is relatively symmetry than other regions.
stby(data      = GAP$PCTdf,
     INDICES   = GAP$PCTdf$grp,
     FUN       = descr,
     stats     = c("mean", "sd", "med", "mad"),
     transpose = TRUE,
     headings  = FALSE)
## Non-numerical variable(s) ignored: grp##
## Mean Std.Dev Median MAD
## ---------------- ------- --------- -------- ------
## Unaligned 10.77 2.42 10.50 2.26
## Intergenic 20.80 14.40 15.95 5.05
## Intronic 32.89 10.07 35.10 7.82
## Coding+UTR 35.54 9.75 35.28 8.31Zhao, W., He, X., Hoadley, K.A. et al. Comparison of RNA-Seq by poly (A) capture, ribosomal RNA depletion, and DNA microarray for expression profiling. BMC Genomics 15, 419 (2014). https://doi.org/10.1186/1471-2164-15-419↩︎