8.3 Supplemental figures
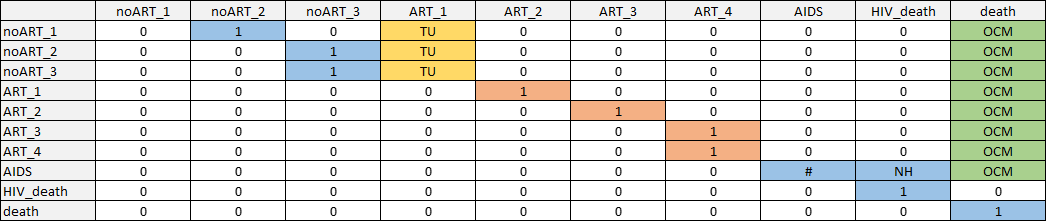
Figure 8.1: Transition matrix schematic for HIV.
Non-zero transition probabilities are indicated in blue for natural history transitions, yellow for treatment uptake transitions, orange for treatment effectiveness transitions, and green for other-cause mortality. Markov model constructed by first creating a transition matrix without treatment uptake or other-cause death; then adding in treatment uptake transitions while scaling other transitions such that each row still sums to 1; then adding in transitions to other-cause mortality with the same approach. Disease state names: AIDS_SC, Subclinical AIDS; ART_1, ART year 1; ART_2, ART year 2; ART_3, ART year 3; ART_4, ART year 4+; HIV_death, HIV-related death; HIV_SC_1, Subclinical HIV year 1; HIV_SC_2, Subclinical HIV year 2; HIV_SC_3, Subclinical HIV year 3+; AIDS_ART_1, AIDS on ART year 1; AIDS_ART_2, AIDS on ART year 2; death, Other-cause death. Abbreviations: NH, natural history (blue); TU, treatment uptake (marigold); TE, treatment effectiveness (orange); OCM, other cause mortality (green).
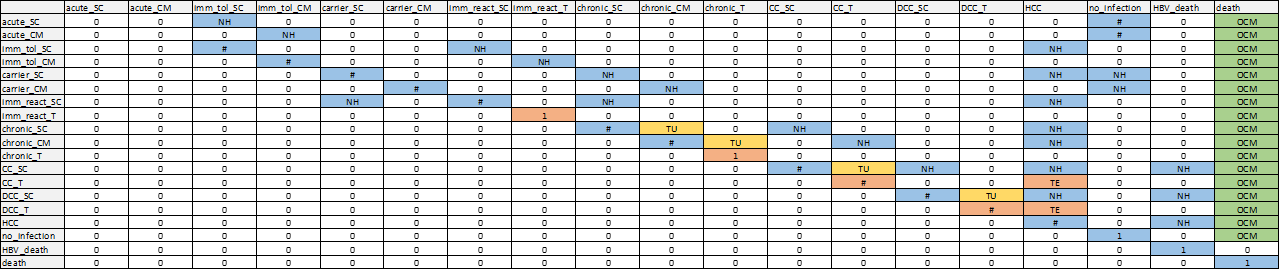
Figure 8.2: Transition matrix schematic for HBV.
Non-zero transition probabilities are indicated in blue for natural history transitions, yellow for treatment uptake transitions, orange for treatment effectiveness transitions, and green for other-cause mortality. Markov model constructed by first creating a transition matrix without treatment uptake or other-cause death; then adding in treatment uptake transitions while scaling other transitions such that each row still sums to 1; then adding in transitions to other-cause mortality with the same approach. Disease state names: acute_CM, Acute clinically managed; acute_SC, Acute subclinical; carrier_CM, Carrier clinically managed; carrier_SC, Carrier subclinical; CC_SC, Compensated cirrhosis subclinical; CC_T, Compensated cirrhosis on AVT; chronic_CM, Chronic HBeAG- clinically managed; chronic_SC, Chronic HBeAG- subclinical; chronic_T, Chronic HBeAG- on AVT; DCC_SC, Decompensated cirrhosis subclinical; DCC_T, Decompensated cirrhosis on AVT; HBV_death, HBV-related death; HCC, Hepatocellular carcinoma; imm_react_SC, Immune reactive subclinical; imm_react_T, Immune reactive on AVT; imm_tol_CM, Immune tolerant clinically managed; imm_tol_SC, Immune tolerant subclinical; init, Initiation; no_infection, No infection; death, Other-cause death. Abbreviations: NH, natural history (blue); TU, treatment uptake (marigold); TE, treatment effectiveness (orange); OCM, other cause mortality (green).
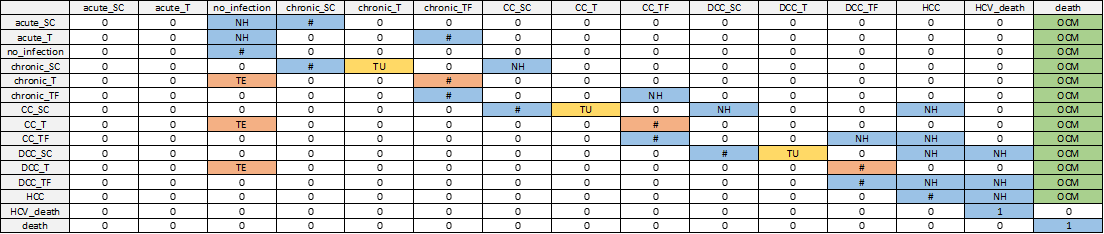
Figure 8.3: Transition matrix schematic for HCV.
Transition matrix schematic for HCV. Non-zero transition probabilities are indicated in blue for natural history transitions, yellow for treatment uptake transitions, orange for treatment effectiveness transitions, and green for other-cause mortality. Markov model constructed by first creating a transition matrix without treatment uptake or other-cause death; then adding in treatment uptake transitions while scaling other transitions such that each row still sums to 1; then adding in transitions to other-cause mortality with the same approach. Disease state names: acute_SC, Acute subclinical; acute_T, Acute on AVT; CC_SC, Compensated cirrhosis subclinical; CC_T, Compensated cirrhosis on AVT; CC_TF, Compensated cirrhosis treatment failure; chronic_SC, Chronic HCV subclinical; chronic_T, Chronic HCV on AVT; chronic_TF, Chronic HCV treatment failure; DCC_SC, Decompensated cirrhosis subclinical; DCC_T, Decompensated cirrhosis on AVT; DCC_TF, Decompensated cirrhosis treatment failure; HCC, Hepatocellular carcinoma; HCV_death, HCV-related death; init, Initiation; no_infection, No infection; death, Other-cause death. Abbreviations: NH, natural history (blue); TU, treatment uptake (marigold); TE, treatment effectiveness (orange); OCM, other cause mortality (green).
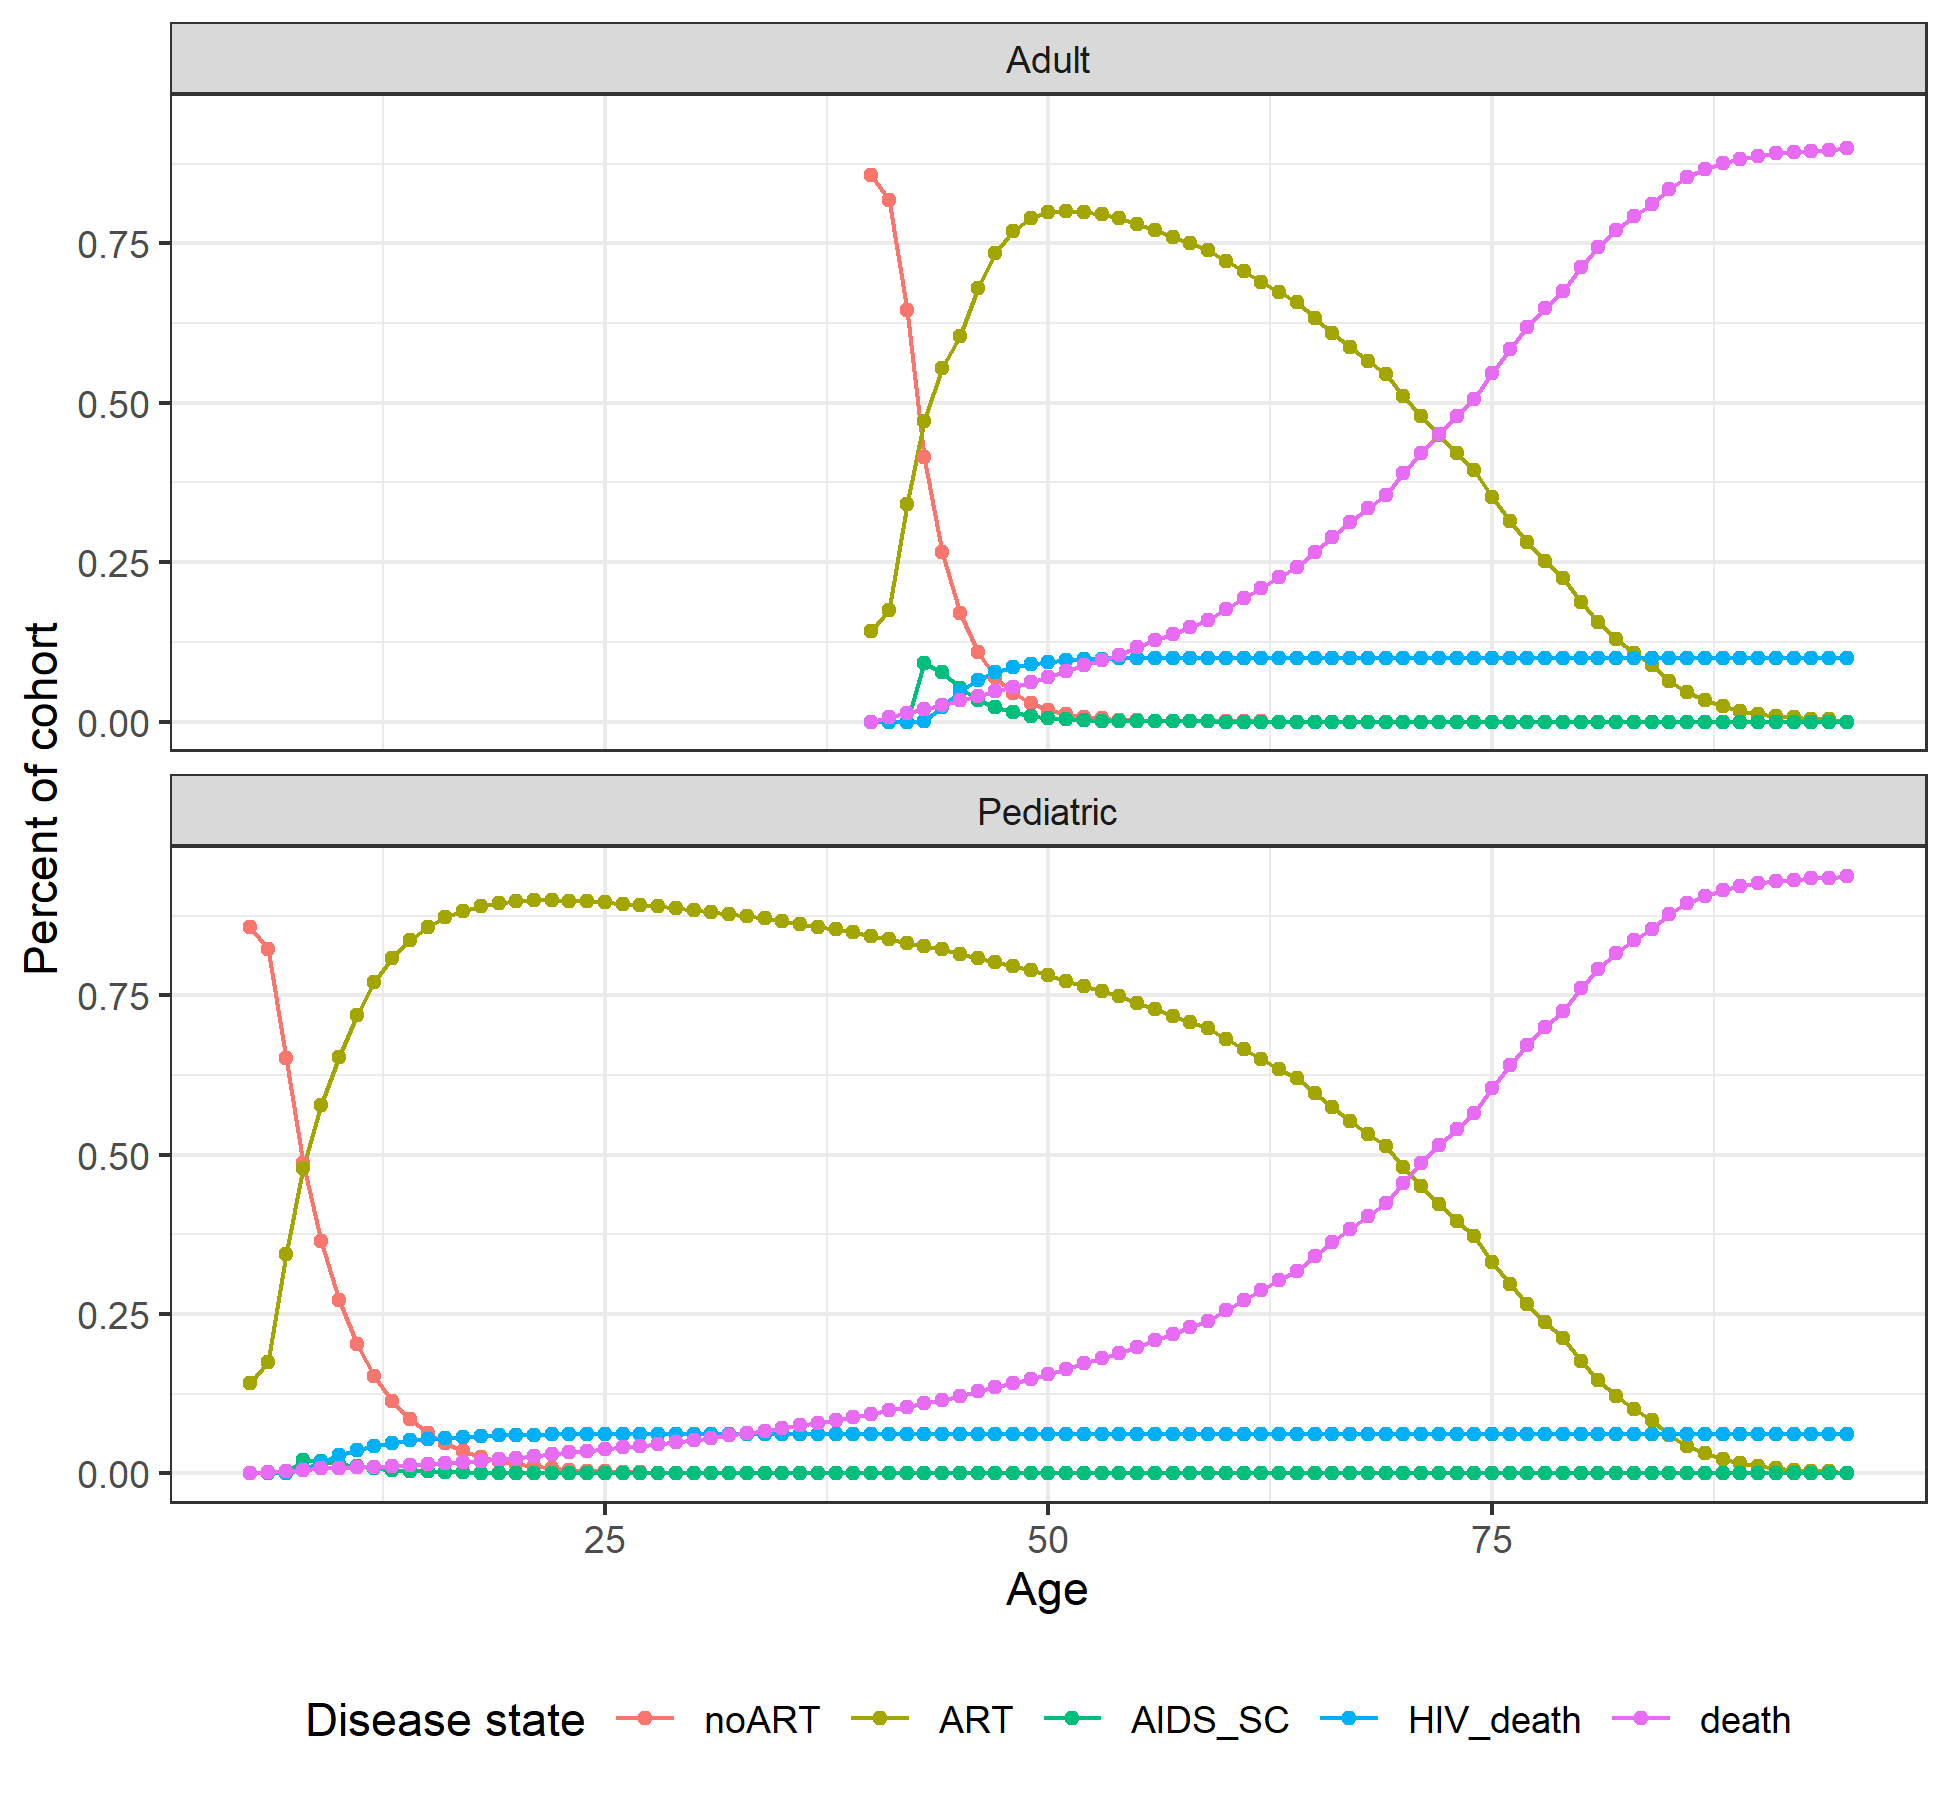
Figure 8.4: Markov trace plot for HIV pediatric and adult cohorts.
Disease state names: AIDS_SC, Subclinical AIDS; ART_1, ART year 1; ART_2, ART year 2; ART_3, ART year 3; ART_4, ART year 4+; HIV_death, HIV-related death; HIV_SC_1, Subclinical HIV year 1; HIV_SC_2, Subclinical HIV year 2; HIV_SC_3, Subclinical HIV year 3+; AIDS_ART_1, AIDS on ART year 1; AIDS_ART_2, AIDS on ART year 2; death, Other-cause death.
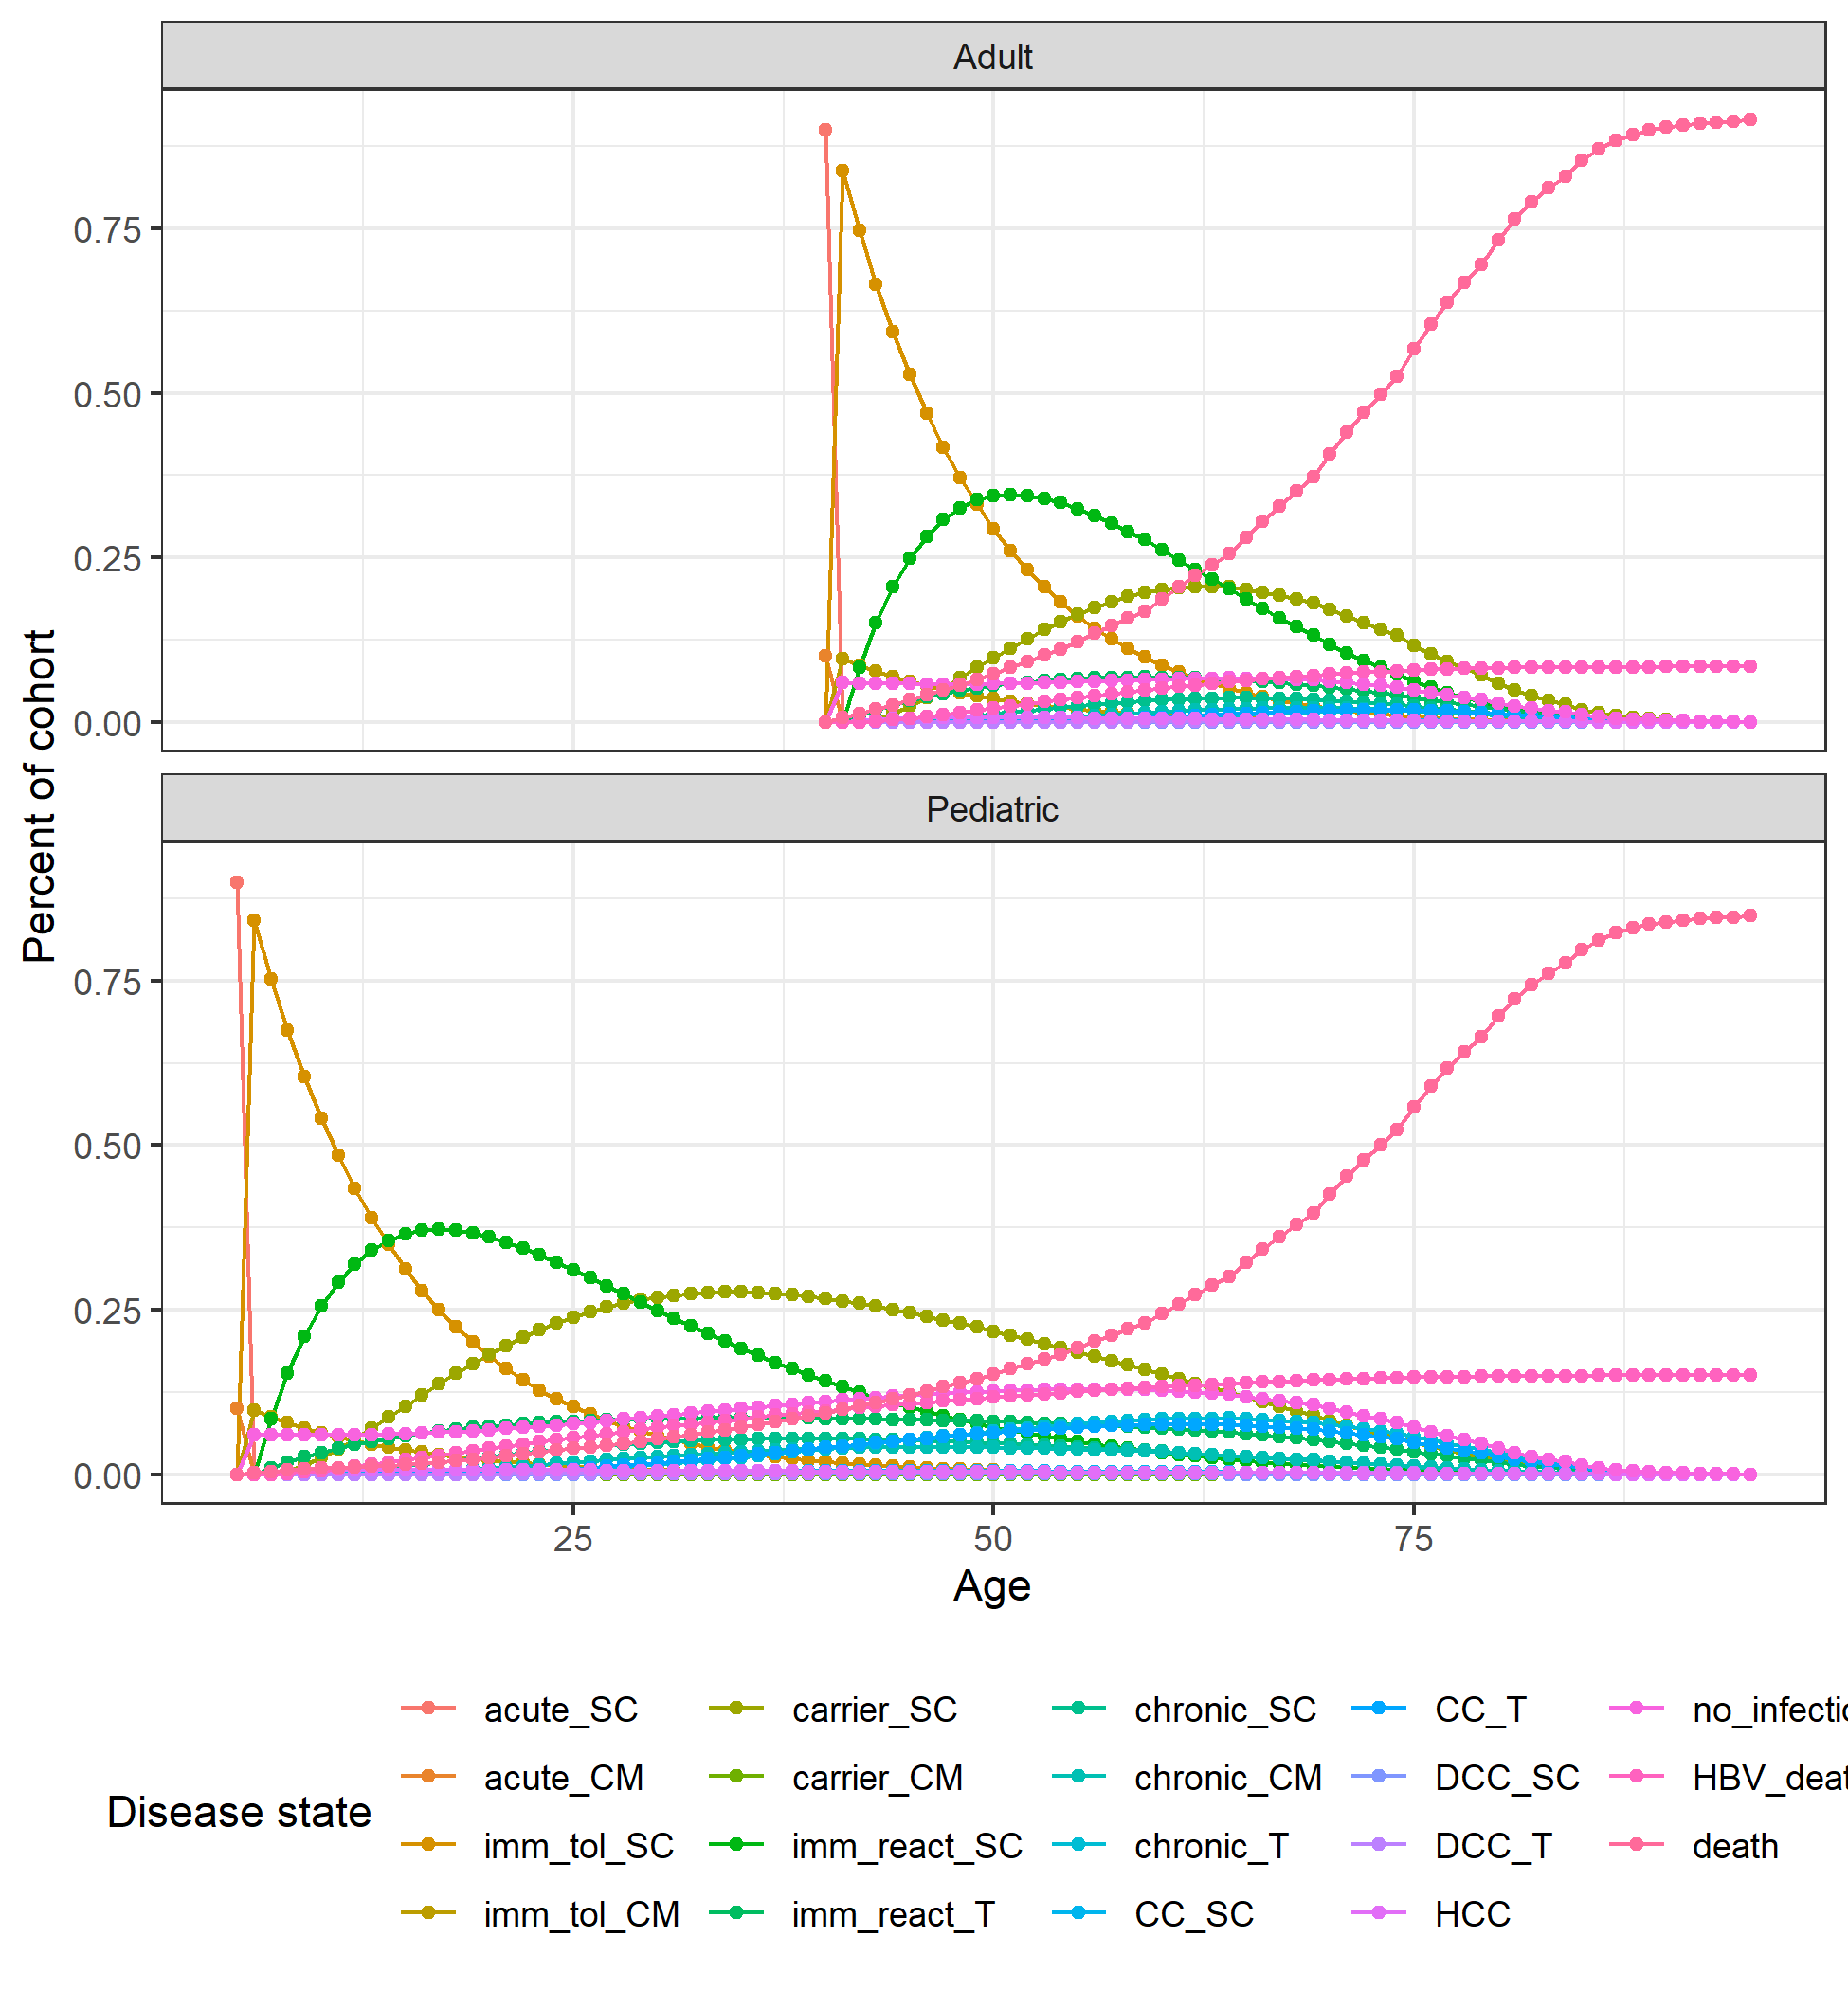
Figure 8.5: Markov trace plot for HBV pediatric and adult cohorts.
Disease state names: acute_CM, Acute clinically managed; acute_SC, Acute subclinical; carrier_CM, Carrier clinically managed; carrier_SC, Carrier subclinical; CC_SC, Compensated cirrhosis subclinical; CC_T, Compensated cirrhosis on AVT; chronic_CM, Chronic HBeAG- clinically managed; chronic_SC, Chronic HBeAG- subclinical; chronic_T, Chronic HBeAG- on AVT; DCC_SC, Decompensated cirrhosis subclinical; DCC_T, Decompensated cirrhosis on AVT; HBV_death, HBV-related death; HCC, Hepatocellular carcinoma; imm_react_SC, Immune reactive subclinical; imm_react_T, Immune reactive on AVT; imm_tol_CM, Immune tolerant clinically managed; imm_tol_SC, Immune tolerant subclinical; init, Initiation; no_infection, No infection; death, Other-cause death.
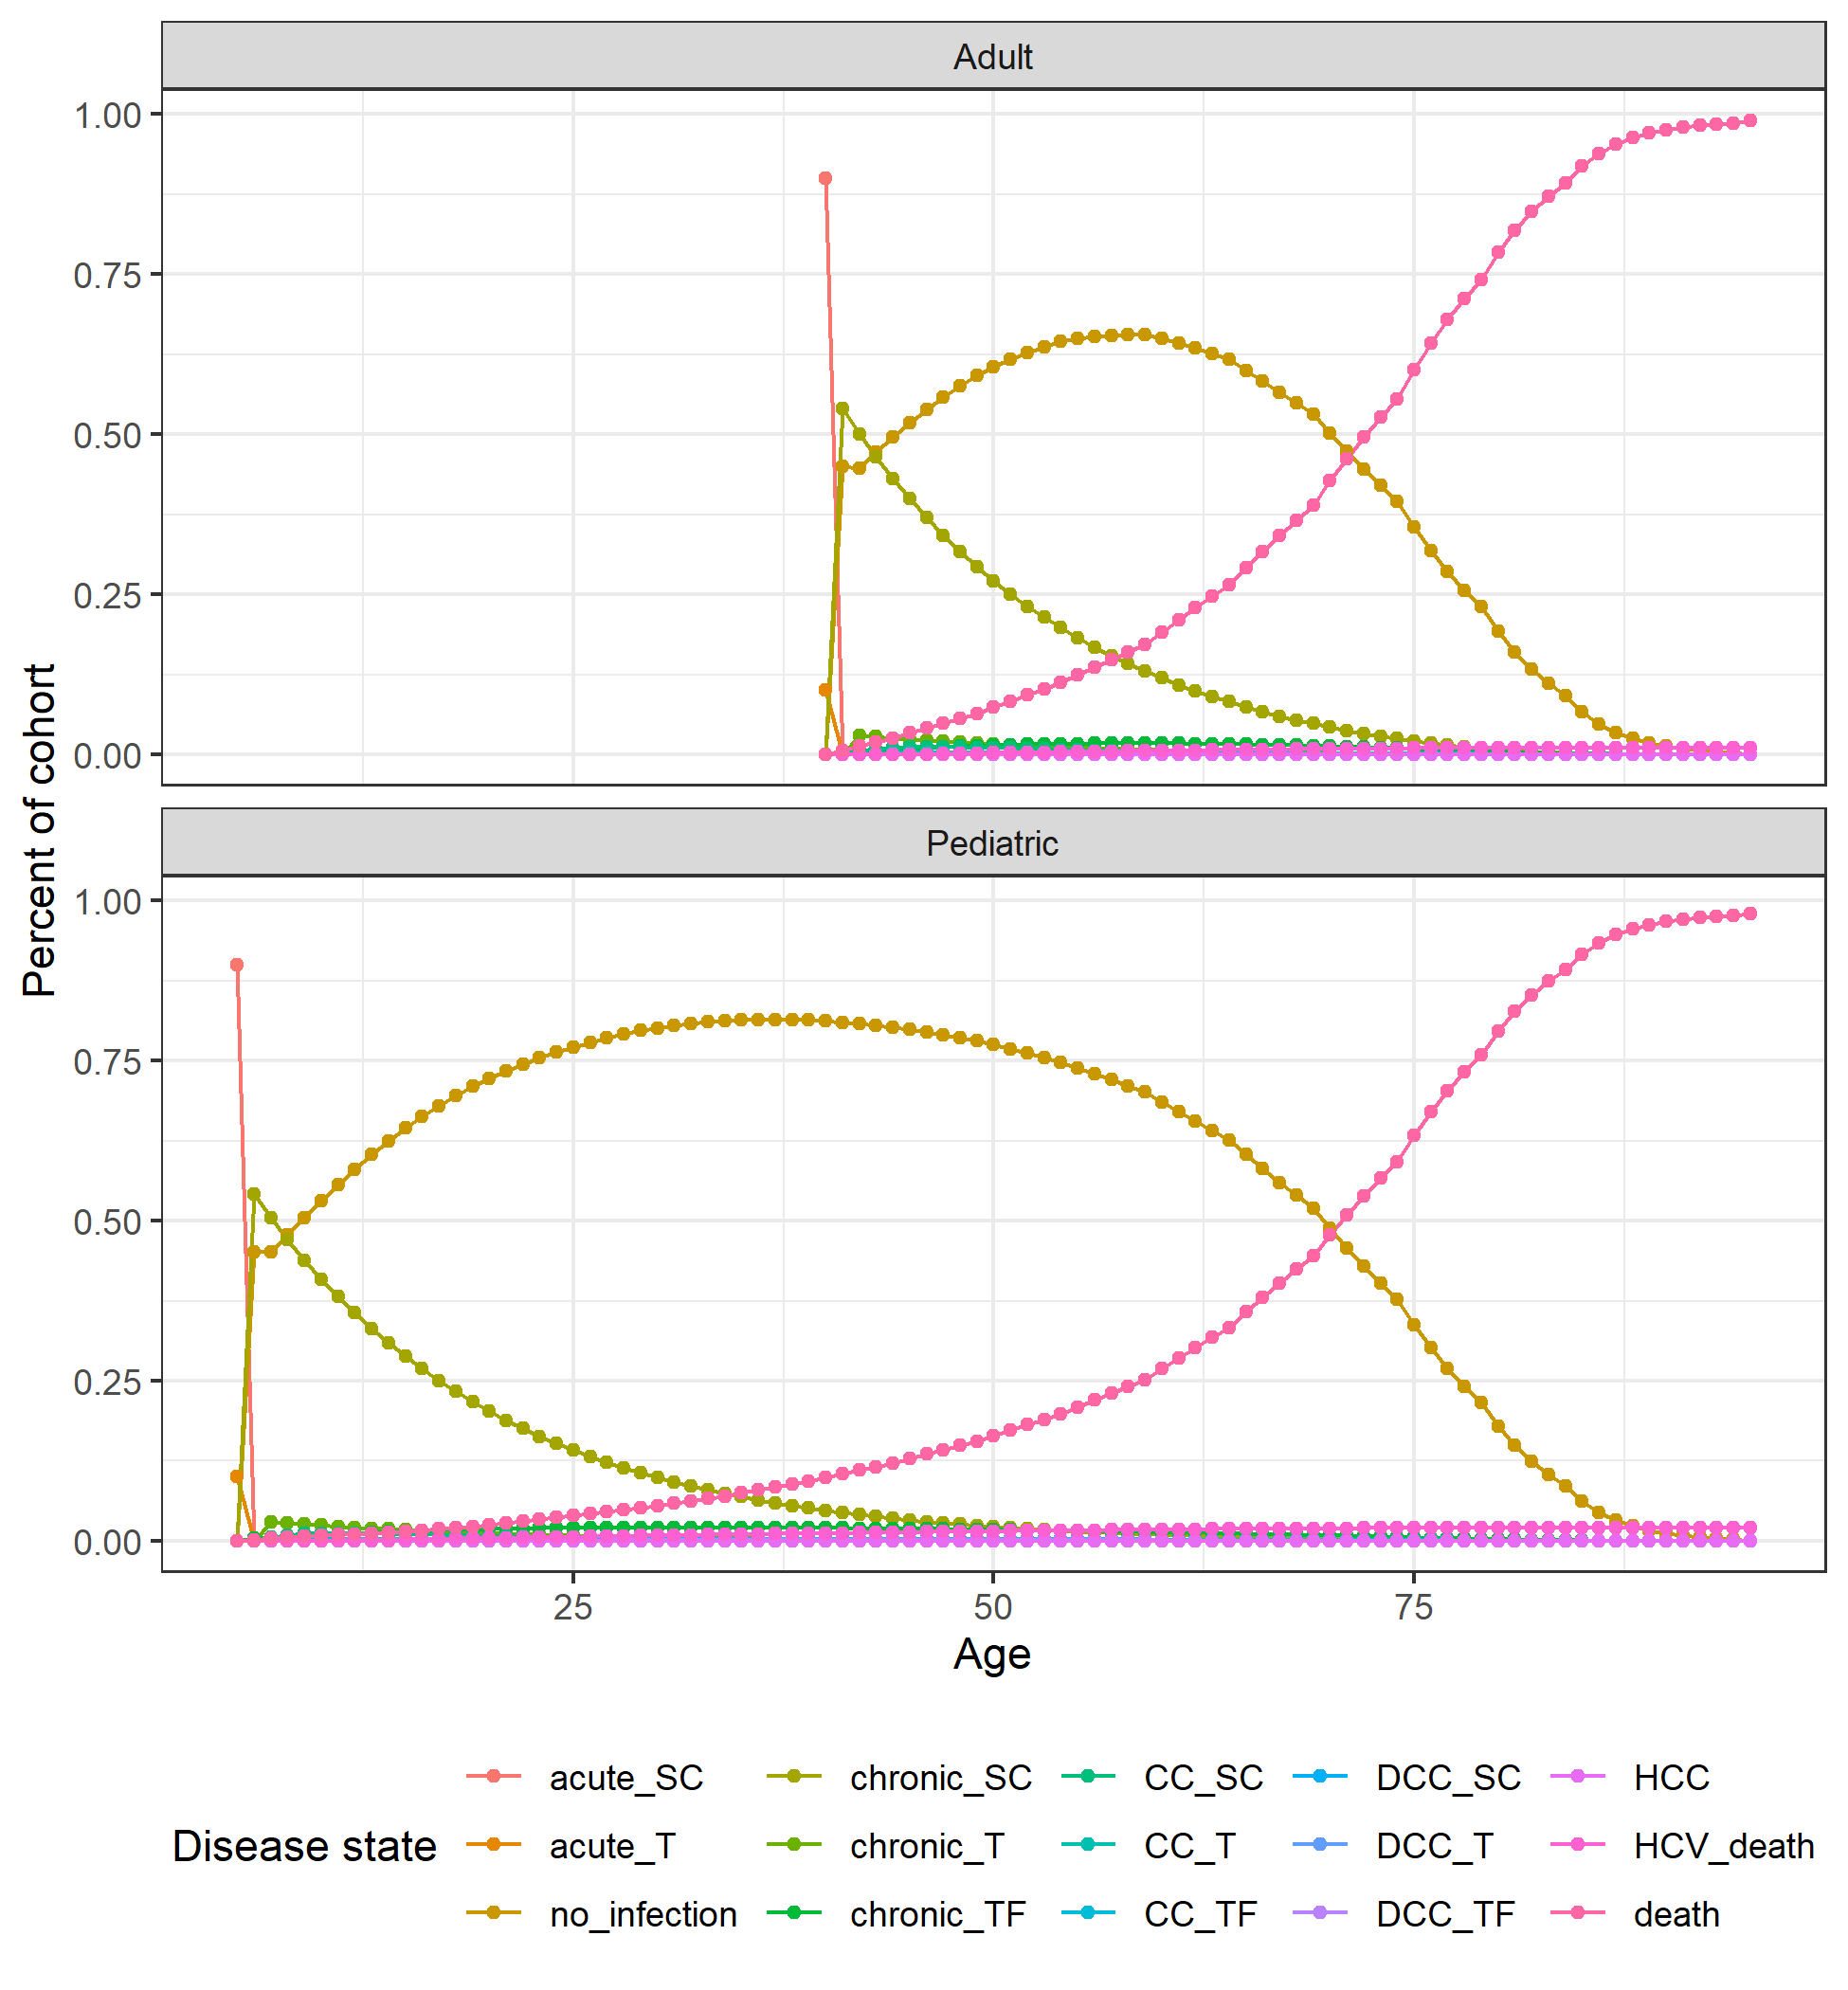
Figure 8.6: Markov trace plot for HCV pediatric and adult cohorts.
Markov trace plot for HCV pediatric and adult cohorts. Disease state names: acute_SC, Acute subclinical; acute_T, Acute on AVT; CC_SC, Compensated cirrhosis subclinical; CC_T, Compensated cirrhosis on AVT; CC_TF, Compensated cirrhosis treatment failure; chronic_SC, Chronic HCV subclinical; chronic_T, Chronic HCV on AVT; chronic_TF, Chronic HCV treatment failure; DCC_SC, Decompensated cirrhosis subclinical; DCC_T, Decompensated cirrhosis on AVT; DCC_TF, Decompensated cirrhosis treatment failure; HCC, Hepatocellular carcinoma; HCV_death, HCV-related death; init, Initiation; no_infection, No infection; death, Other-cause death.
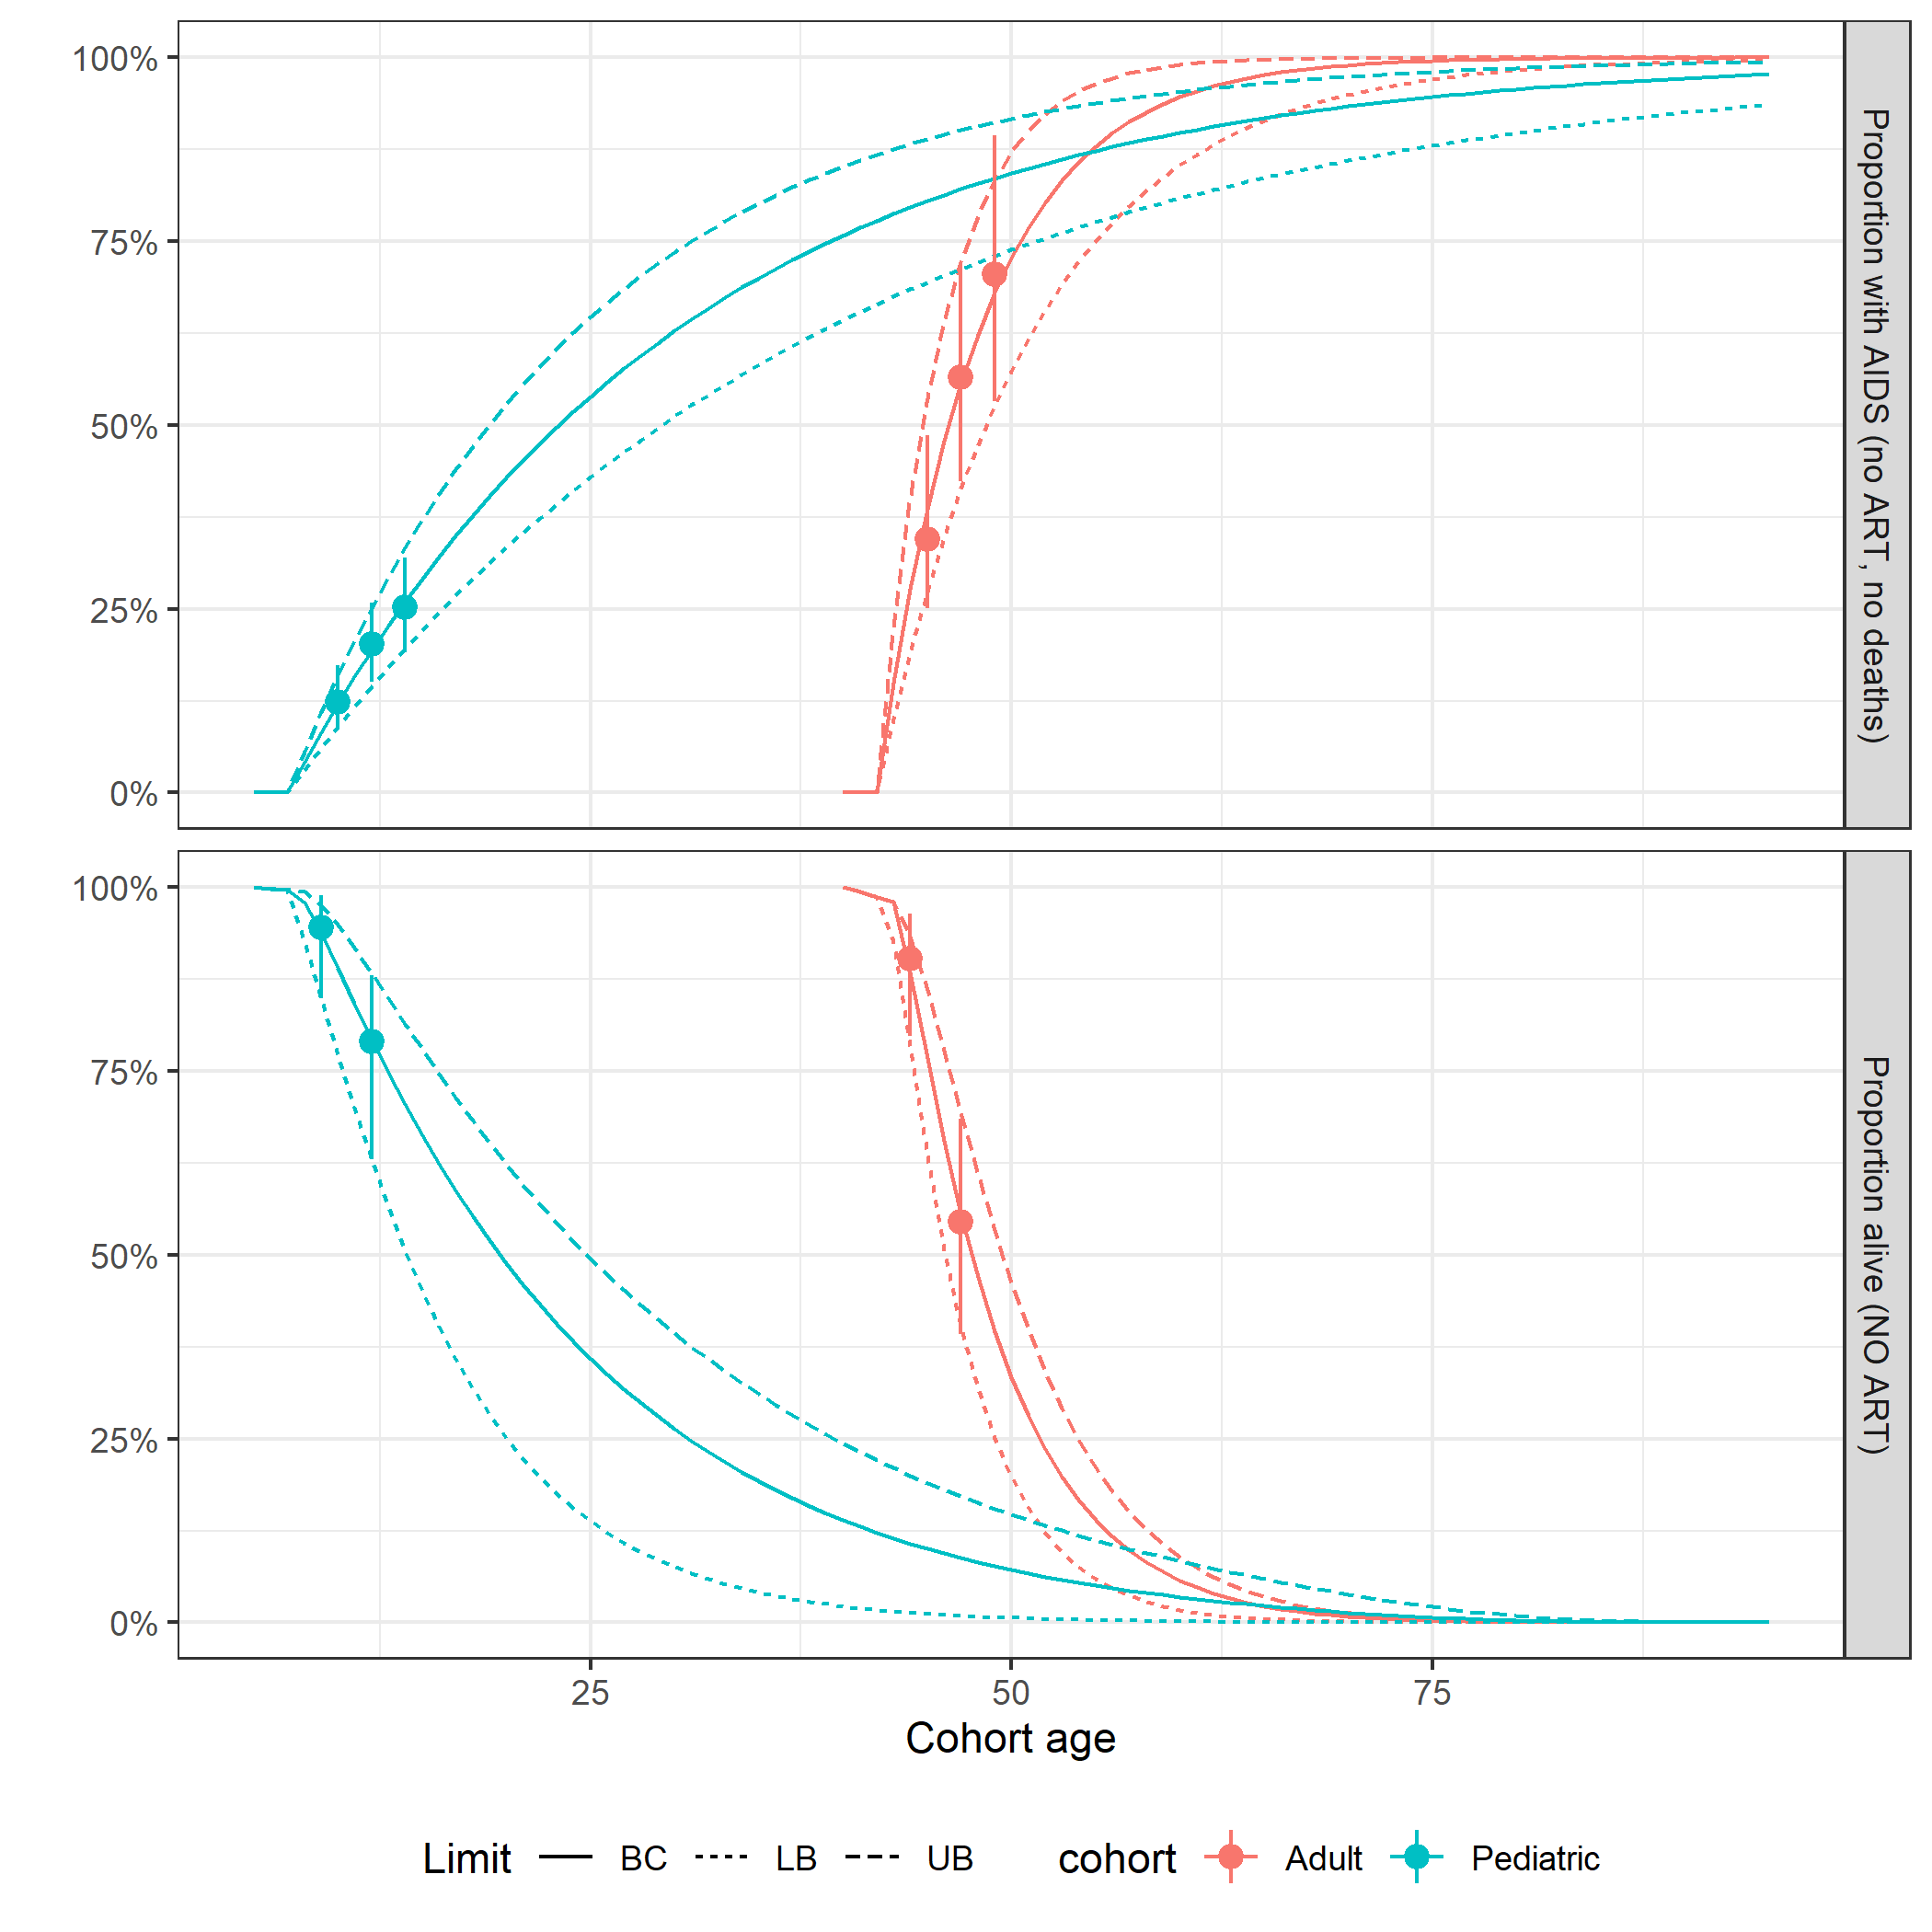
Figure 8.7: Calibration plots for HIV natural history transition probabilities.