1 作图
1.1 曲线簇
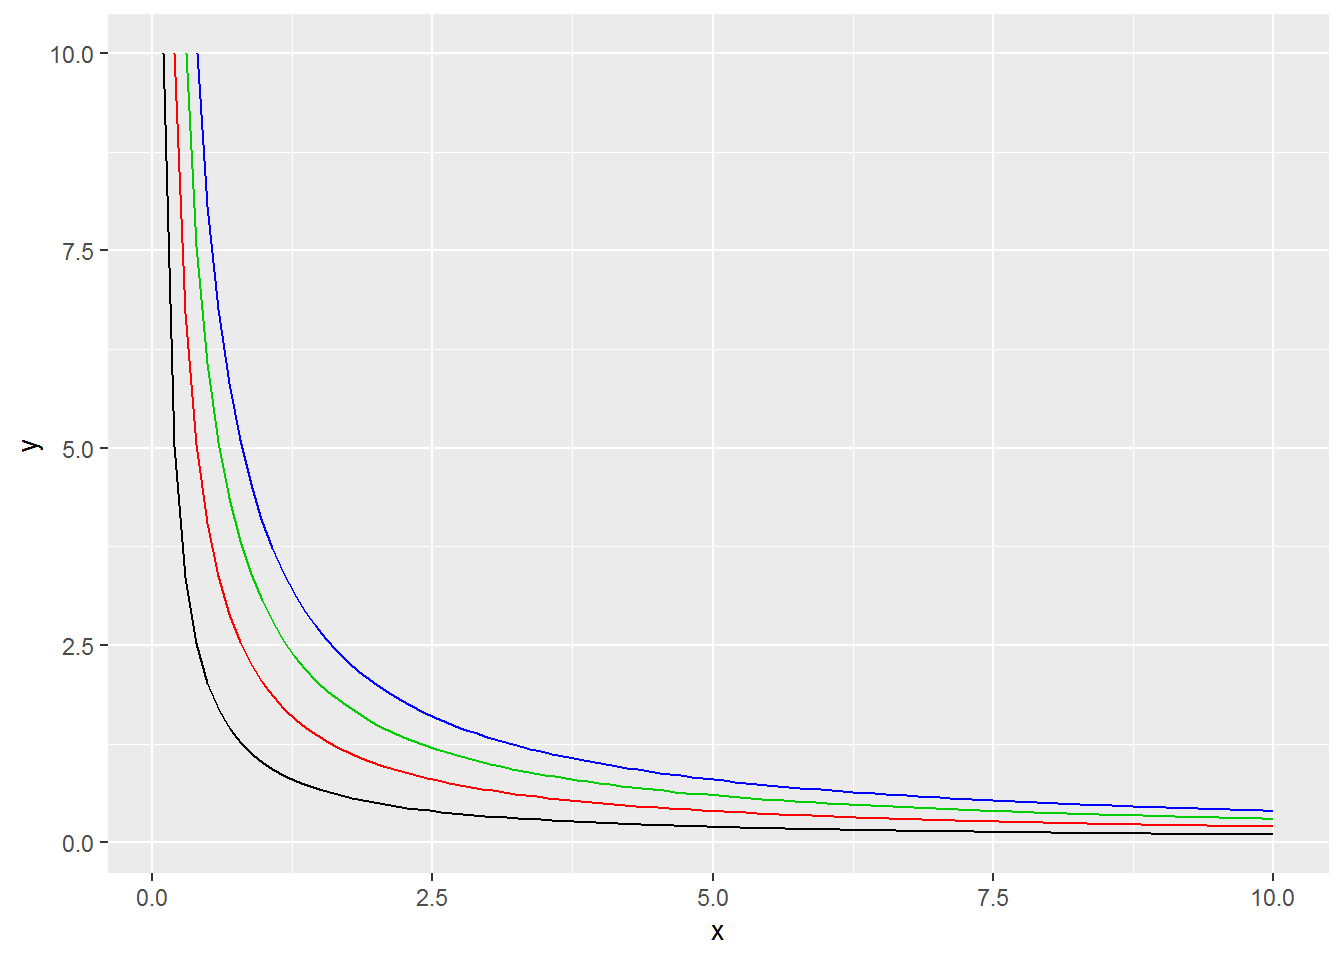
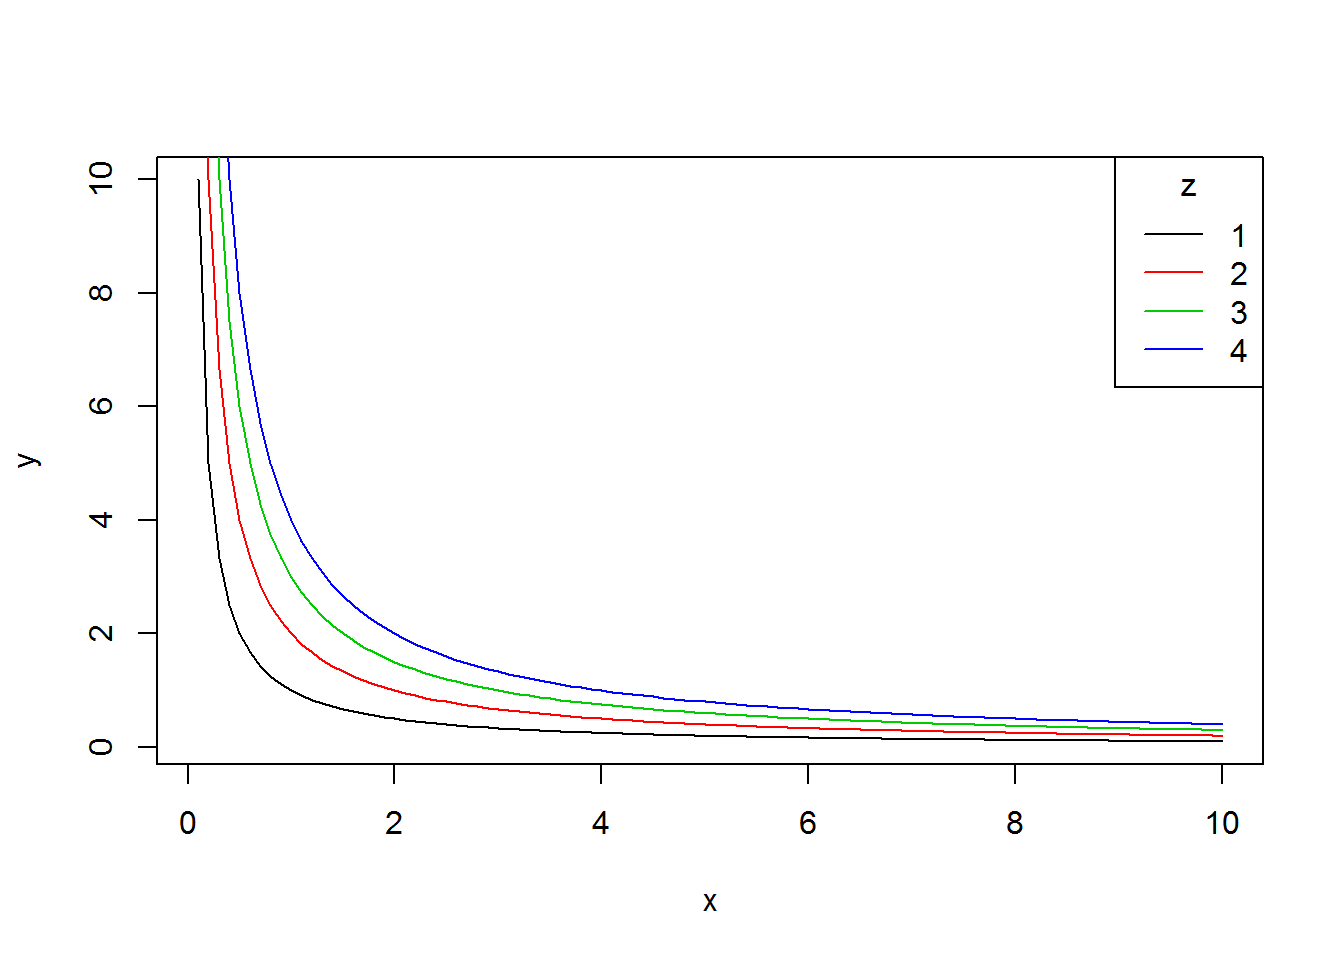
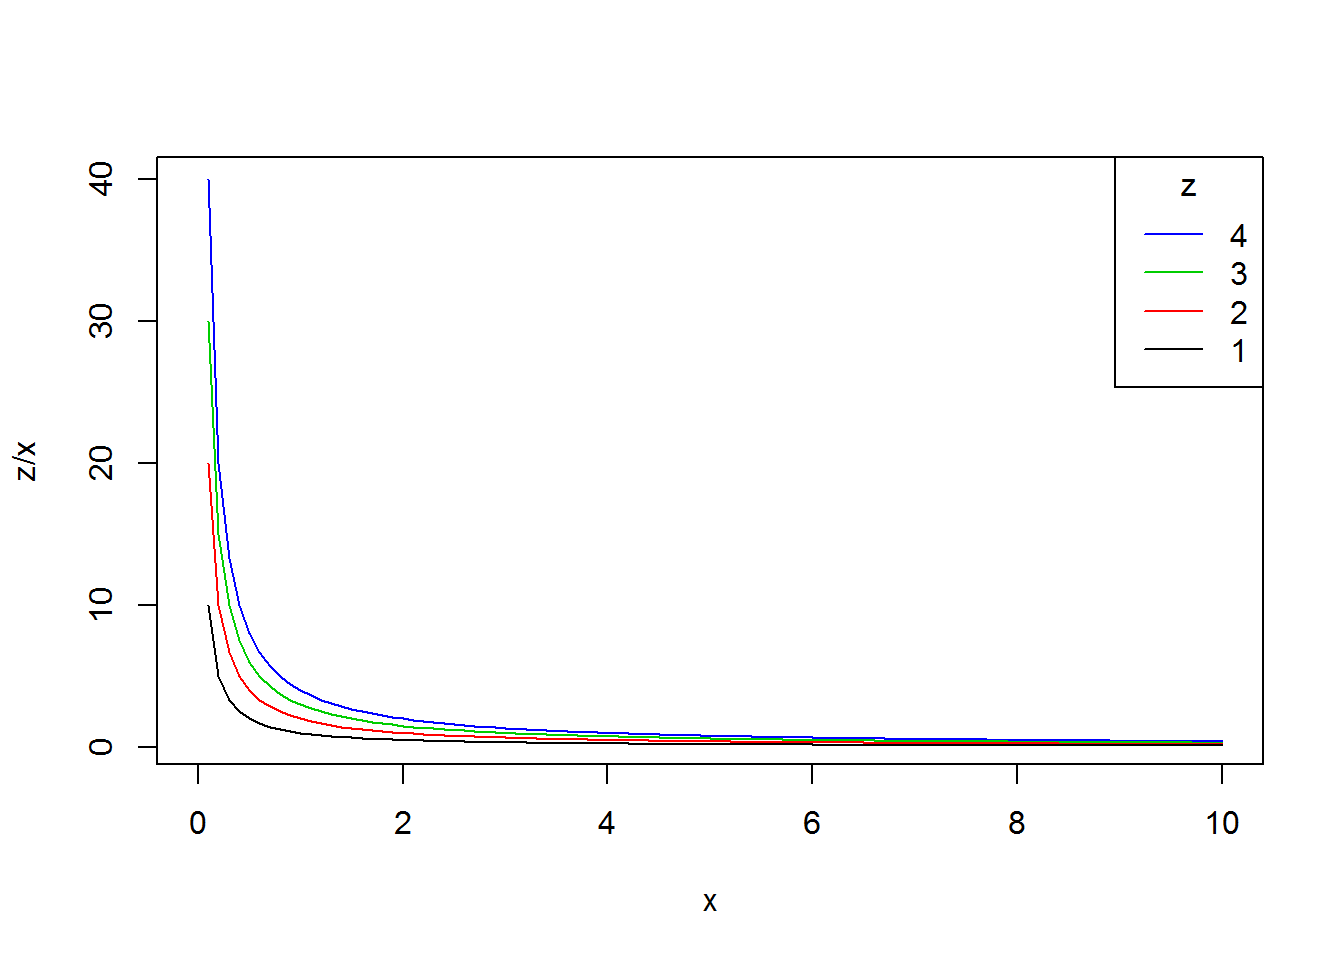
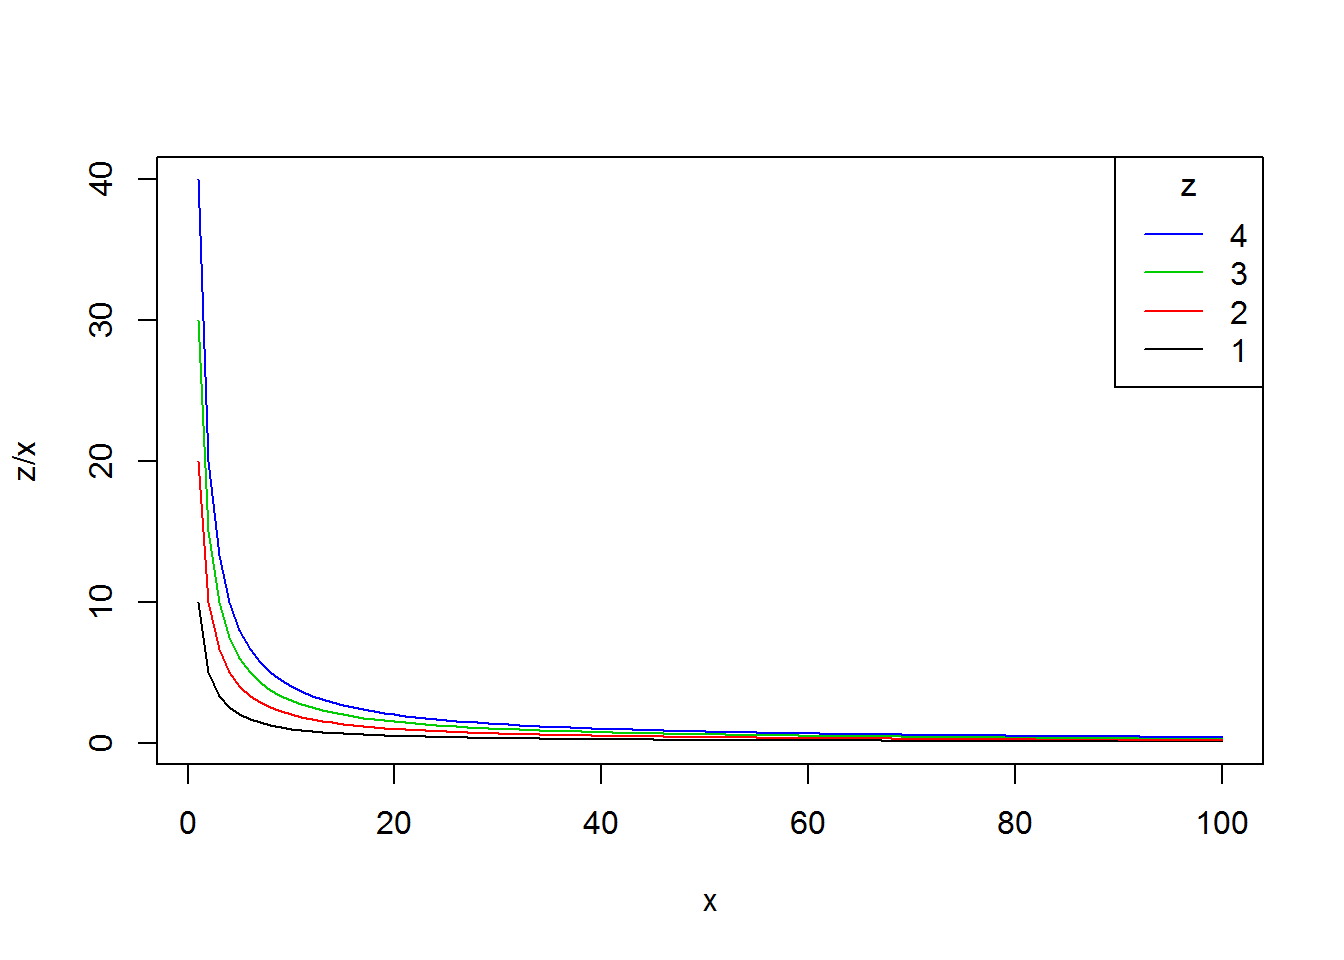
函数 \(xy = z\),\(z\) 分别取值1、2、3、4, \(x\) 和 \(y\) 的取值区间为 (0, 10],如何画出这4条曲线?(出处)
B 版
x <- seq(0.1, 10, by = 0.1)
plot(x, 1 / x,
  type = "l", xlab = "x", ylab = "y"
)
for (z in 2:4) lines(x, z / x, col = z)
legend("topright",
  legend = 1:4, col = 1:4,
  lty = 1, title = "z"
)
# or
for (z in 4:1) {
  curve(z / x, 0, 10, add = z < 4, col = z)
}
legend("topright",
  legend = 4:1, col = 4:1,
  lty = 1, title = "z"
)
# or
matplot(outer(
  seq(0.1, 10, by = 0.1), 1:4,
  function(x, a) a / x
),
xlab = "x", ylab = "z/x", type = "l",
col = 1:4, lty = 1
)
legend("topright",
  legend = 4:1, col = 4:1,
  lty = 1, title = "z"
)
T 版
library(ggplot2)
library(magrittr)
expand.grid(
  x = seq(0.1, 10, by = 0.1),
  z = 1:4
) %>%
  transform(y = z / x, z = factor(z)) %>%
  ggplot() +
  geom_line(aes(x, y, color = z))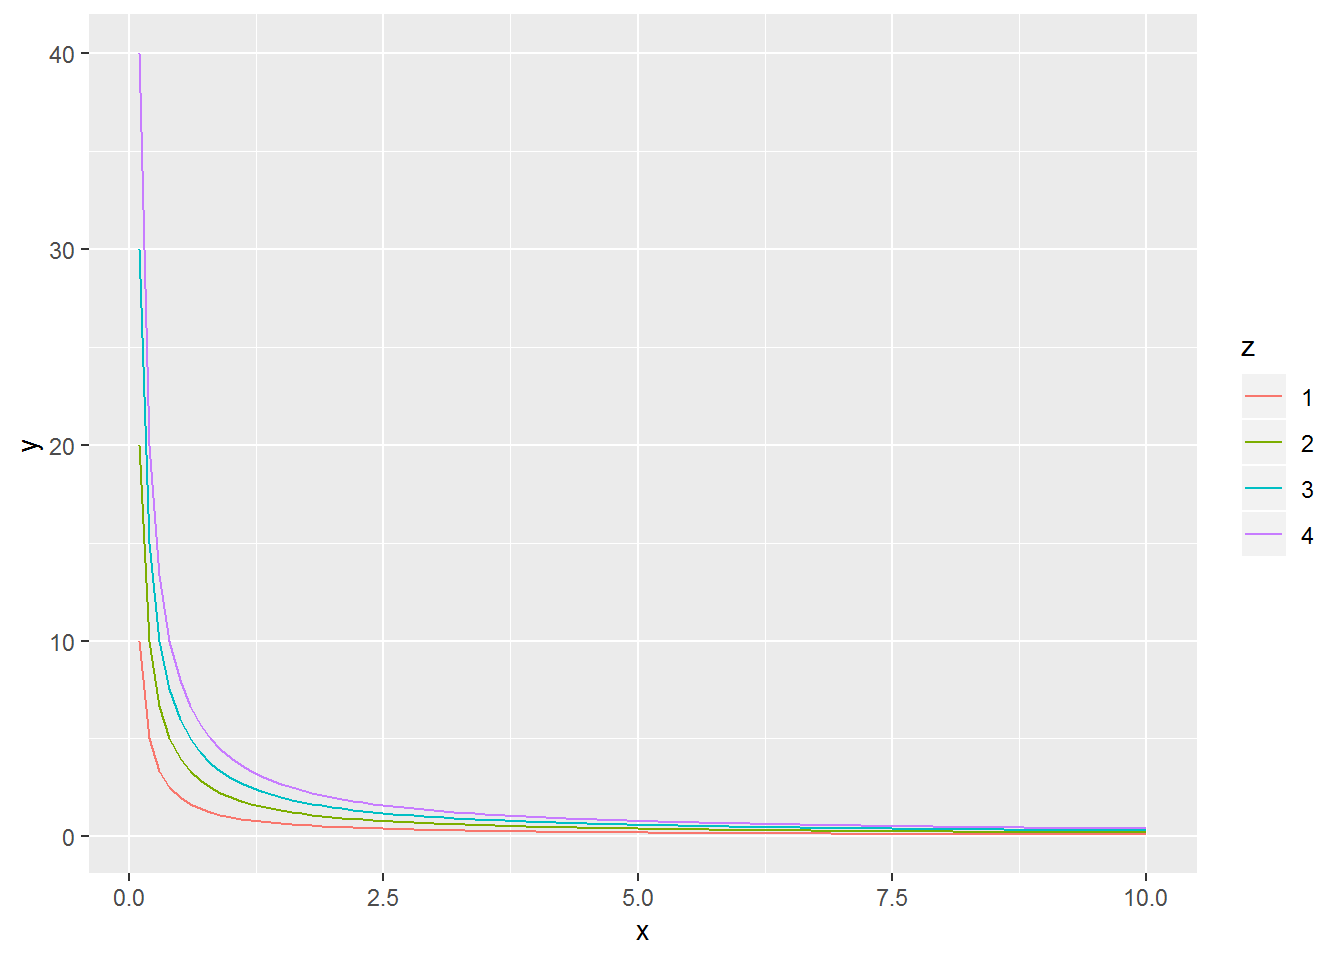
# Or
out <- ggplot(data.frame(x = c(0, 10)), aes(x))

for (i in 1:4) {
  out = out +
    stat_function(fun = function(.x ,z) z/.x,
                            color = i,
                            args = list(z=i),
                            xlim=c(i/10,10) )
}
out