Chapter 2 Problem 2
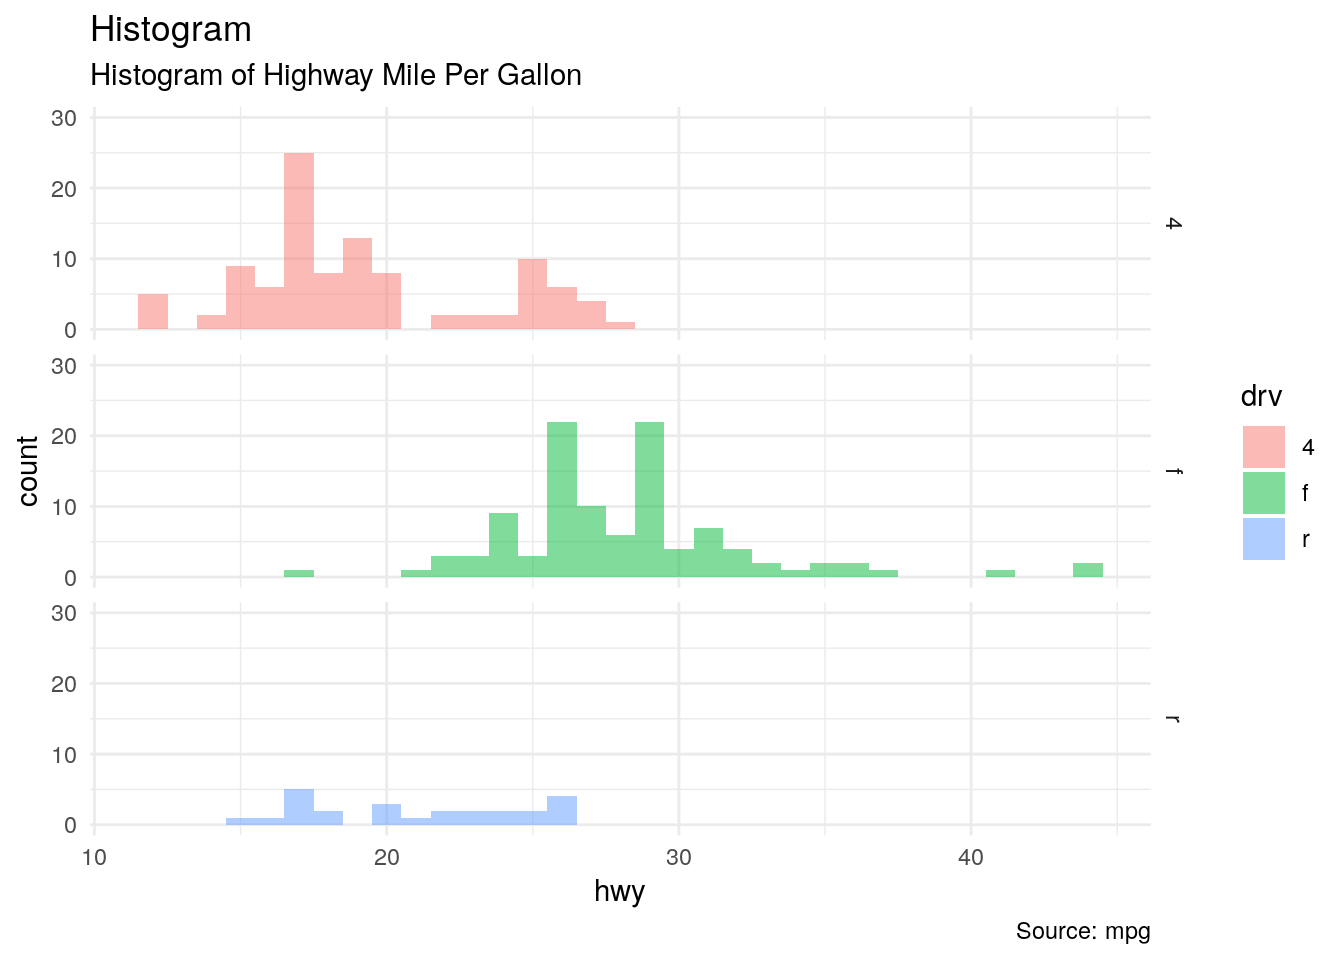
Using the mpg dataset in the ggplot2 package. replicate the plot below using the Following settings.
- Set alpha = 0.5 for the width of bars
- Use facet_grid()
- Use theme_minimal()
ggplot(mpg, aes(hwy)) +
  geom_bar(aes(fill = drv), alpha = 0.5, width = 1) +
  facet_grid(drv~ .) +
  scale_y_continuous(limits = c(0, 30))  +
  labs(
    title = "Histogram",
    subtitle = "Histogram of Highway Mile Per Gallon",
    caption = "Source: mpg"
  ) +
  theme_minimal()