6.2 Pie Charts
A pie chart (or a circle chart) is a circular statistical graphic that is divided into slices (or wedges) to illustrate numerical proportions.
- Open a new Excel worksheet and enter Earned Degree data, as shown below.
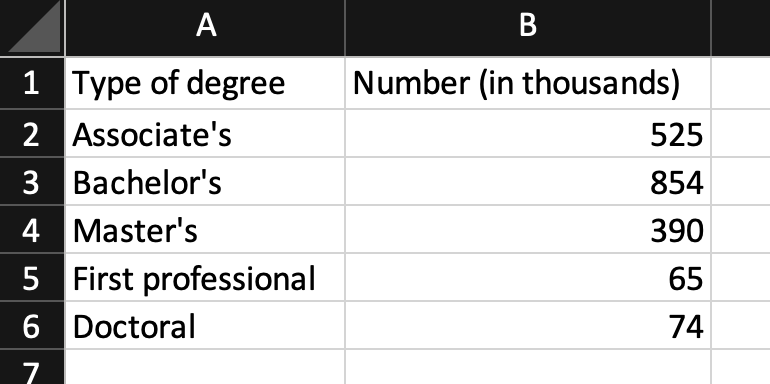
Figure 6.1: Earned degree data.
- Select the cells A1:B6.
- Go to the
Inserttab. Select theleftmost 2D Pie diagramin the top row in theChartsribbon.
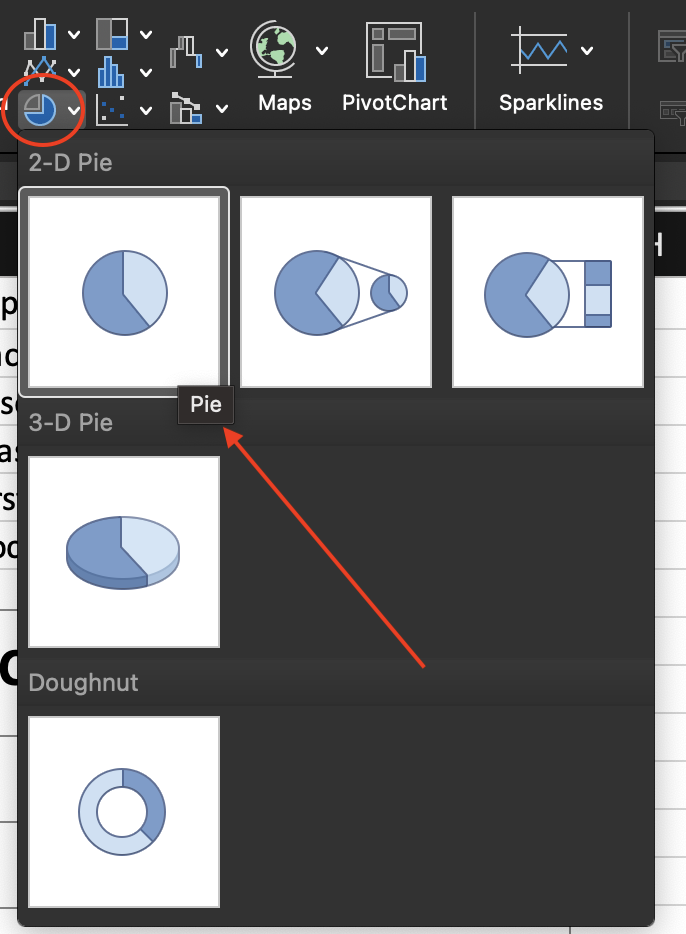
Figure 6.2: Pie chart options in the Insert tab.
- If your graph does noy appear with a title and legend, do Steps 5 and 6 below.
- When you select the graph, the tab
Chart Designappears in the menu bar (you must select the graph for this tool to appear). - Choose Style 3 for your pie chart.
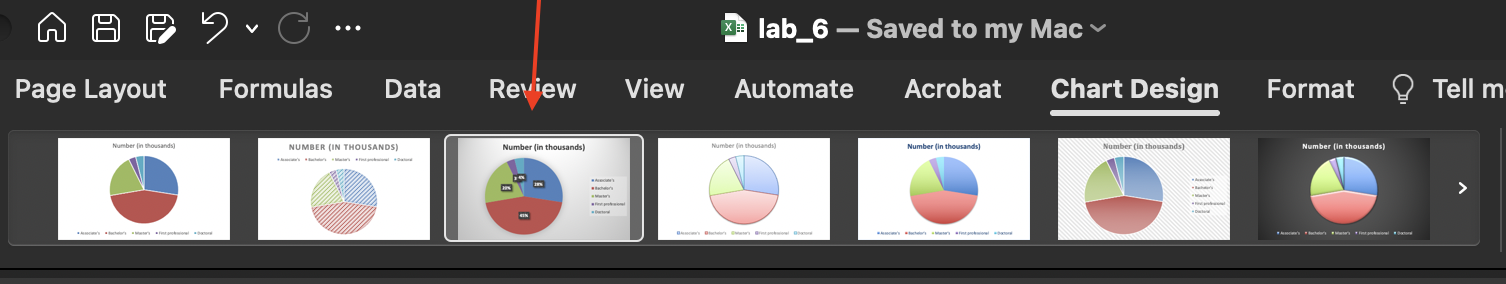
Figure 6.3: Options in the Chart Design tab for pie charts.
Note: Style 3 includes titles, legends, and labels in percent form. Check other styles to see the differences among them.
- Replace Number (in thousands) with the title Earned Degrees Conferred in 2000.
Note: You can RIGHT-click on one of the data labels (e.g., on the percent of 45%) and then select Format Data Labels to change the format of the labels in your graph.