Chapter 3 Indicators
The following indicators have been chosen as the most suitable for summarizing the state of gender equality in trade. They are subject to ongoing review as additional data sources become accessible.
Employment and average monthly earnings in tradable and non-tradable industries
Employment and average monthly earnings in industries by export-intensity
Employment and average monthly earnings in export-dependent industries
Domestic value added content in gross exports by sex and broad sector
Employment and average monthly earnings in tradable and non-tradable industries
Employment in tradable and non-tradable industries
These data provide summary statistics on the number of employed females and males in both tradable and non-tradable industries, categorized by country and year.
The key advantage of this indicator lies in its extensive coverage and comparability. We encompass a wide range of countries across the globe and offer a long time series. Our assumption is that trade impacts both female and male employees, as evidenced by their proportions in tradable sectors.
We utilize ILO data with a 1-digit level of ISIC aggregation, ensuring maximum coverage and comparability across countries. The country-specific data are official, while country groupings are derived from ILO modelled estimates, including both ILO estimates and imputations.
The tradable sectors definition is based on the OECD Chapter 2. Thinking global, developing local: Tradable sectors, cities and their role for catching up (OECD 2018).
We include transportation among tradable sectors, because international transport is considered to be a key enabler of international trade (see, eg. https://blogs.worldbank.org/transport/international-transport-costs-why-and-how-measure-them) and because ILO reports groups H (transport) and J (information and communication) together.
Tradable industries include agriculture (A), industry (B, C, D, E), transportation (H), information and communication (J), financial and insurance activities (K), and other services (R, S, T, U). Transportation is included among tradable sectors because international transport is a key enabler of international trade and because the ILO groups this sector together with information and communication.
Non-tradable industries include construction (F), distributives trade and repairs (G), accommodation and food services activities (I), and real estate activities (L), business and administrative services (MN), public administration (OPQ). Business services refer to professional, scientific and technical activities.
Sources: - ILO Employment by sex and economic activity (thousands) – Annual, (Series code: EMP_TEMP_SEX_AGE_ECO_NB_A)
- ILO Employment by sex and economic activity – ILO modelled estimates, Nov. 2023 (thousands) – Annual (Series code: EMP_2EMP_SEX_ECO_NB_A)
Country coverage: 193 economies
Time coverage: 1991-2023
Average monthly earnings in tradable and non-tradable industries
The data represent female and male average monthly earnings of employees in tradable and non-tradable industries by country and year. Average monthly earnings of employees are reported in current USD and 2017 PPP USD.
The tradable sectors definition is based on the OECD Chapter 2. Thinking global, developing local: Tradable sectors, cities and their role for catching up (OECD 2018). We utilize ILO data with a 1-digit level of ISIC aggregation, ensuring maximum coverage and comparability across countries.
We include transportation among tradable sectors, because international transport is considered to be a key enabler of international trade (see, eg. https://blogs.worldbank.org/transport/international-transport-costs-why-and-how-measure-them) and because ILO reports groups H (transport) and J (information and communication) together.
Tradable industries include agriculture (A), industry (B, C, D, E), transportation (H), information and communication (J), financial and insurance activities (K), and other services (R, S, T, U). Transportation is included among tradable sectors because international transport is a key enabler of international trade and because the ILO groups this sector together with information and communication.
Non-tradable industries include construction (F), distributives trade and repairs (G), accommodation and food services activities (I), and real estate activities (L), business and administrative services (MN), public administration (OPQ). Business services refer to professional, scientific and technical activities.
Sources: - ILO Average monthly earnings of employees by sex and economic activity – Annual (Series code: EAR_4MTH_SEX_ECO_CUR_NB_A)
Country coverage: 160 economies
Time coverage: 2000-2023
Employment and average monthly earnings in industries by export-intensity
This table presents sex-disaggregated data on employment and average monthly earnings in industries differentiated by export intensity. Export intensity is calculated as exports divided by domestic production (gross output).
Industries are split into four categories by percentage of exported domestic production:
| Category | Percentage |
|---|---|
| High export intensity | < 75% - 100%> |
| Medium-high export intensity | < 50% - 75%) |
| Medium-low export intensity | < 25% - 50%) |
| Low export intensity | < 0% - 25%) |
Employment data provides summary statistics on the number of female and male employees in industries by export intensity, by country and year. Data on wages represent average monthly earnings of female and male employees in industries by export intensity by country and year. Average monthly earnings are reported in current USD and 2017 Purchasing Power Parity (PPP) USD.
The OECD TiVA database is used to derive export intensity for 2-digit ISIC Rev.4 industries and to link the ILO detailed industry-level employment and wages data. Export intensity is calculated as exports divided by domestic production (gross output) and represents the share of goods and services produced in an economy that are exported. Industries (defined at ISIC 2-digit level) are divided into categories with respect to their export intensity (representing high, medium-high, medium-low and low export intensity). The corresponding employment numbers are aggregated up to the level of those groups. Average monthly earnings by export intensity category are derived using averages for industries in the group.
The country-specific data are official statistics as reported by countries. Earnings and employment statistics present several complications in terms of their international comparability, most of which arise from the variety of possible data sources. The various sources available – establishment surveys, household surveys and administrative records – differ in their methods, objectives and scope, which influences the results obtained. Thus, potential discrepancies can be identified due to a) discrepancies in data sources; b) classification of activities used by a country; c) informal employment; d) coverage of data source (geographical coverage, economic activities covered, types of establishments covered, etc.); e) working-age population definition.
Sources:
ILO Employment by sex and economic activity (thousands) – Annual, (Series code: EMP_TEMP_SEX_AGE_ECO_NB_A)
ILO Average monthly earnings of employees by sex and economic activity – Annual (Series code: EAR_4MTH_SEX_ECO_CUR_NB_A)
OECD Trade in Value Added (TiVA) 2023 edition: Principal Indicators
Country coverage: 62 economies
Time coverage: 1995-2020
Employment and average monthly earnings in export-dependent industries
This table presents sex-disaggregated data on employment and average monthly earnings in industries based on domestic value added content in gross exports. Industries are represented by the economic activities defined in ISIC rev.4, at the 2-digit level, whenever data are available. They are grouped into four categories by the share of domestic value added in total gross exports.
| Group | Percentage |
|---|---|
| High exported value added | < 75% - 100%> |
| Medium-high exported value added | < 50% - 75%) |
| Medium-low exported value added | < 25% - 50%) |
| Low exported value added | < 0% - 25%) |
Employment data provides summary statistics on the number of female and male employees in industries by export dependency, by country and year. Data on wages represent average monthly earnings of female and male employees in industries by export dependency by country and year. Average monthly earnings are reported in current USD and 2017 Purchasing Power Parity (PPP) USD.
The OECD TiVA database is used to derive domestic value added intensity (i.e. export dependency) for 2-digit ISIC Rev.4 industries and to link the ILO detailed industry-level employment and wages data. Such derived export dependency reflects how much value added, generated anywhere in the domestic economy, is embodied per unit of total gross exports by industry (Martins Guilhoto et al., 2022). Domestic value added in gross exports is an estimation of value added, by an economy, in producing goods and services for export, simply defined as the difference between gross output at basic prices and intermediate consumption at purchasers’ prices. Industries (defined at ISIC 2-digit level) are divided into categories with respect to their exported value added (representing high, medium-high, medium-low and low exported value added). The corresponding employment numbers are aggregated up to the level of those groups. Average monthly earnings by export dependency category are derived using averages for industries in the group.
The statistical series assume that there are no differences in gender distribution between exporting and non-exporting firms. The proportions of male and female contributions to domestic value added are calculated assuming homogeneity in labour intensity, skills, etc., thereby stating that women represent a comparable share of value added to their proportion in employment. Without micro data linking, this is the most accurate approach available, maximizing coverage across countries and facilitating comparability of results.
The country-specific data are official statistics as reported by countries. Earnings and employment statistics present several complications in terms of their international comparability, most of which arise from the variety of possible data sources. The various sources available – establishment surveys, household surveys and administrative records – differ in their methods, objectives and scope, which influences the results obtained. Thus, potential discrepancies can be identified due to a) discrepancies in data sources; b) classification of activities used by a country; c) informal employment; d) coverage of data source (geographical coverage, economic activities covered, types of establishments covered, etc.); e) working-age population definition.
Sources:
ILO Employment by sex and economic activity (thousands) – Annual, (Series code: EMP_TEMP_SEX_AGE_ECO_NB_A)
ILO Average monthly earnings of employees by sex and economic activity – Annual (Series code: EAR_4MTH_SEX_ECO_CUR_NB_A)
OECD Trade in Value Added (TiVA) 2023 edition: Principal Indicators
Country coverage: 62 economies
Time coverage: 1995-2020
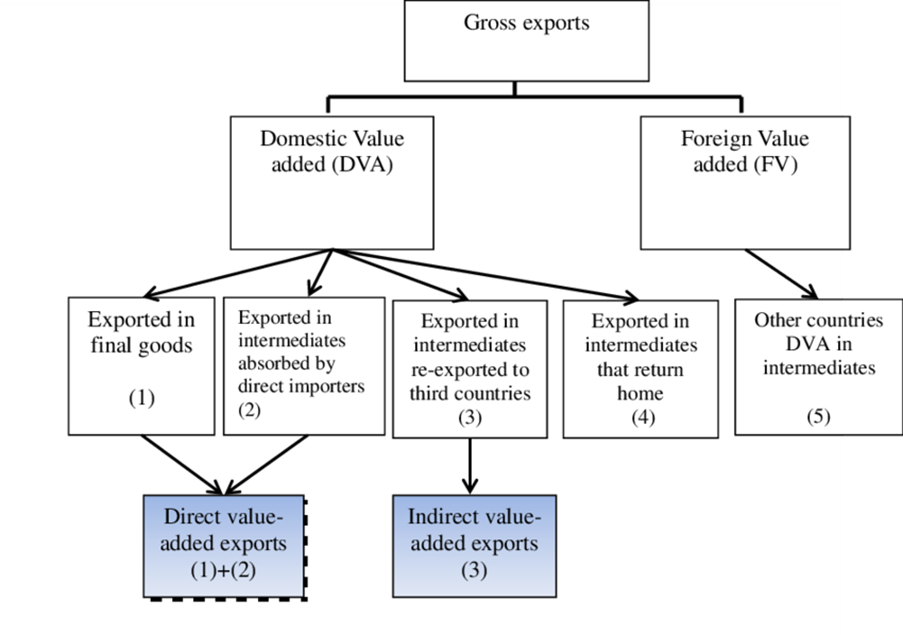
Domestic value added content in gross exports by sex and broad sector
This table presents data on estimated female and male contributions to domestic value added in gross exports (measured in current USD). Disaggregation by sex and selected broad sectors is available, as defined by economic activities in ISIC Rev.4: agriculture, industry, manufacturing and services. The table also includes direct and indirect components of domestic value added in gross exports.
This data provides insights into whether female employees’ contribution to creating domestic value added in gross exports differs from male employees and whether differences exist based on the type of economic activity.
Domestic value added content of exports, by industry “i” in country/region “c” to partner country/region “p”, represents the exported value added that has been generated anywhere in the domestic economy (i.e. not just by the exporting industry). The domestic value added content of gross exports can be split further into three components, direct domestic industry value added, indirect domestic value added and re-imported domestic value added (Martins Guilhoto et al., 2022).
The OECD TiVA database is used to derive direct and indirect domestic value added content in gross exports for 2-digit ISIC Rev.4 industries and to link the ILO detailed industry-level employment data. Direct domestic value added content in gross exports refers to the value added by domestic industries directly involved in the production of exported goods and services, while indirect domestic value added in gross exports accounts for the broader economic contributions of the entire domestic supply chain involved in supporting the production of exported goods and services. Industries (defined at ISIC 2-digit level) are divided into broad sectors with respect to their exported value added. The corresponding employment numbers are aggregated up to the level of those sectors.
The statistical series assume that there are no differences in gender distribution between exporting and non-exporting firms. The proportions of male and female contributions to domestic value added are calculated assuming homogeneity in labour intensity, skills, etc., thereby stating that women represent a comparable share of value added to their proportion in employment. Without micro data linking, this is the most accurate approach available, maximizing coverage across countries and facilitating comparability of results.
Sources:
ILO Employment by sex and economic activity (thousands) – Annual, (Series code: EMP_TEMP_SEX_AGE_ECO_NB_A)
OECD Trade in Value Added (TiVA) 2023 edition: Principal Indicators
Country coverage: 62 economies
Time coverage: 1995-2020