10 Gilbert Bay nutrient pool calculations
10.1 Compare JVL dissolved (filtered) nitrogen pool estimates to Naftz 2017
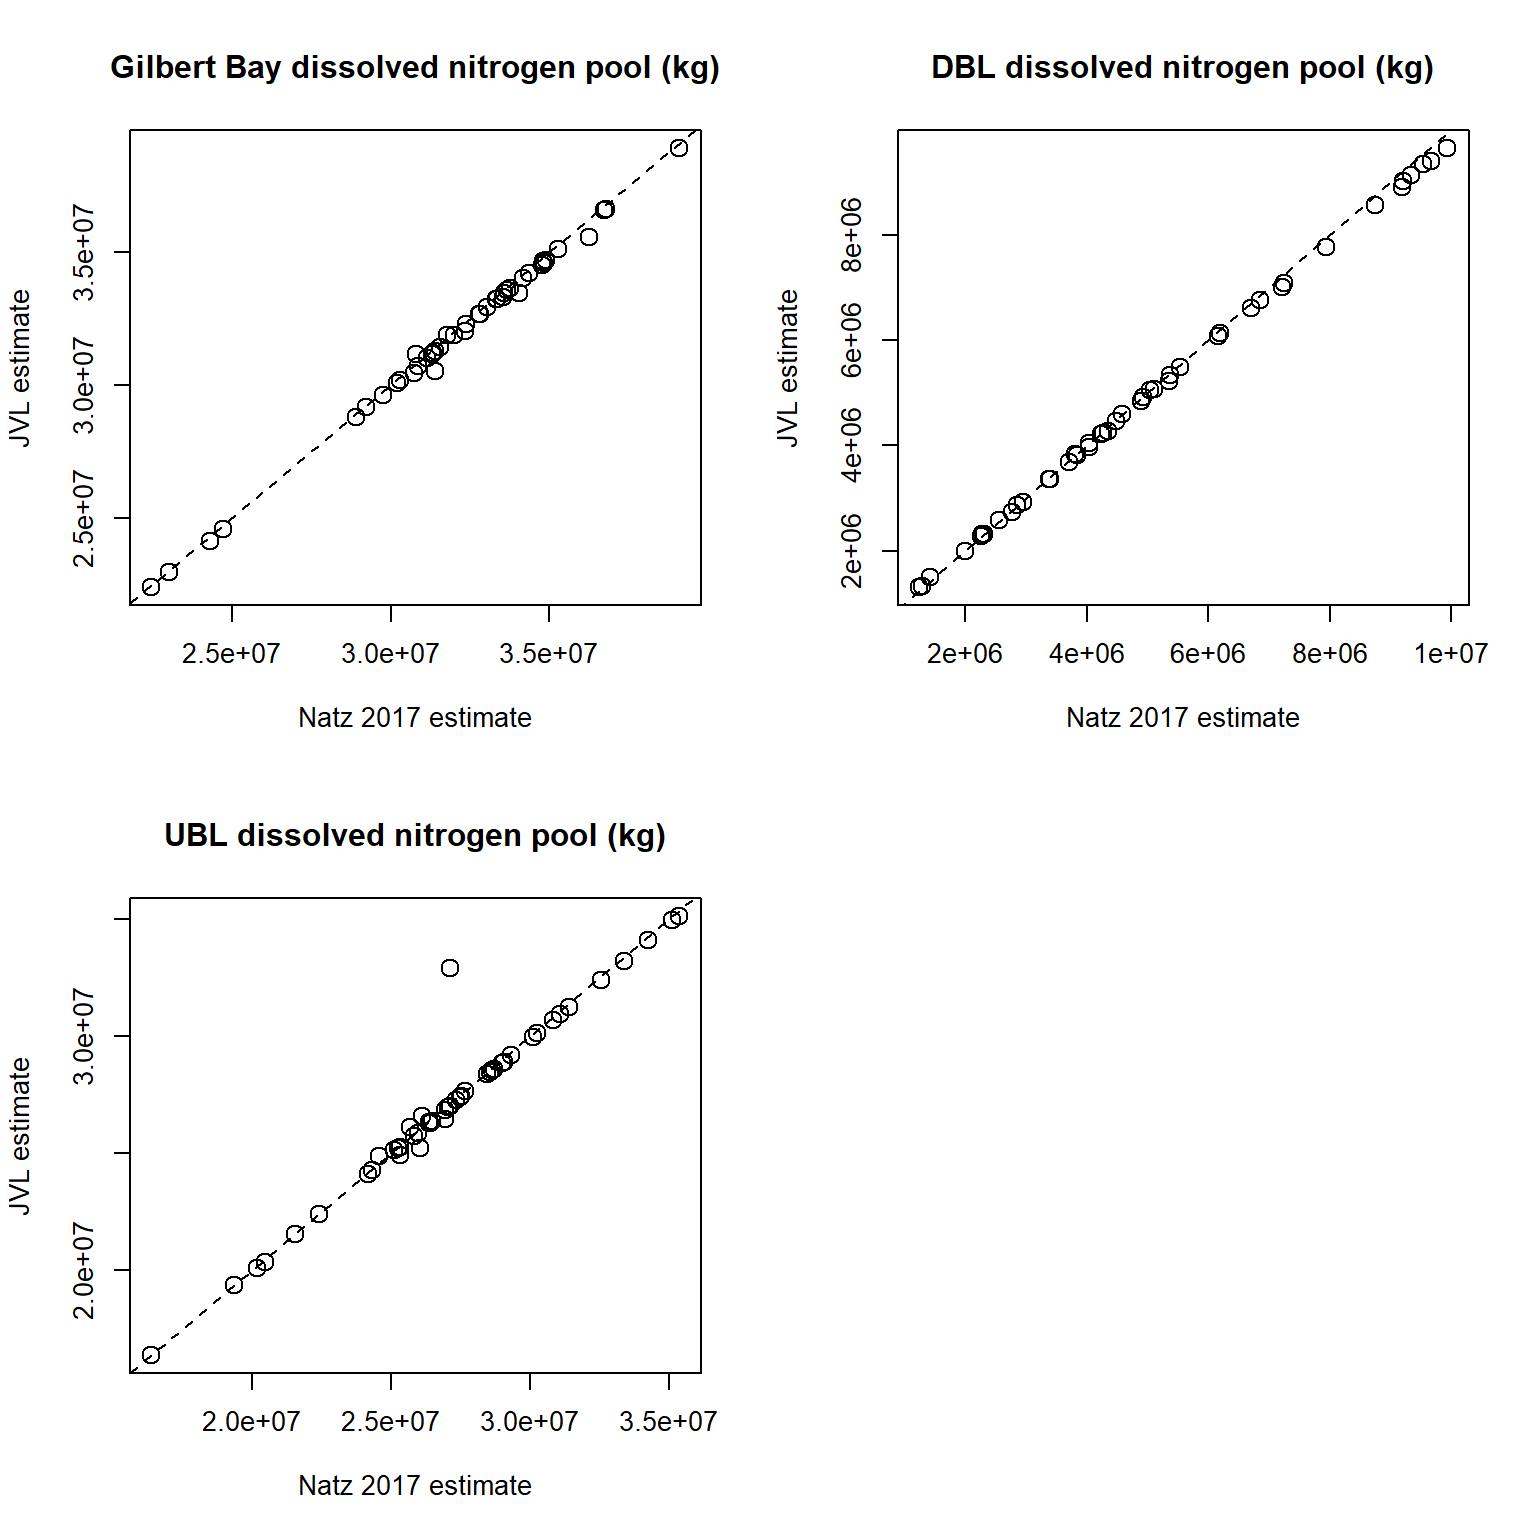
Figure 10.1: JVL (y-axis) versus Naftz 2017 (x-axis) estimates for dissolved (filtered) nitrogen pools in Gilbert Bay total (top left), deep brine layer (DBL, top right), and upper brine layer (UBL, bottom left).
Figure 10.2: JVL vs. Naftz dissolved nitrogen pool estimates.
10.2 Mass plots for all constituents
10.2.1 Total nitrogen
Figure 10.3: Gilbert Bay total nitrogen pool.
10.2.2 Filtered (dissolved) nitrogen
Figure 10.4: Gilbert Bay filtered nitrogen pool.
10.2.3 Total phosphorus
Figure 10.5: Gilbert Bay total phosphorus pool.
10.2.4 Filtered (dissolved) phosphorus
Figure 10.6: Gilbert Bay filtered phosphorus pool.
10.2.5 Salt
Figure 10.7: Gilbert Bay salt pool.
10.2.6 Chlorophyll a
Figure 10.8: Gilbert Bay chlorophyll a pool.