Chapter 5 Principal Component Analysis (PCA)
Main information about PCA:
- Step 1: No country selection process has been decided at this stage. Taking all countries in the imputed file - 194 economies.
- Step 2: Countries identified as with “at least 1 data point available” - 132 economies.
- Step 3: Countries identified as with “at least 2 data points available” - 114 economies.
Taking 2023 as the reference year.
The difference from the previous edition is that we have a full panel data set. All pillars are available for the same number of countries.
5.1 Pillar 1 - Economy
Pillar 1, Economy, includes 6 indicators. Two principal components were retained, together explaining 79.2 per cent of the total variance of the six original variables selected to measure the economy.
In this case, the first component (interpreted as Economic Development) accounts for 61.8 per cent of total variance. The second component (Employment) accounts for 17.4 per cent of total variance. Interpretation of dimensions is adopted based on the original publication of the index (UNCTAD and EEC 2019).
## [1] "IGI_1-1" "IGI_1-2" "IGI_1-3" "IGI_1-4" "IGI_1-5" "IGI_1-6"## # A tibble: 6 × 2
## Code Indicator
## <chr> <chr>
## 1 IGI_1-1 GDP per capita, PPP (constant 2017 international $)
## 2 IGI_1-2 Adjusted net national income per capita (constant 2015 US$)
## 3 IGI_1-3 Labour productivity - GDP per person employed (constant 2021 PPP USD)
## 4 IGI_1-4 Employment to population ratio, 15+, total (%) (modeled ILO estimate)
## 5 IGI_1-5 Electricity consumption/population (kWh per capita)
## 6 IGI_1-6 Exports of goods and services (% of GDP)## Importance of components:
## PC1 PC2 PC3 PC4 PC5 PC6
## Standard deviation 1.9248 1.0231 0.8761 0.62937 0.27734 0.08839
## Proportion of Variance 0.6175 0.1744 0.1279 0.06602 0.01282 0.00130
## Cumulative Proportion 0.6175 0.7919 0.9199 0.98588 0.99870 1.00000## [1] 3.70499505 1.04665553 0.76750857 0.39610821 0.07691956 0.00781308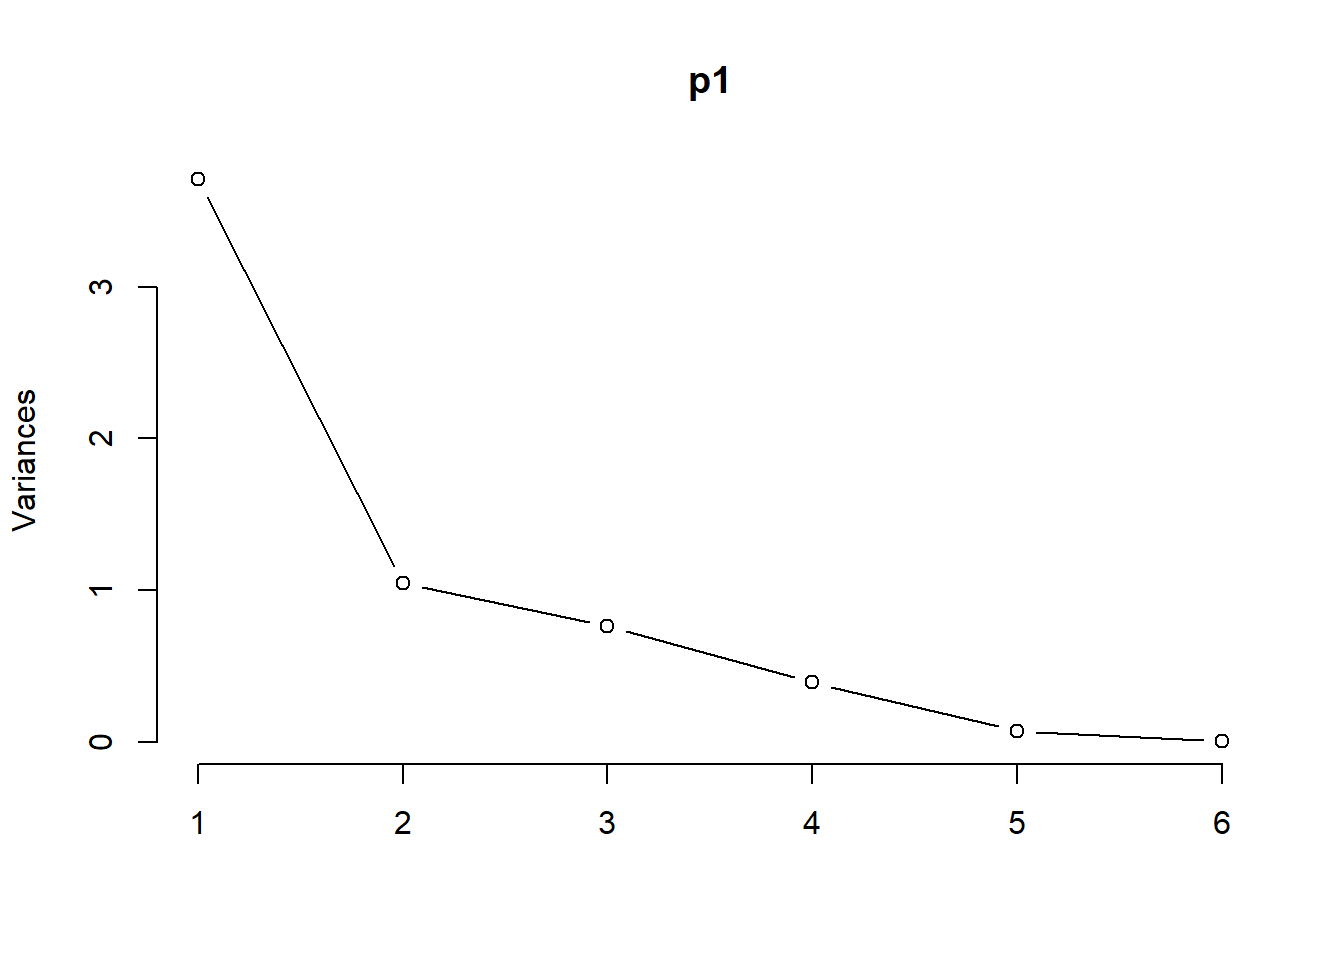
##
## Loadings:
##         [,1]   [,2]
## IGI_1-1  0.982
## IGI_1-2  0.931 -0.138
## IGI_1-3  0.968
## IGI_1-4        -0.968
## IGI_1-5  0.717 -0.295
## IGI_1-6  0.635  0.114
##
##                 [,1]  [,2]
## SS loadings    3.684 1.067
## Proportion Var 0.614 0.178
## Cumulative Var 0.614 0.792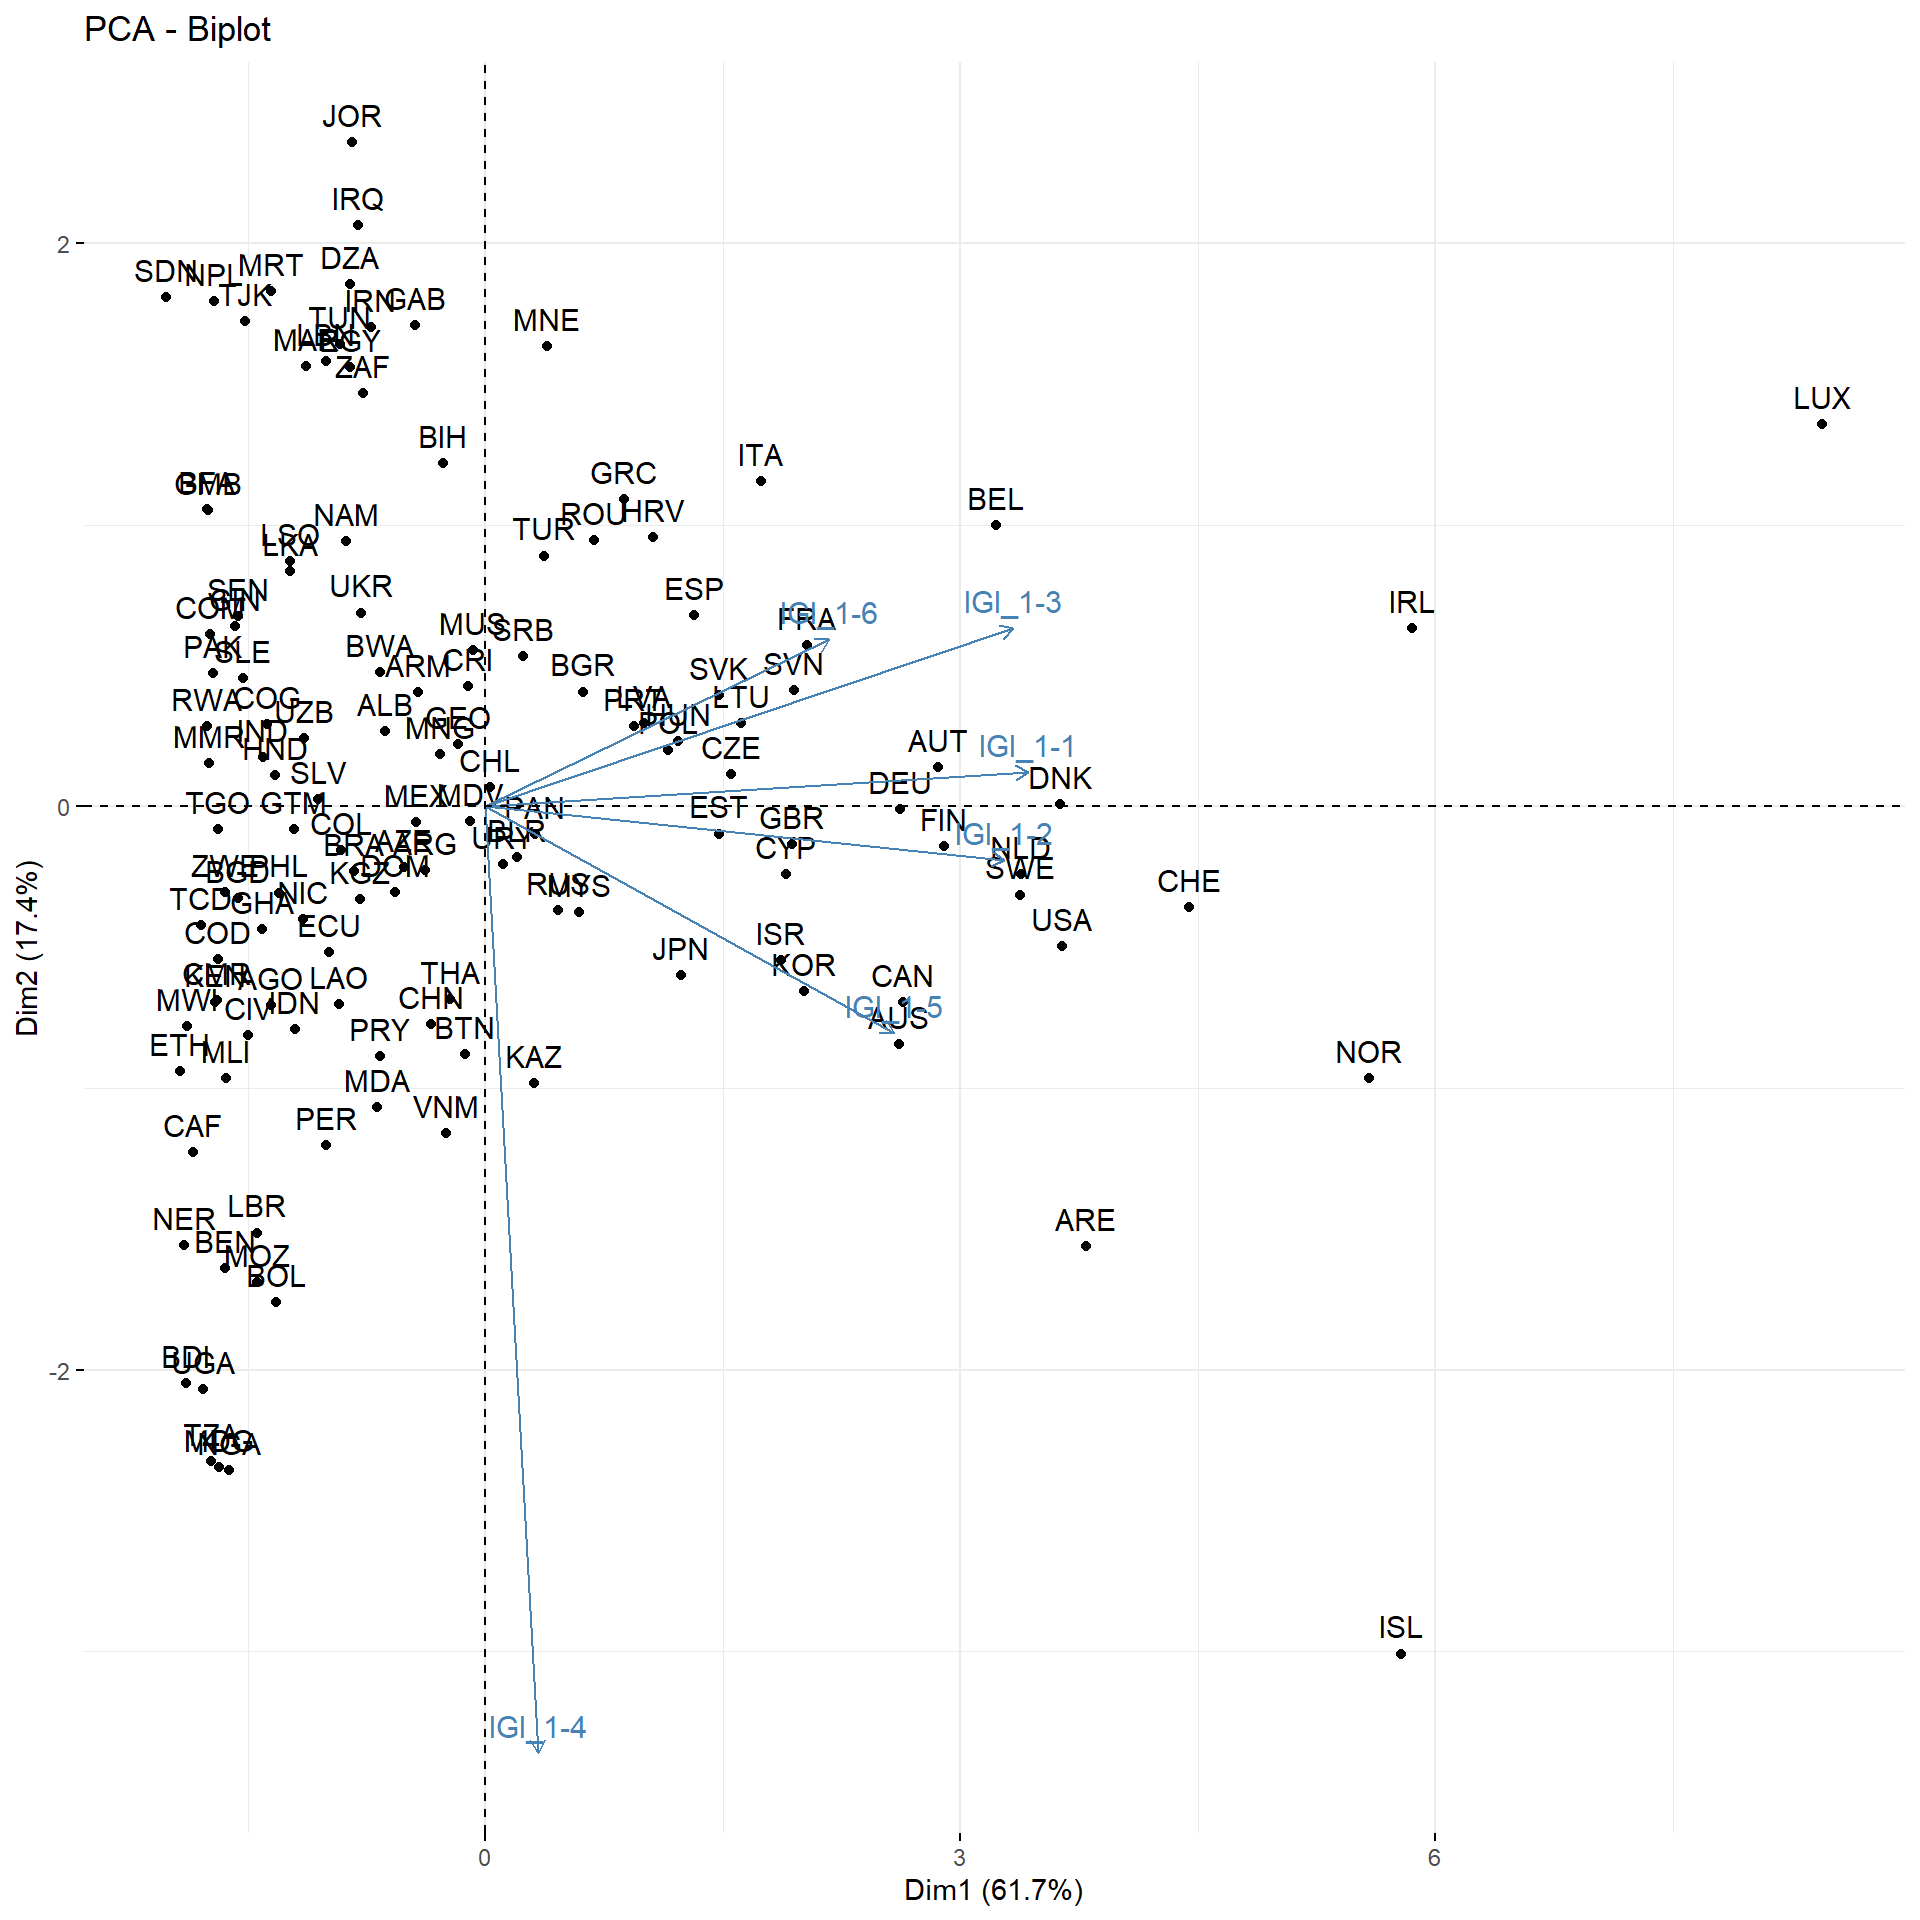
5.2 Pillar 2 - Living conditions
Pillar 2, Living Conditions, includes 7 indicators. One principal component is retained, together explaining 79.7 per cent of the total variance of the 7 original variables selected to measure the economy.
## [1] "IGI_2-1" "IGI_2-2" "IGI_2-3" "IGI_2-4" "IGI_2-5" "IGI_2-6" "IGI_2-7"## # A tibble: 7 × 2
## Code Indicator
## <chr> <chr>
## 1 IGI_2-1 Logistics performance index: Overall (1=low to 5=high)
## 2 IGI_2-2 Fixed broadband subscriptions per 100 inhabitants, by speed (per 100 inhabitants)
## 3 IGI_2-3 Under-five mortality rate, by sex (deaths per 1,000 live births)
## 4 IGI_2-4 Proportion of population using safely managed drinking water services, by urban/rural (%)
## 5 IGI_2-5 Gross enrolment ratio, secondary, both sexes (%)
## 6 IGI_2-6 Universal health coverage (UHC) service coverage index
## 7 IGI_2-7 Proportion of adults (15 years and older) with an account at a financial institution or mo…## Importance of components:
## PC1 PC2 PC3 PC4 PC5 PC6 PC7
## Standard deviation 2.362 0.71472 0.48492 0.48066 0.41933 0.40186 0.32629
## Proportion of Variance 0.797 0.07298 0.03359 0.03301 0.02512 0.02307 0.01521
## Cumulative Proportion 0.797 0.87000 0.90360 0.93660 0.96172 0.98479 1.00000## [1] 5.5791878 0.5108306 0.2351490 0.2310351 0.1758405 0.1614906 0.1064664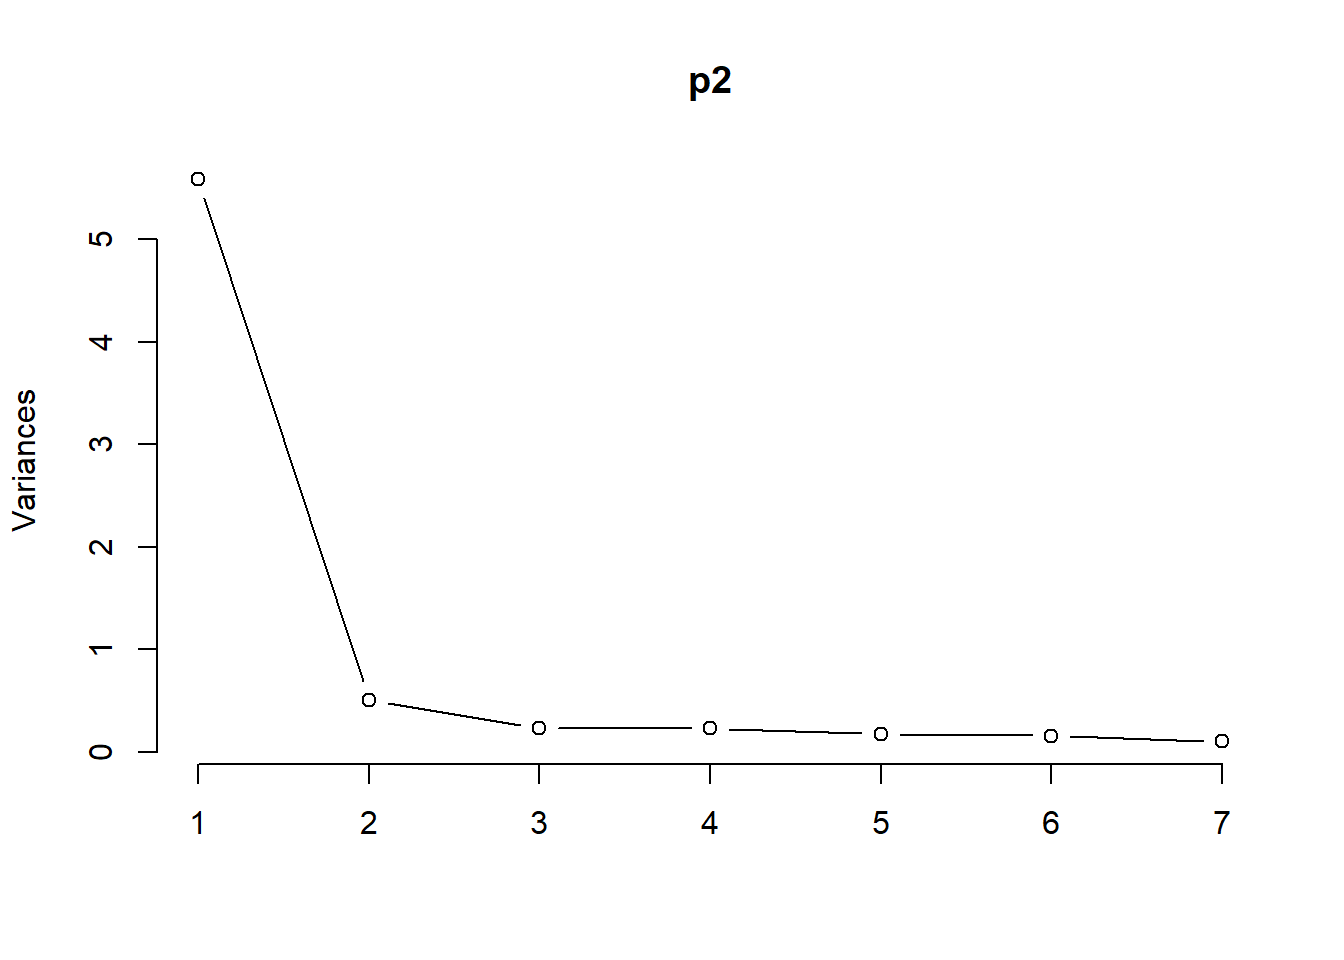
##           [,1]
## [1,] 0.8357334
## [2,] 0.9207418
## [3,] 0.8753807
## [4,] 0.9159409
## [5,] 0.8810703
## [6,] 0.9435436
## [7,] 0.8724527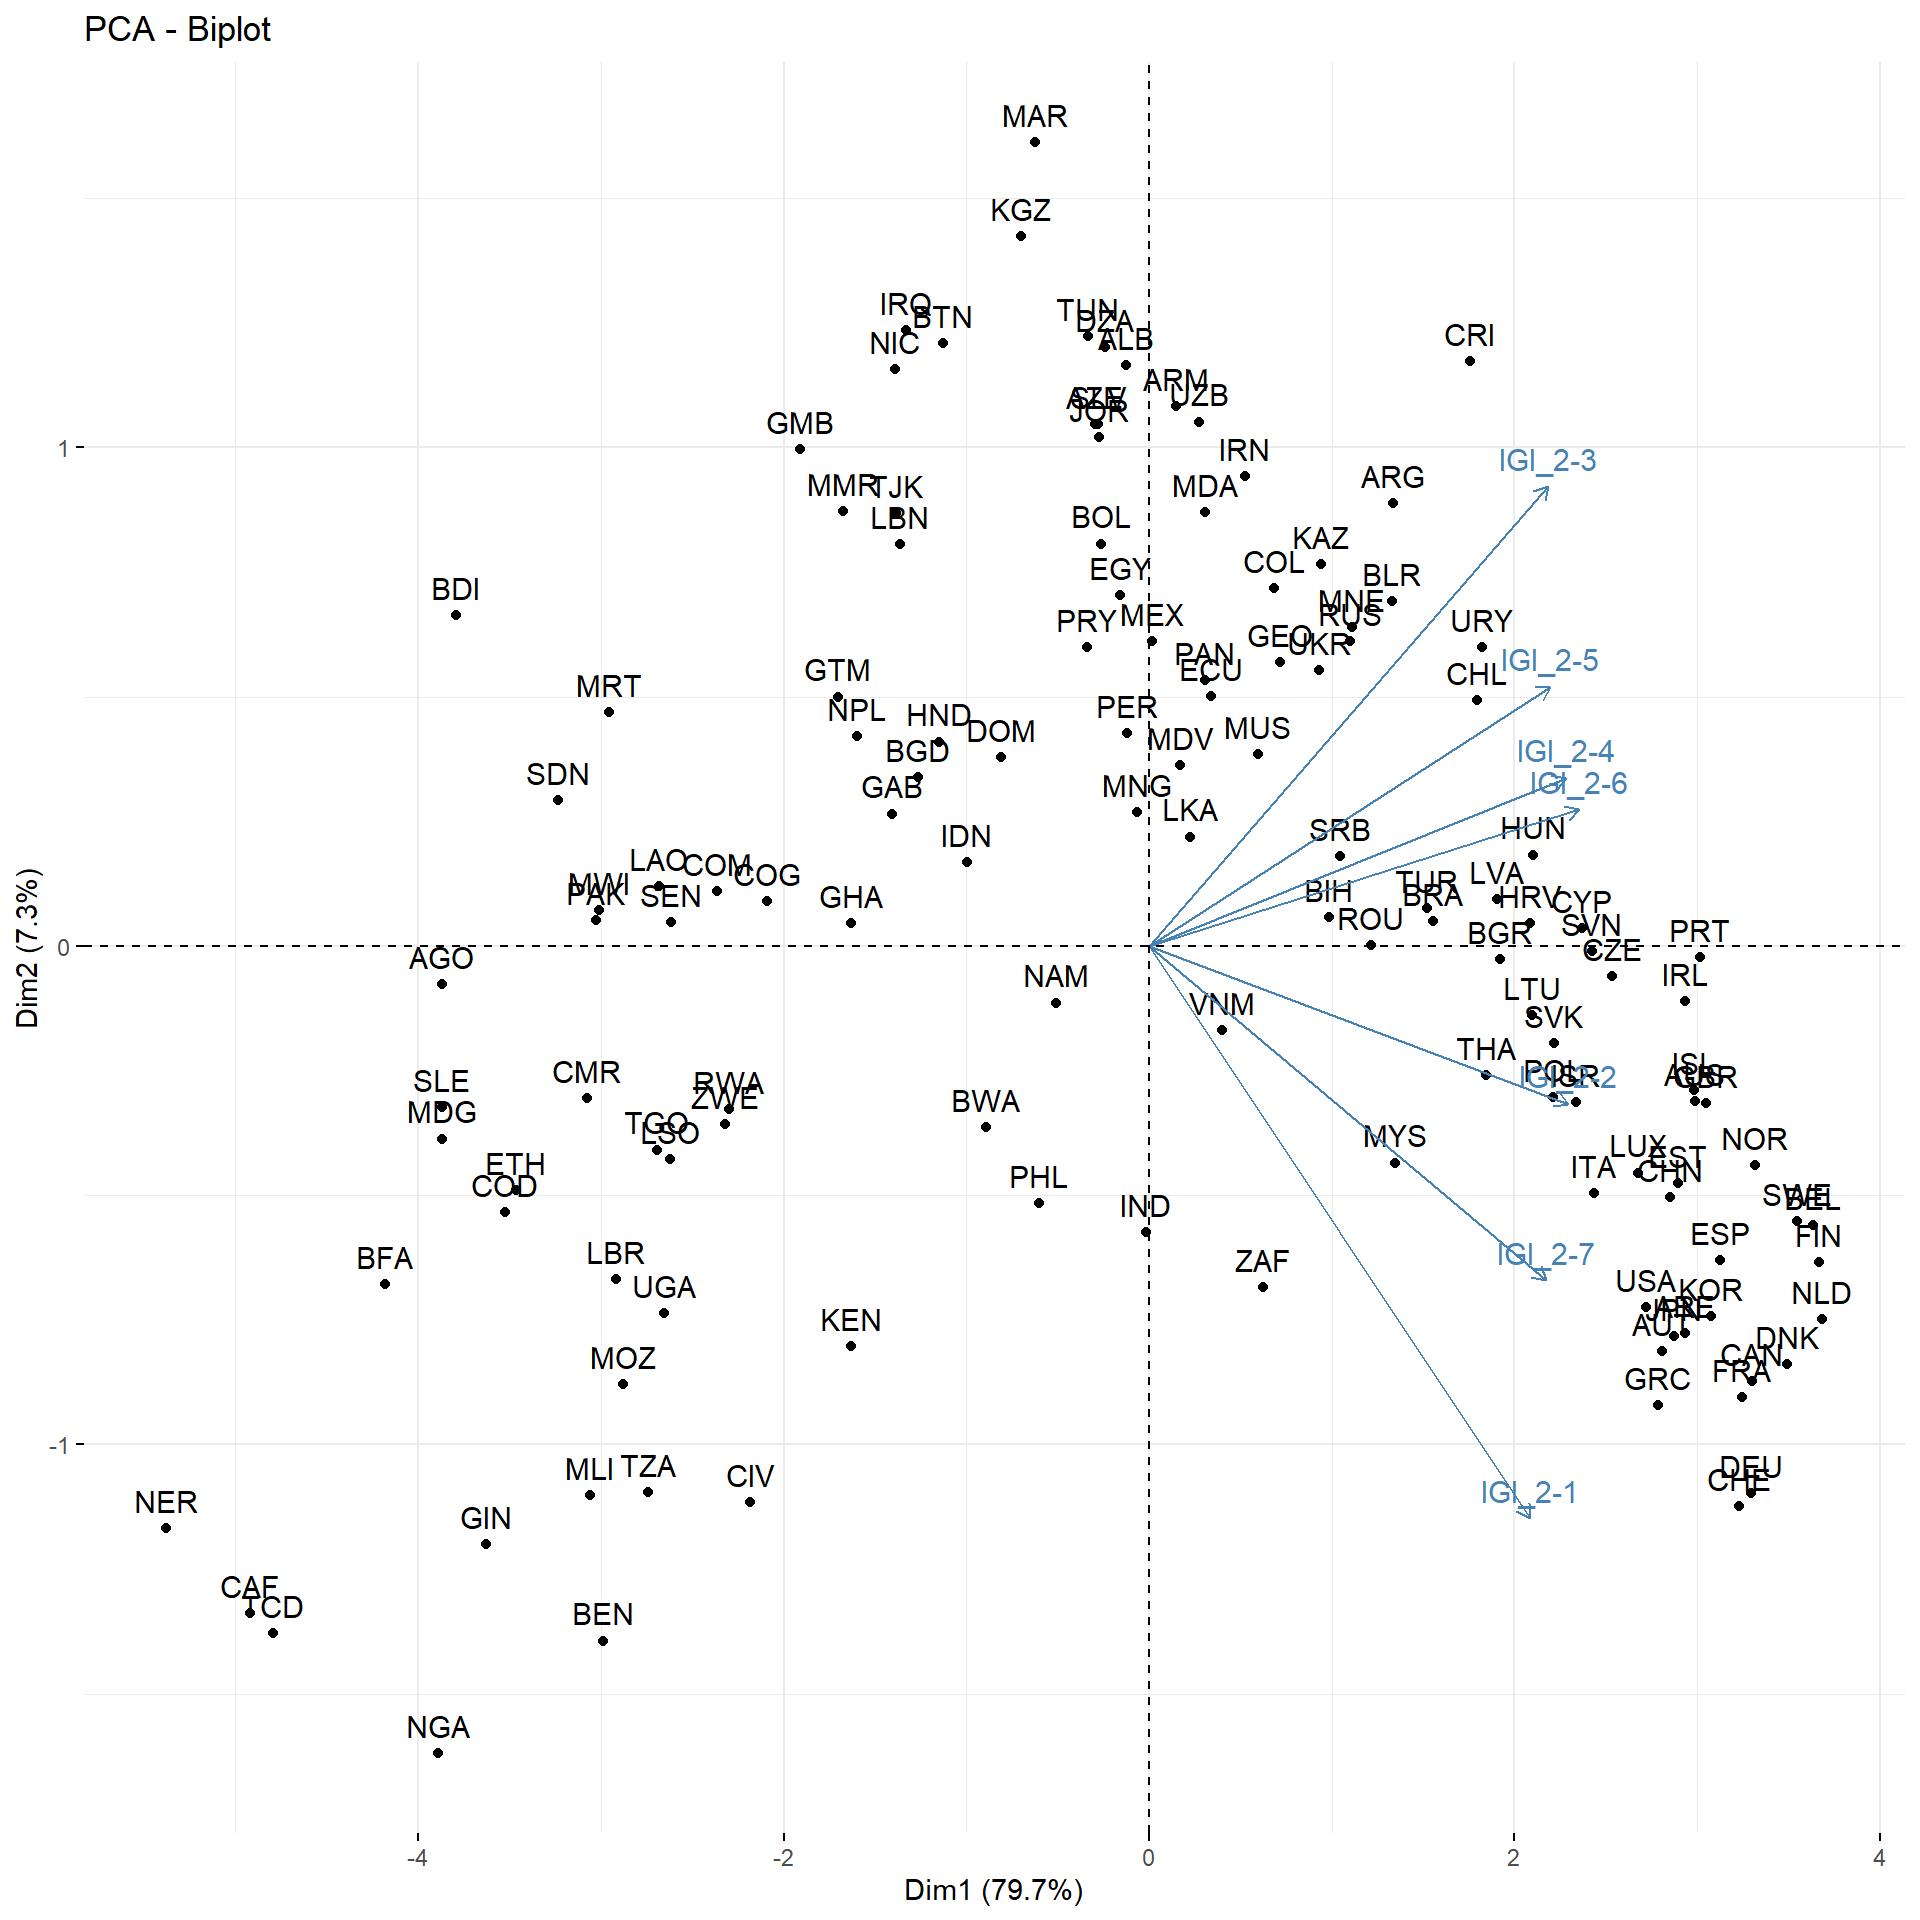
5.3 Pillar 3 - Equality
Pillar 3, Equality, includes 10 indicators. Three principal components were retained. Together, these three principal components explained 69.5 per cent of the total variance of the ten original variables selected to measure inequality.
The first component (Equal Labour Participation) accounts for 79.7 per cent of total variance. The second component (Income Equality) accounts for 7.3 per cent, whereas the third (School Enrolment) and fourth (Equal Political Participation) components account for 3.4 and 3.3, respectively.
## # A tibble: 10 × 2
##    Code     Indicator
##    <chr>    <chr>
##  1 IGI_3-1  "Gini index"
##  2 IGI_3-2  "Poverty headcount ratio at $3.65 a day (2017 PPP) (% of population)"
##  3 IGI_3-3  "Gross enrolment ratio, secondary, adjusted gender parity index (GPIA)"
##  4 IGI_3-4  "Ratio of female to male employment-to-population ratio (%) (modeled ILO estimate)"
##  5 IGI_3-5  "Ratio of youth to adult employment-to-population ratio (modeled ILO estimate)"
##  6 IGI_3-6  "Gender parity in the number of seats held by women and men in national parliaments"
##  7 IGI_3-7  "Ratio of female to male labour force participation rate (%) (modeled ILO estimate)"
##  8 IGI_3-8  "Ratio of female age of first marriage to male age of first marriage"
##  9 IGI_3-9  "Ratio of the share of wage and salaried workers in women\x92s to men\x92s employment"
## 10 IGI_3-10 "Employment in services, female (% of female employment) (modeled ILO estimate), raised …
## Importance of components:
## PC1 PC2 PC3 PC4 PC5 PC6 PC7 PC8 PC9 PC10
## Standard deviation 1.565 1.5465 1.0643 0.98966 0.97796 0.89209 0.79796 0.64999 0.48026 0.06568
## Proportion of Variance 0.245 0.2392 0.1133 0.09794 0.09564 0.07958 0.06367 0.04225 0.02307 0.00043
## Cumulative Proportion 0.245 0.4841 0.5974 0.69536 0.79100 0.87058 0.93425 0.97650 0.99957 1.00000## [1] 2.449645608 2.391647520 1.132832065 0.979434587 0.956407670 0.795831061 0.636744595 0.422490678
## [9] 0.230652277 0.004313939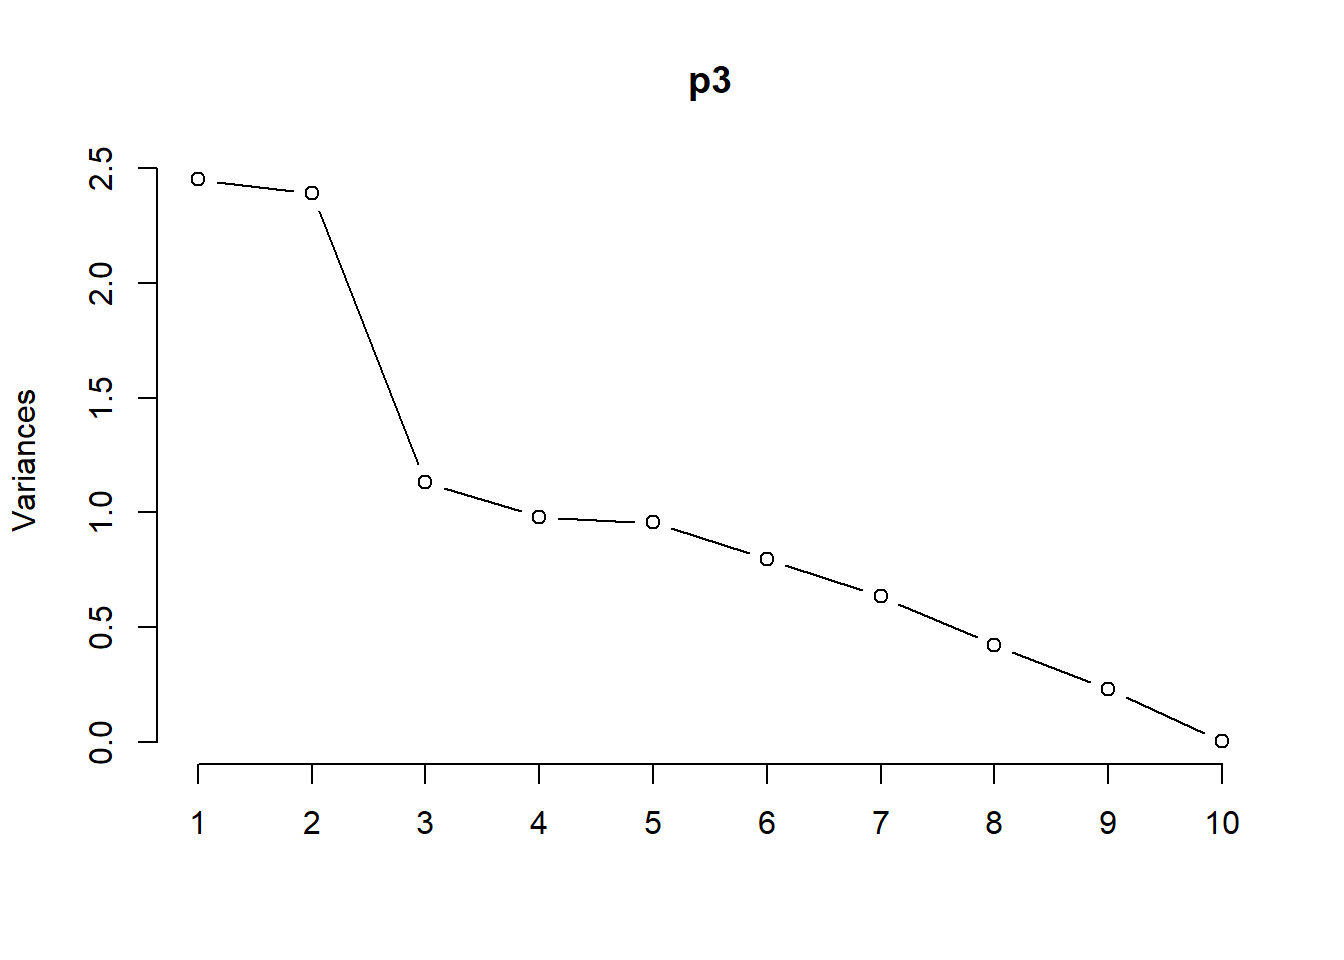
##
## Loadings:
##          [,1]   [,2]   [,3]   [,4]
## IGI_3-1   0.494        -0.502  0.343
## IGI_3-2   0.896 -0.141
## IGI_3-3   0.144         0.799  0.156
## IGI_3-4          0.961
## IGI_3-5   0.154  0.390        -0.250
## IGI_3-6   0.248  0.418  0.439 -0.128
## IGI_3-7  -0.103  0.955
## IGI_3-8   0.710  0.389
## IGI_3-9   0.839         0.219
## IGI_3-10                       0.923
##
##                 [,1]  [,2]  [,3]  [,4]
## SS loadings    2.380 2.355 1.139 1.079
## Proportion Var 0.238 0.236 0.114 0.108
## Cumulative Var 0.238 0.474 0.587 0.695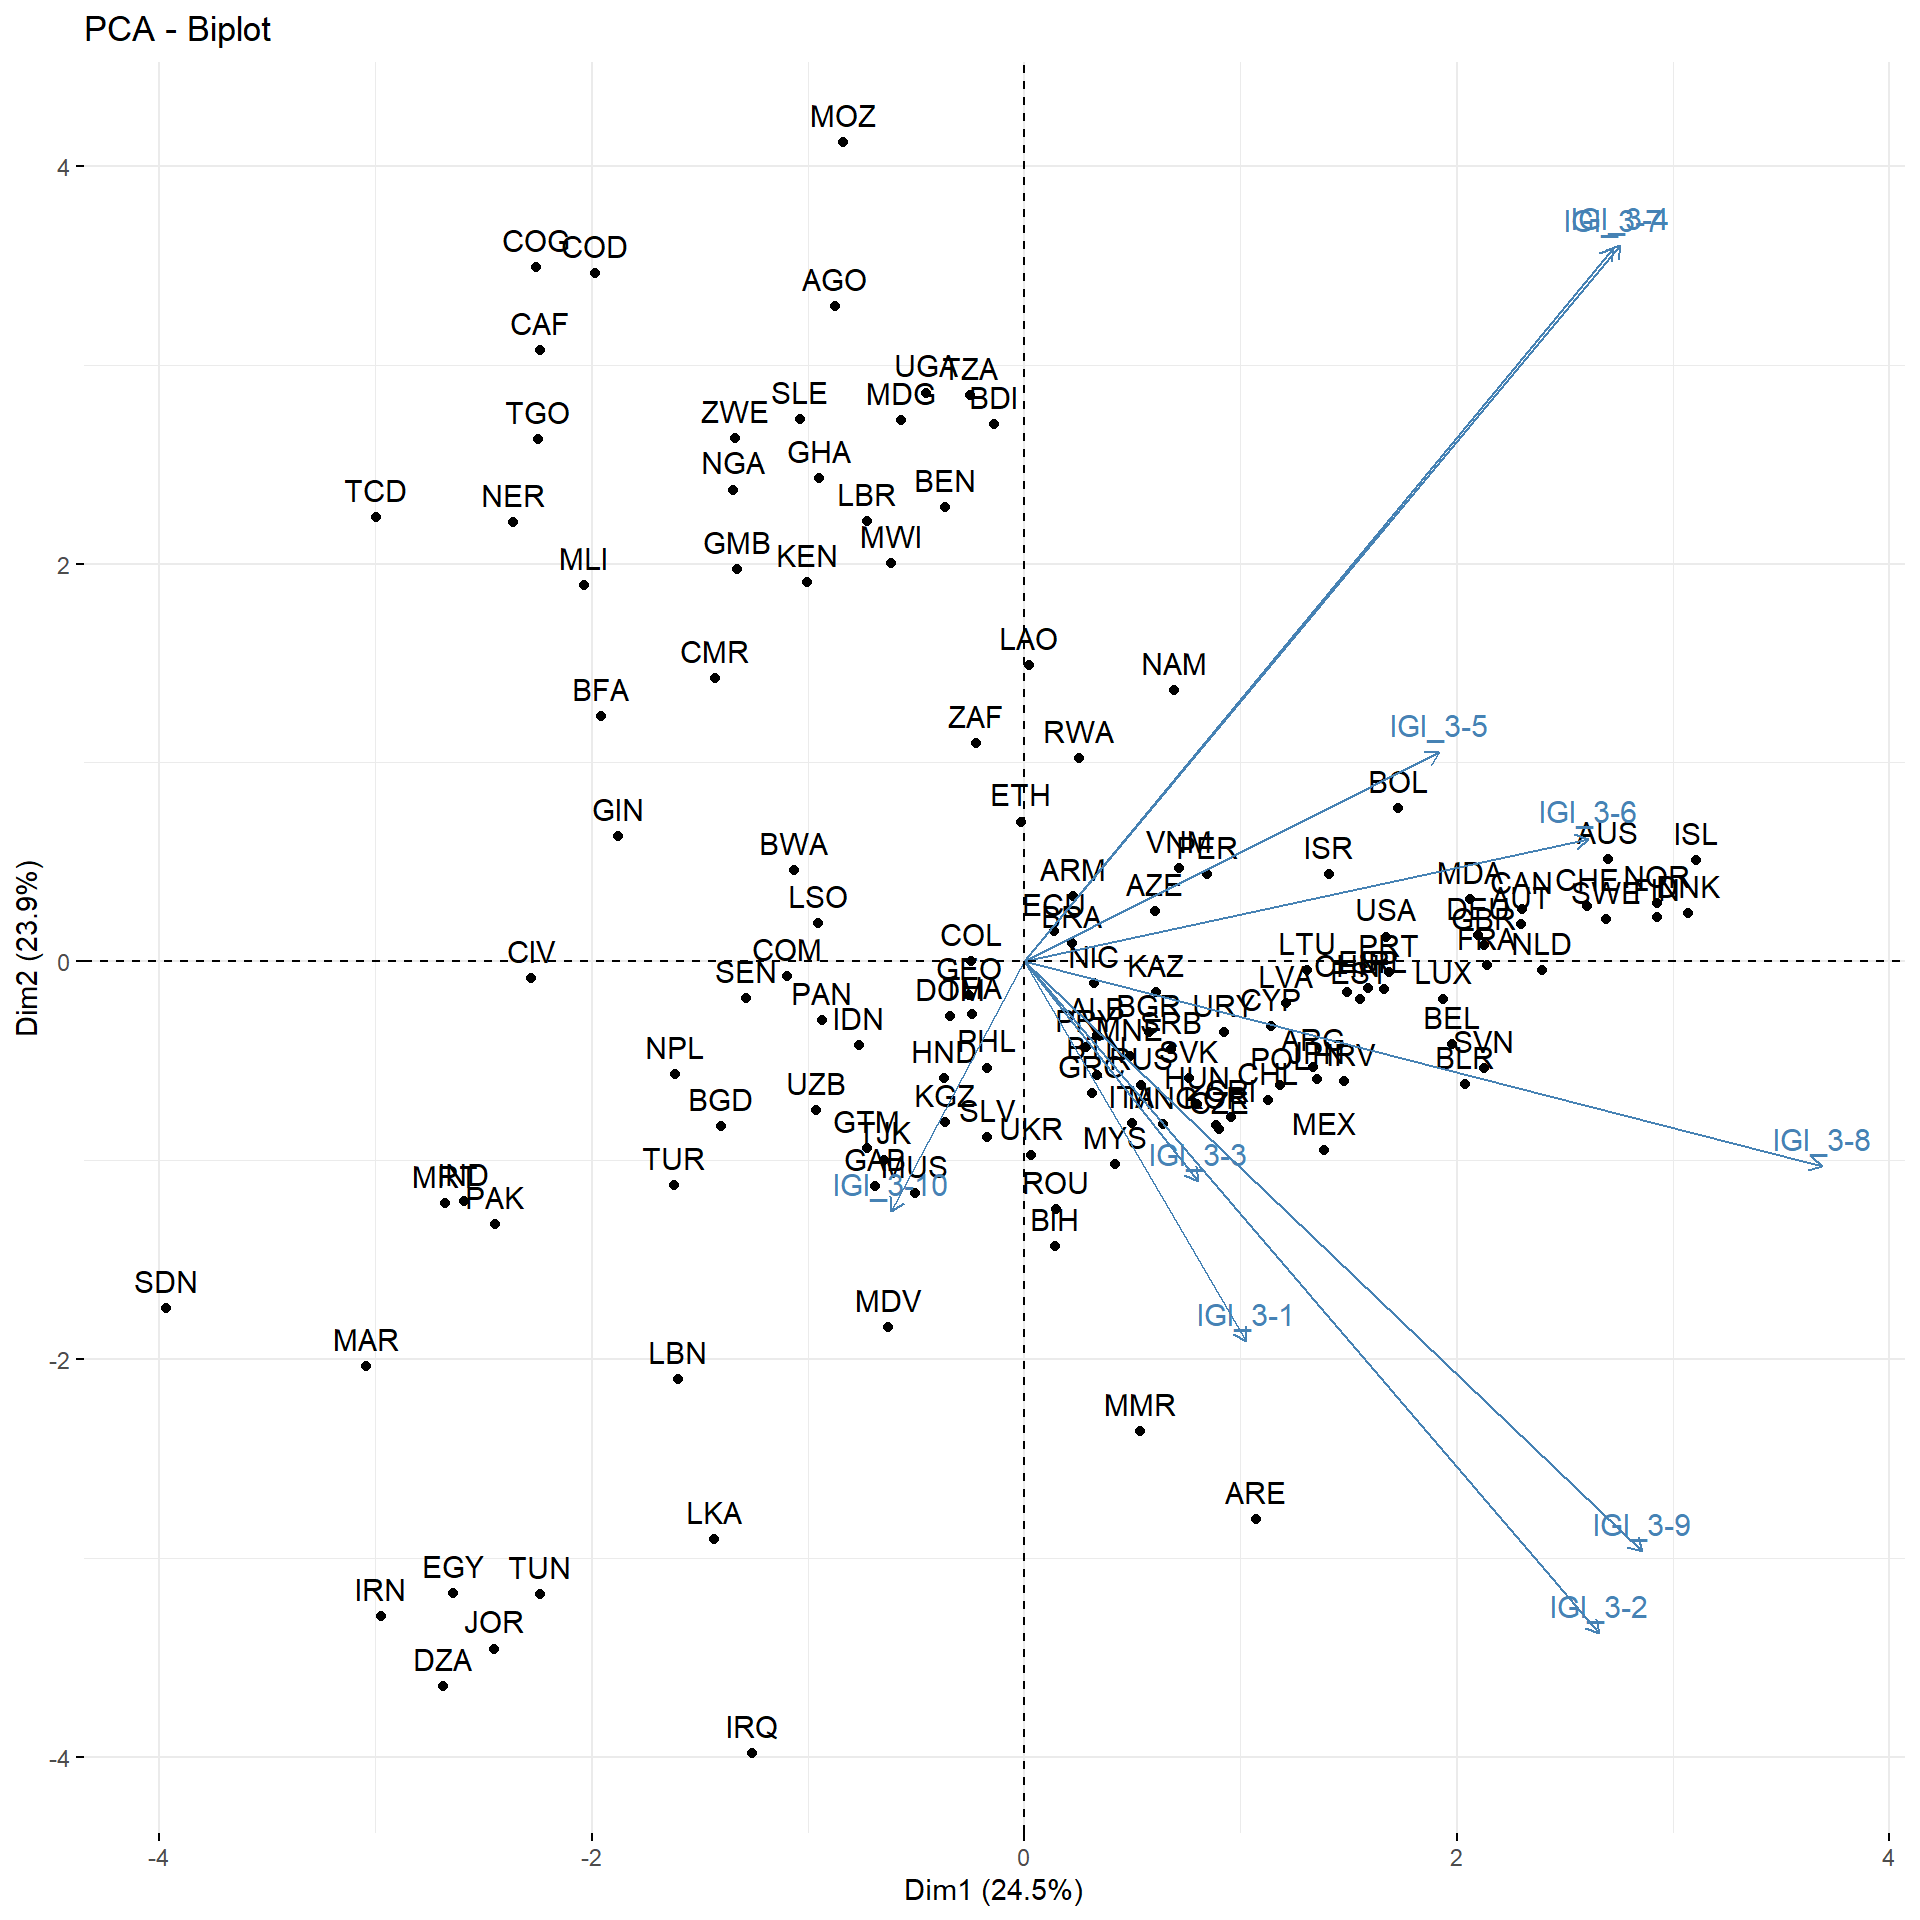
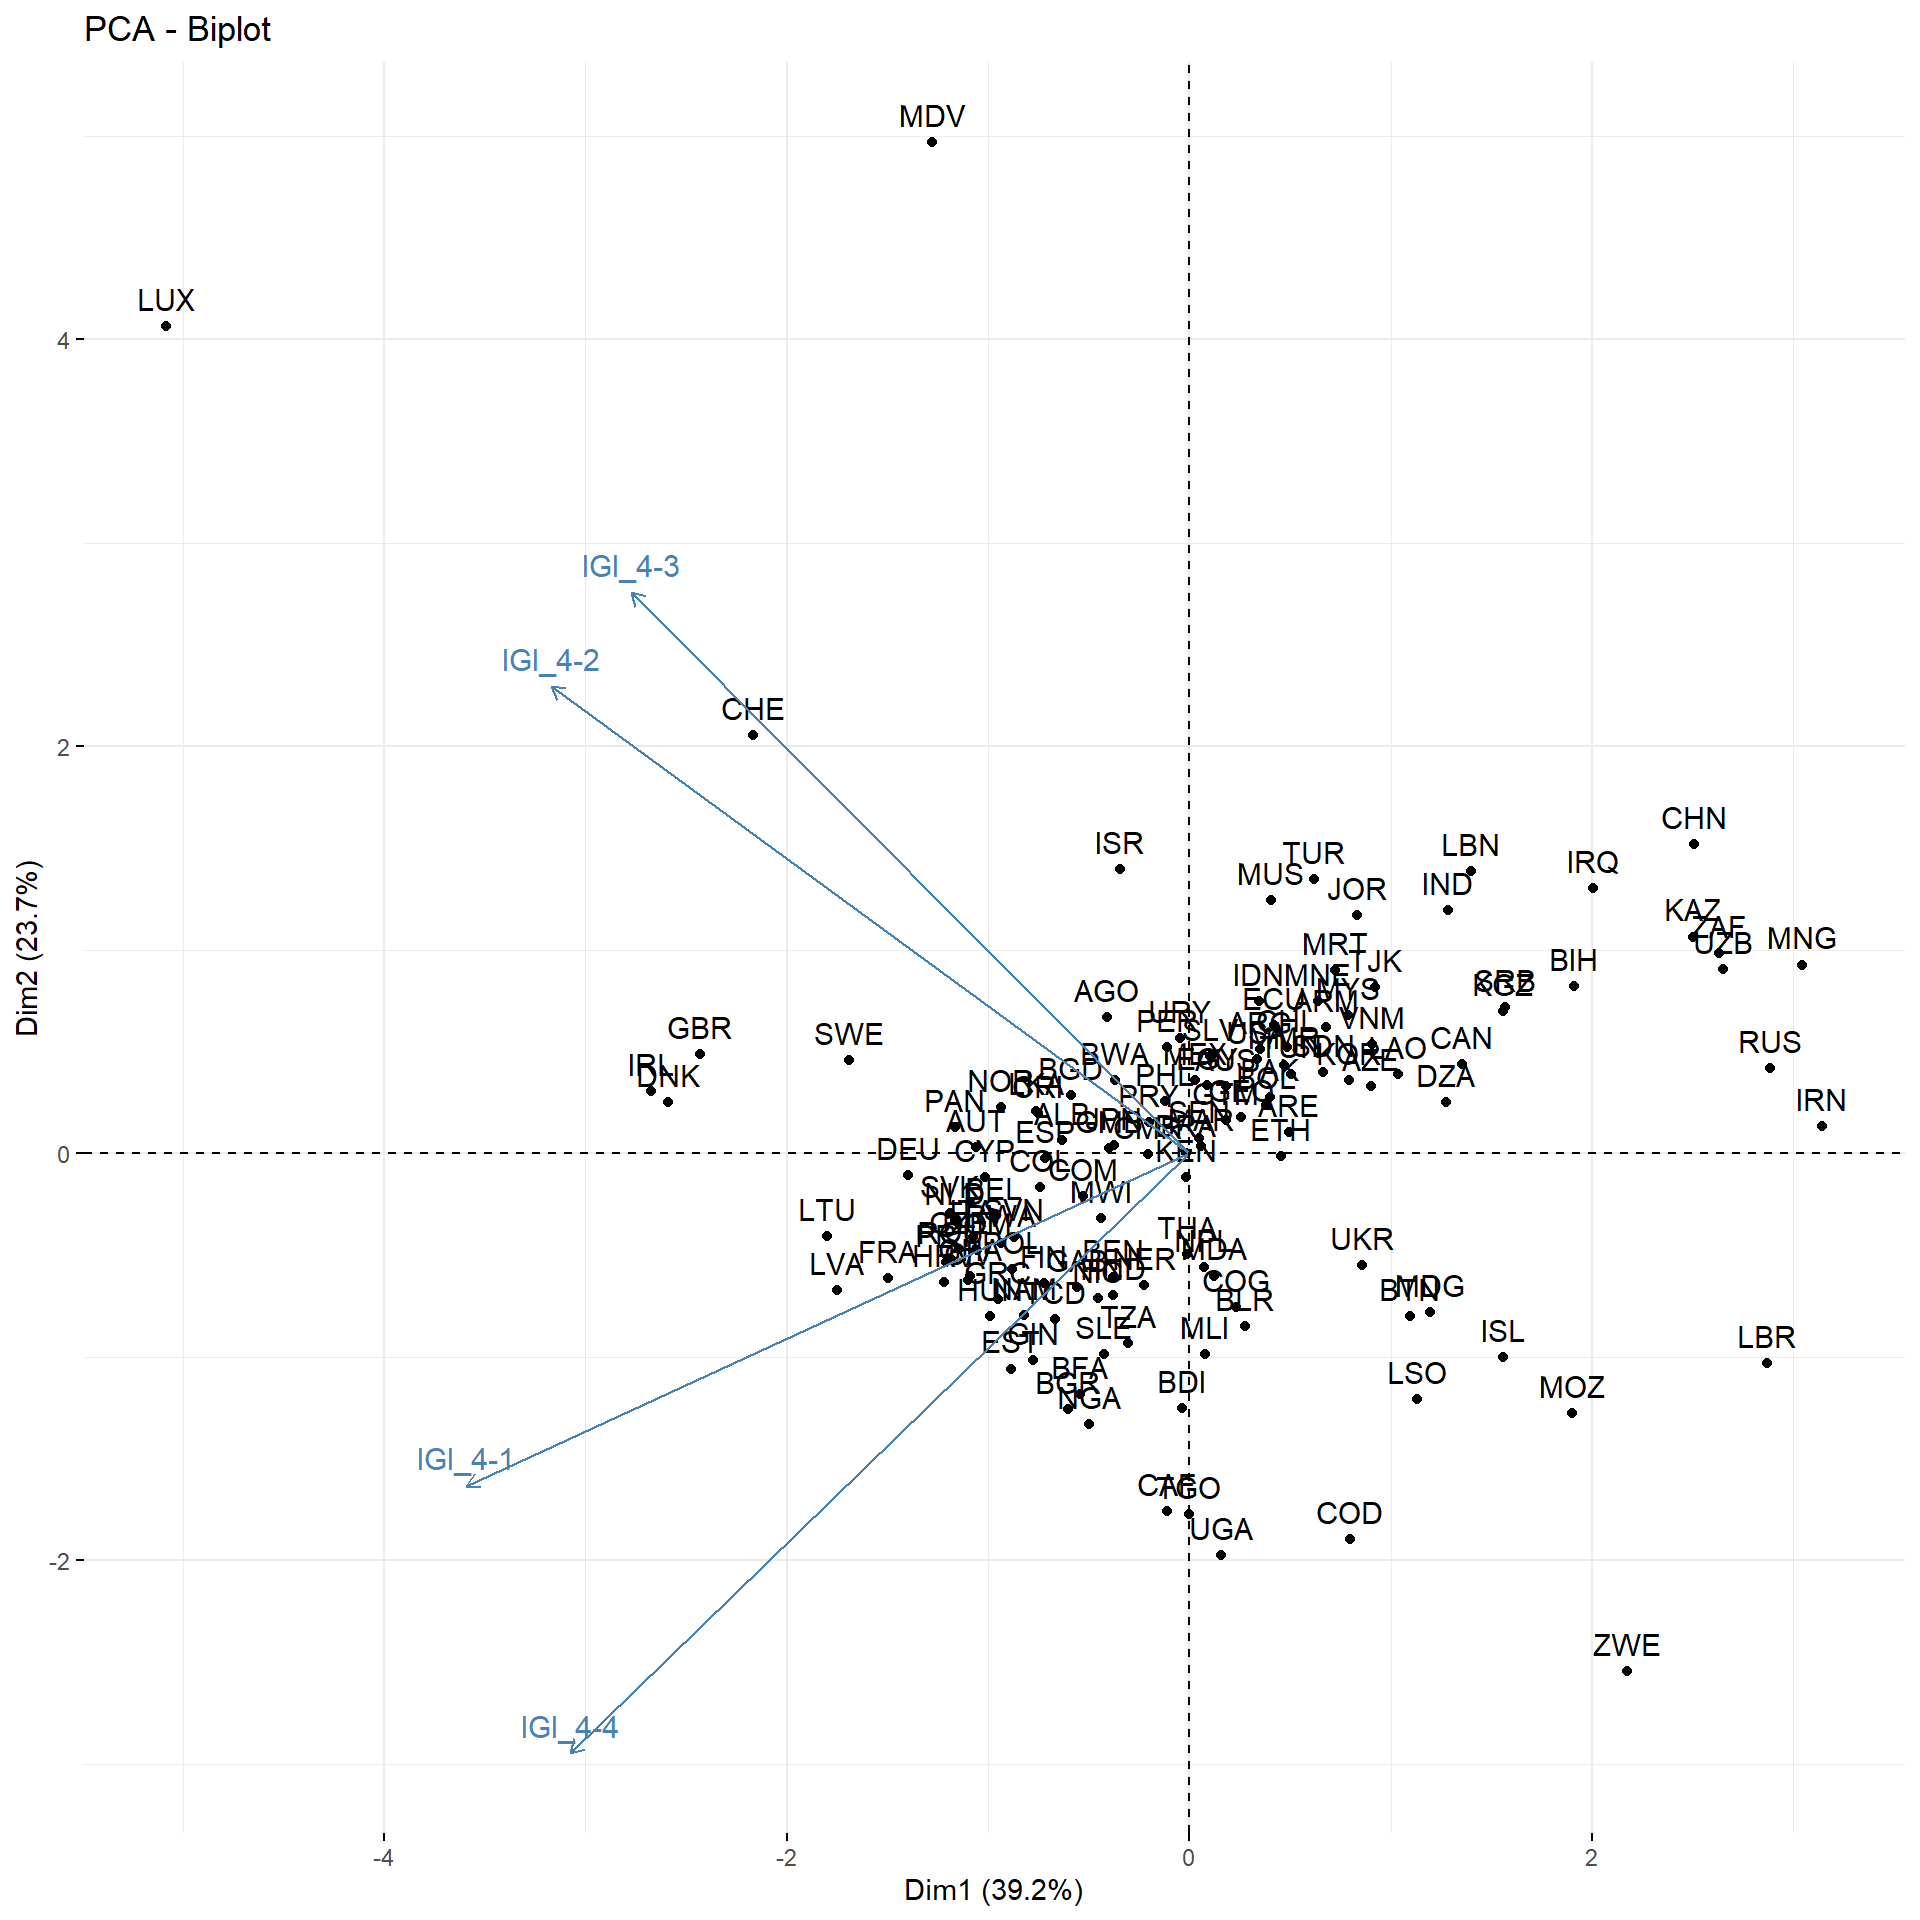
5.4 Pillar 4 - Environment
Pillar 4, Environment, includes 4 indicators. One principal component is retained. One principal component explained 39.2 per cent of the total variance of the four original variables selected to measure environmental sustainability.
## [1] "IGI_4-1" "IGI_4-2" "IGI_4-3" "IGI_4-4"## # A tibble: 4 × 2
## Code Indicator
## <chr> <chr>
## 1 IGI_4-1 Carbon dioxide emissions per unit of GDP PPP (kilogrammes of CO2 per constant 2017 United …
## 2 IGI_4-2 Energy intensity level of primary energy (megajoules per constant 2017 purchasing power pa…
## 3 IGI_4-3 Water Use Efficiency (United States dollars per cubic meter)
## 4 IGI_4-4 Terrestrial biodiversity area as % total protected areas## Importance of components:
## PC1 PC2 PC3 PC4
## Standard deviation 1.252 0.9732 0.9158 0.8039
## Proportion of Variance 0.392 0.2368 0.2097 0.1616
## Cumulative Proportion 0.392 0.6288 0.8384 1.0000## [1] 1.5679453 0.9470584 0.8386838 0.6463124
##            [,1]
## [1,] -0.7101838
## [2,] -0.6270685
## [3,] -0.5482176
## [4,] -0.6081339