Chapter 3 Literature
Name: YoonMinyeong
Problem1
library(ggplot2)
ggplot(mpg,aes(x=hwy,fill=drv))+geom_histogram(alpha=0.5)+theme_minimal()+labs(title="Histogram",subtitle="Histogram of Highway Mile Per Gallon",caption="Source:mpg")
## `stat_bin()` using `bins = 30`. Pick better value with `binwidth`.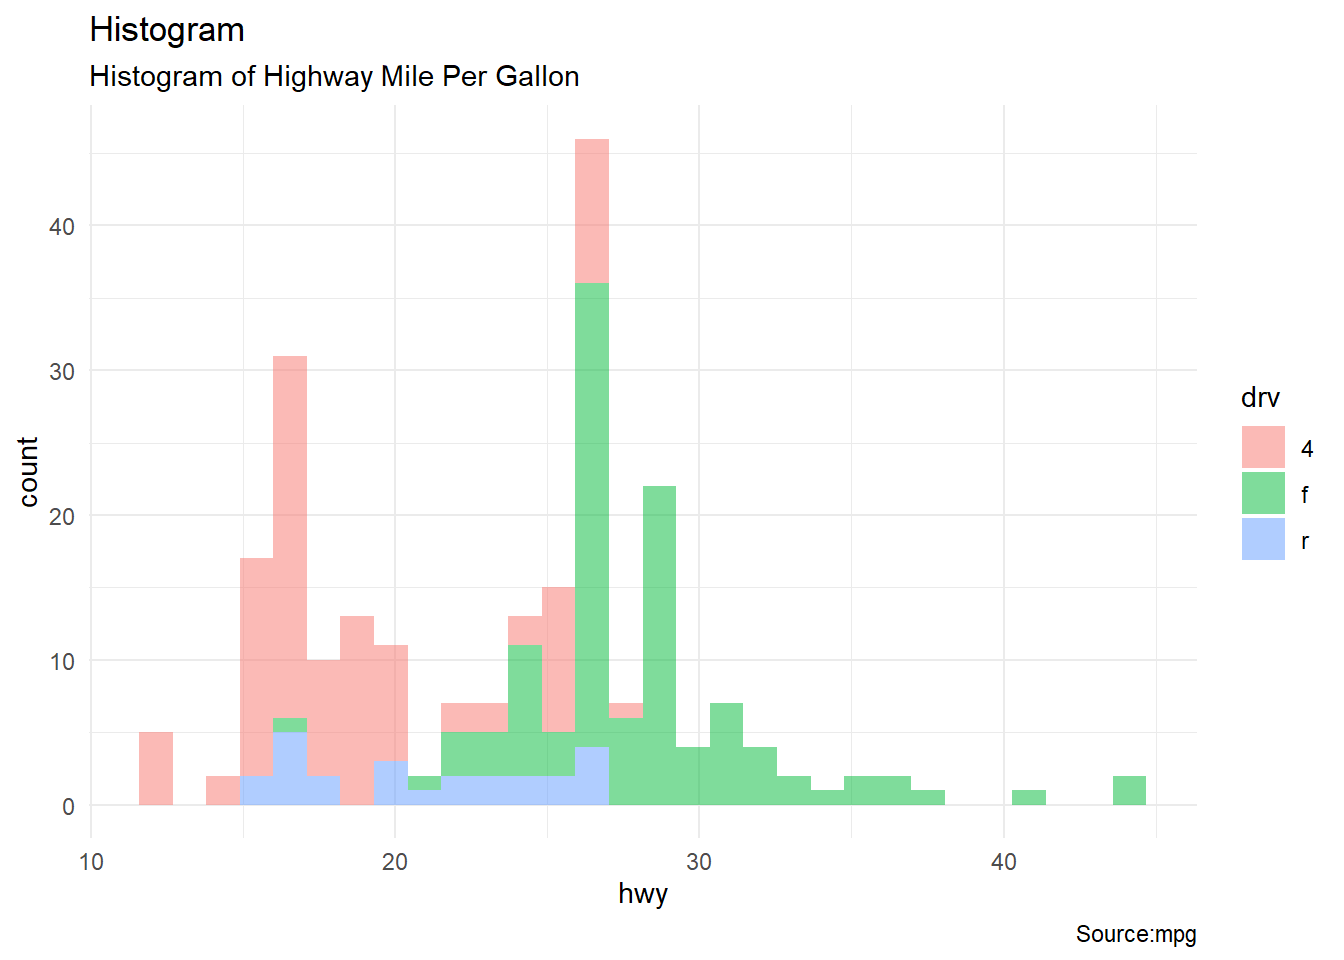 Problem2
ggplot(mpg,aes(x=hwy,fill=drv))+geom_histogram(alpha=0.5)+facet_grid(drv~.)+theme_minimal()+labs(title="Histogram using facet_grid()",subtitle="Histogram of Highway Mile Per Gallon",caption="Source:mpg")## `stat_bin()` using `bins = 30`. Pick better value with `binwidth`.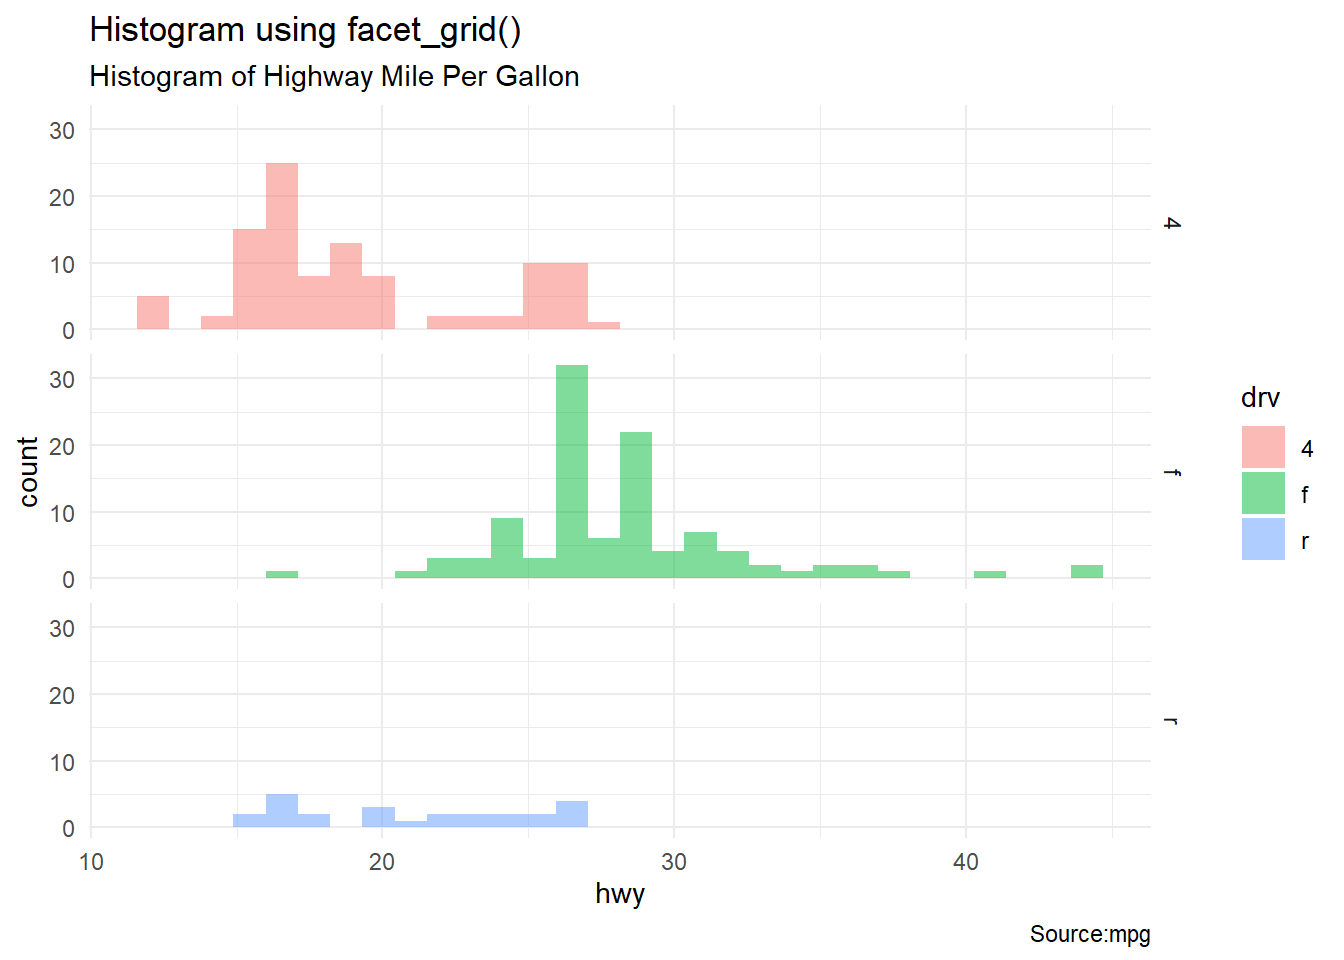 Problem3
options(scipen=999)
ggplot(midwest,aes(area,poptotal))+geom_point(aes(color=state,size=popdensity),alpha=0.4)+geom_smooth(se=F)+xlim(0,0.1)+ylim(0,500000)+labs(title="Scatterplot",subtitle="Area Vs Population",caption="Source:midwest",x="Area",y="Population")+theme_classic()
## `geom_smooth()` using method = 'loess' and formula 'y ~ x'## Warning: Removed 15 rows containing non-finite values (stat_smooth).## Warning: Removed 15 rows containing missing values (geom_point).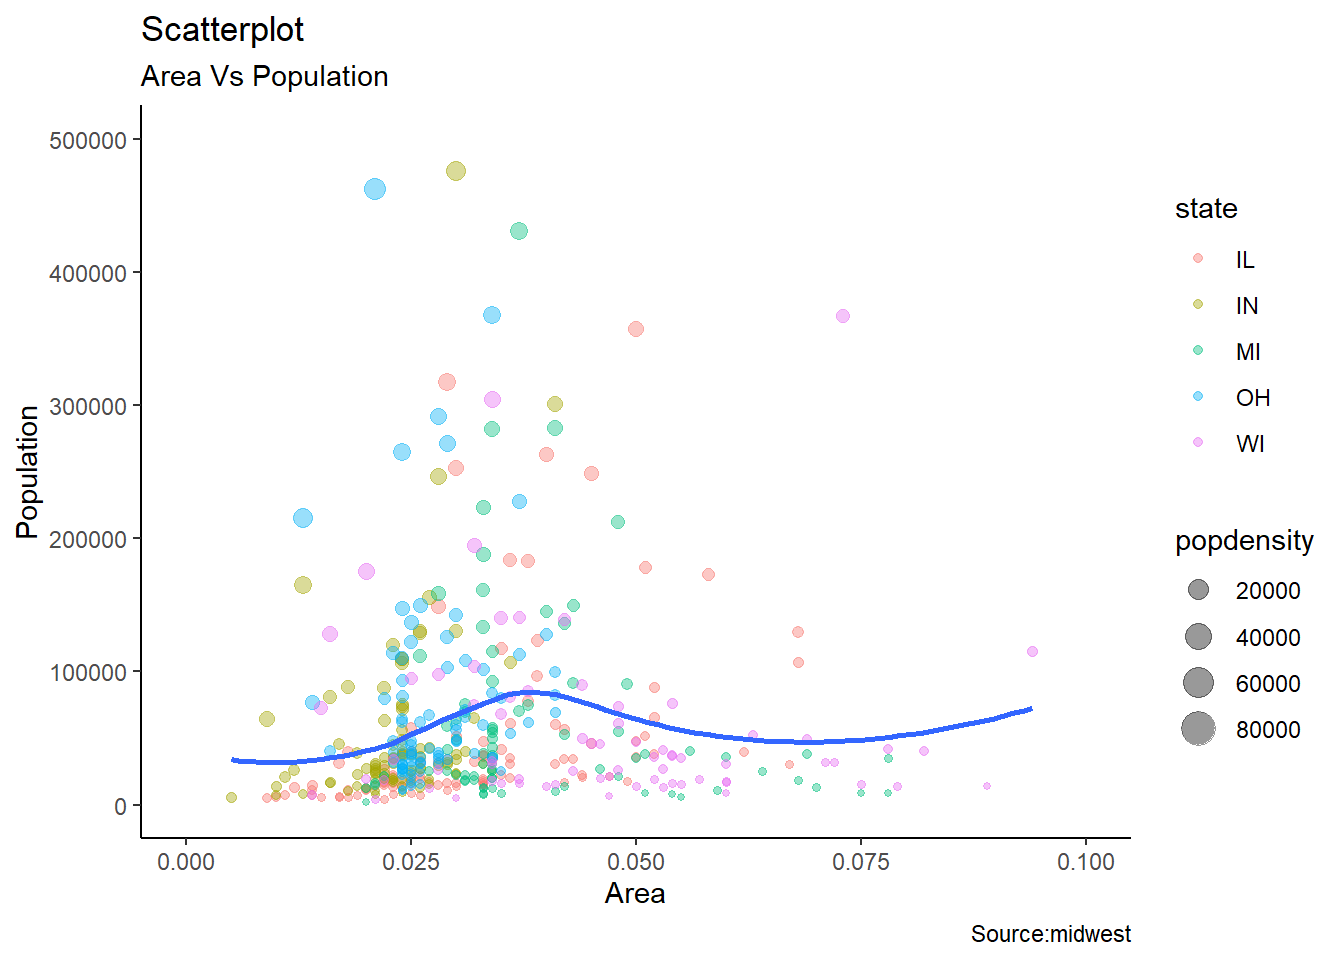 Problem4
ggplot(iris,aes(Sepal.Length,Sepal.Width,color=Species,shape=Species))+geom_point(size=6,alpha=0.5)+theme_minimal()+labs(title="Scatterplot",subtitle="Sepal.Length Vs Sepal.Width",caption="Source:iris")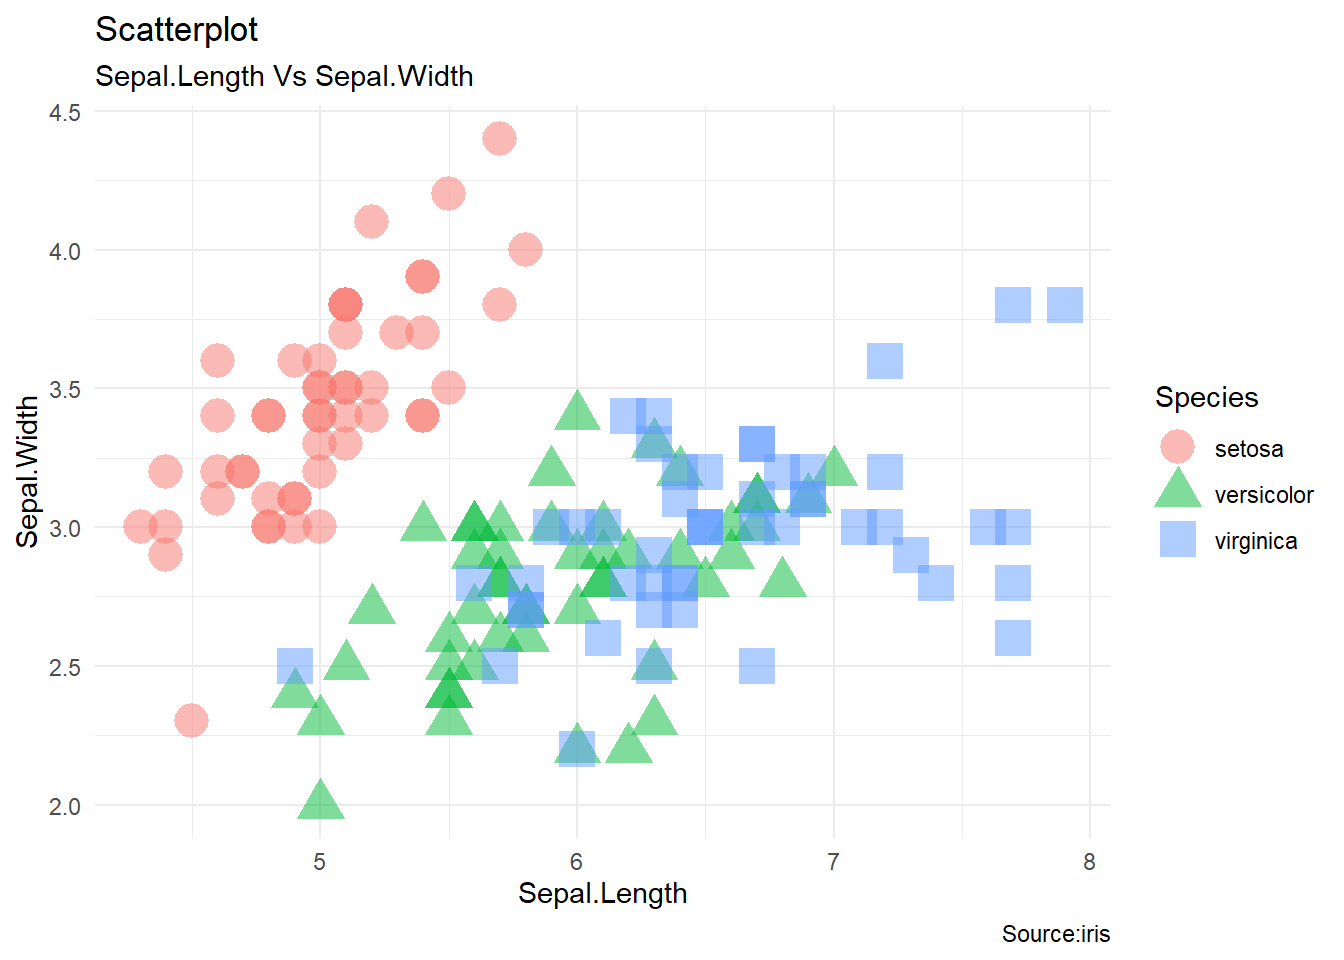 Problem5
library(gcookbook)
ggplot(heightweight,aes(heightIn,weightLb,color=sex))+geom_point(size=3,alpha=0.5)+geom_smooth(se=F,method="lm")+theme_classic()+labs(title="Scatterplot",subtitle="Weight Vs Height",caption="Source:heightweight")
## `geom_smooth()` using formula 'y ~ x'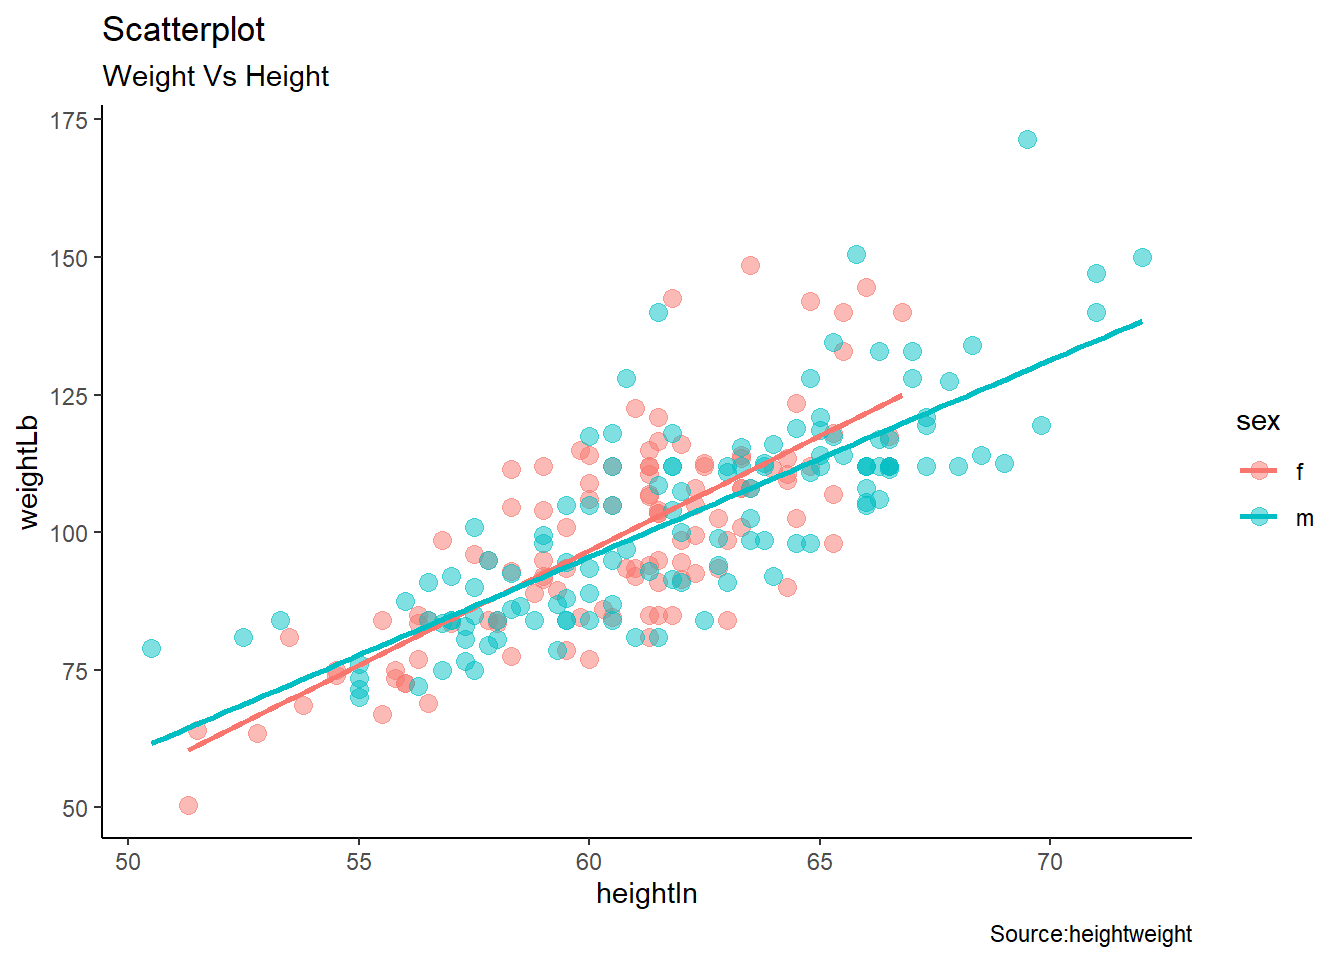 Problem6
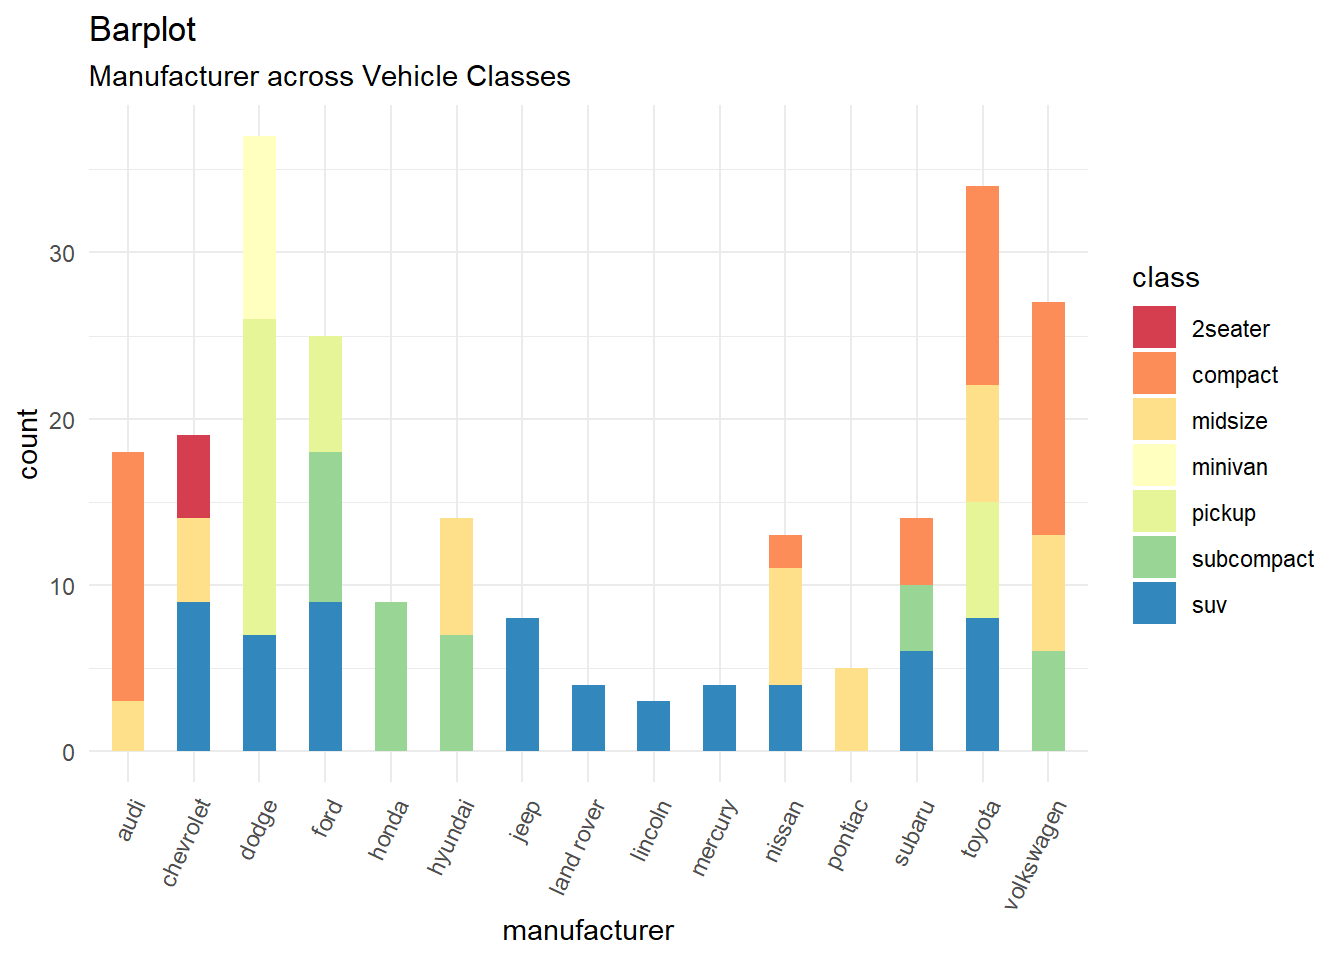
ggplot(mpg,aes(x=manufacturer,fill=class))+theme_minimal()+geom_bar(width = 0.5)+theme(axis.text.x=element_text(angle=65,hjust=1))+scale_fill_brewer(palette="Spectral")+labs(title="Barplot",subtitle="Manufacturer across Vehicle Classes")