Study 2.3: Lexical decision
Convergence
In the initial model, the optimiser used (the default one in ‘lmerTest’) was ‘nloptwrap’, and the convergence warning read: ‘boundary (singular) fit: see ?isSingular’.
Based on the reanalysis using seven optimisers, Figure 36 shows the fixed, main effects, and Figure 37 shows the fixed interactions.
Code
# Display plot, which was produced in advance due to memory overload. Code available at:
# lexicaldecision/frequentist_analysis/model_diagnostics/lexicaldecision_allFit_convergence.R

include_graphics(
  paste0(
    getwd(),  # Circumvent illegal characters in file path
    '/lexicaldecision/frequentist_analysis/model_diagnostics/plots/main_effects_lexicaldecision_allFit_convergence.pdf'
  ))
Figure 36: Fixed, main effects from the lexical decision study fitted by seven optimisers.
Code
# Display plot, which was produced in advance due to memory overload. Code available at:
# lexicaldecision/frequentist_analysis/model_diagnostics/lexicaldecision_allFit_convergence.R

include_graphics(
  paste0(
    getwd(),  # Circumvent illegal characters in file path
    '/lexicaldecision/frequentist_analysis/model_diagnostics/plots/interactions_lexicaldecision_allFit_convergence.pdf'
  ))
Figure 37: Fixed interaction effects from the lexical decision study fitted by seven optimisers.
Residual errors not normally distributed
Figure 38 shows the deviation from normality of the residuals.
Code
# Display plot, which was produced in advance due to memory overload. Code available at:
# lexicaldecision/frequentist_analysis/model_diagnostics/lexicaldecision_residuals.R

include_graphics(
  paste0(
    getwd(),  # Circumvent illegal characters in file path
    '/lexicaldecision/frequentist_analysis/model_diagnostics/plots/lexicaldecision_residuals.png'
  ))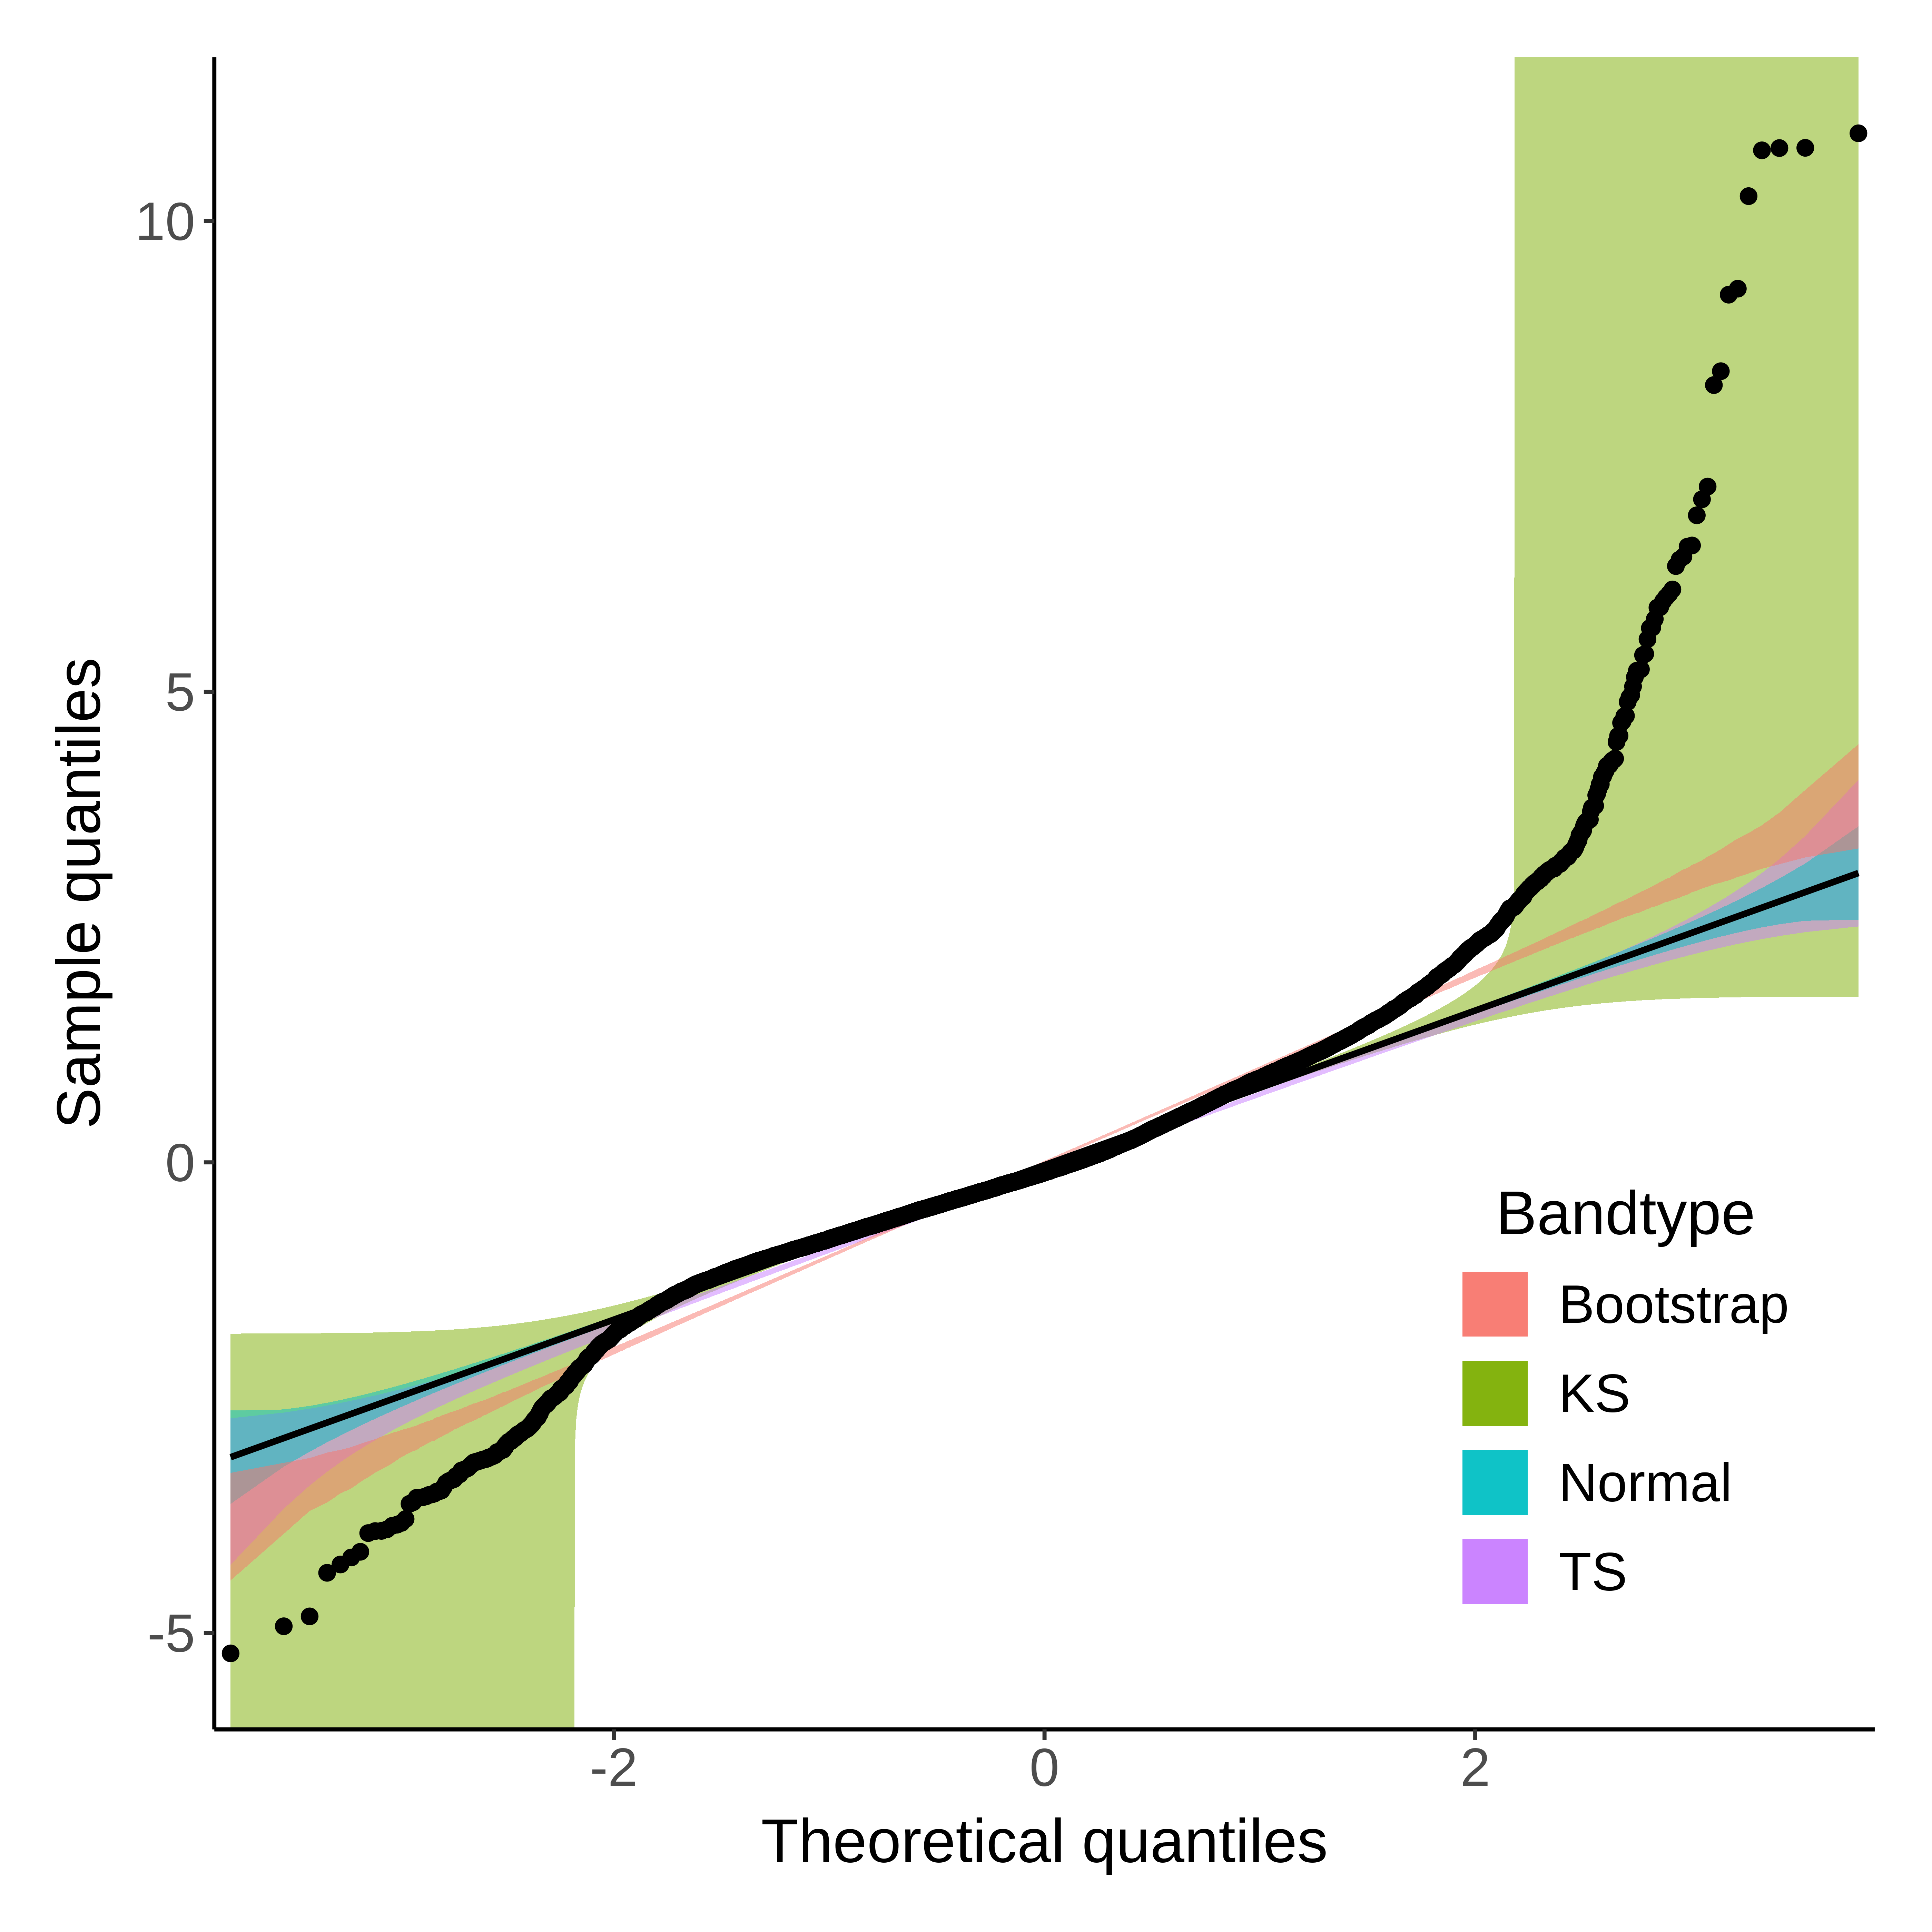
Figure 38: Residuals of the linear mixed-effects model from the lexical decision study. The outliers in the residuals deviate from the coloured areas indicating an acceptable normality. KS = Kolmogorov-Smirnov test; TS = tail-sensitive confidence bands.
Thesis: https://doi.org/10.17635/lancaster/thesis/1795.
Online book created using the R package bookdown.