Chapter 1 CASE STUDY #1
Analysis of McDonald & Starbucks locations in NY ZIP codes
1.1 Data and Package
First, you need to install few packages.
Needed <- c("ggmap", "ggplot2", "zipcode", "gridExtra", "caTools", "ROCR",
            "rpart", "rpart.plot", "glmnet", "useful")
install.packages(Needed, dependencies=TRUE)
Then load the packages into environment
library(ggmap)
library(ggplot2)
library(zipcode)
library(gridExtra)
library(caTools)
library(ROCR)
library(rpart)
library(rpart.plot)
library(glmnet)
library(useful)
library(rattle)
## Warning: Failed to load RGtk2 dynamic library, attempting to install it.Then, load the data to analyze into environment. (Later we will provide a link to download the data either from a package or vishalsingh.org)
load("ny.RData")To ensure the data is properly loaded.
head(ny)## ZIP primary_city state1 county1 logpop female collegeplus
## 1 6390 Fishers Island NY Suffolk County 5.634790 54.64 43.72
## 2 10001 New York NY New York County 9.956886 52.25 66.42
## 3 10002 New York NY New York County 11.306332 52.22 28.10
## 4 10003 New York NY New York County 10.918537 52.68 75.80
## 5 10004 New York NY New York County 7.864804 40.55 78.39
## 6 10005 New York NY New York County 8.504108 51.19 85.88
## black white asian under18 over65 single divorced samesex lessHS poverty
## 1 0.00 100.00 0.00 16.79 8.57 26.29 2.39 0.00 0.00 6.98
## 2 10.46 63.85 16.77 11.03 11.93 62.48 10.50 2.86 8.61 13.37
## 3 6.95 30.48 46.02 15.78 17.36 40.70 9.86 0.66 37.79 28.41
## 4 3.57 76.85 14.08 6.71 10.68 63.75 8.13 2.29 4.49 4.73
## 5 6.11 71.89 15.67 11.87 3.00 53.82 6.82 3.37 1.61 6.88
## 6 1.03 75.36 20.55 6.06 0.43 63.37 3.66 3.28 2.08 1.28
## foreign logincome HouseValue N_Starbucks N_McDonald Has_Starbucks
## 1 6.79 11.92669 650000 0 0 0
## 2 23.73 11.12424 632400 13 8 1
## 3 44.18 10.38613 572000 1 2 1
## 4 19.65 11.39190 802300 8 4 1
## 5 27.50 11.75546 886800 4 1 1
## 6 27.78 11.67746 1000001 5 0 1
## Has_McDonald Has_any Validation log.HouseValue
## 1 0 Neither Training 13.38473
## 2 1 Both McD and Starbucks Training 13.35728
## 3 1 Both McD and Starbucks Training 13.25689
## 4 1 Both McD and Starbucks Training 13.59524
## 5 1 Both McD and Starbucks Training 13.69537
## 6 0 Starbucks Training 13.815511.2 Clean up geo information
To visualize the data, we need clean geo identification. Here we will use zipcode package.
ny$zip = clean.zipcodes(ny$ZIP)
data(zipcode)
ny=merge(ny,zipcode,by.x="zip",by.y="zip")
Let’s examine data points on map and see the zipcodes we have in our dataset
ggmap(get_map("New York, New York",zoom=12,color = "bw")) +
geom_point(data=ny, aes(x=longitude,y=latitude), color='red') 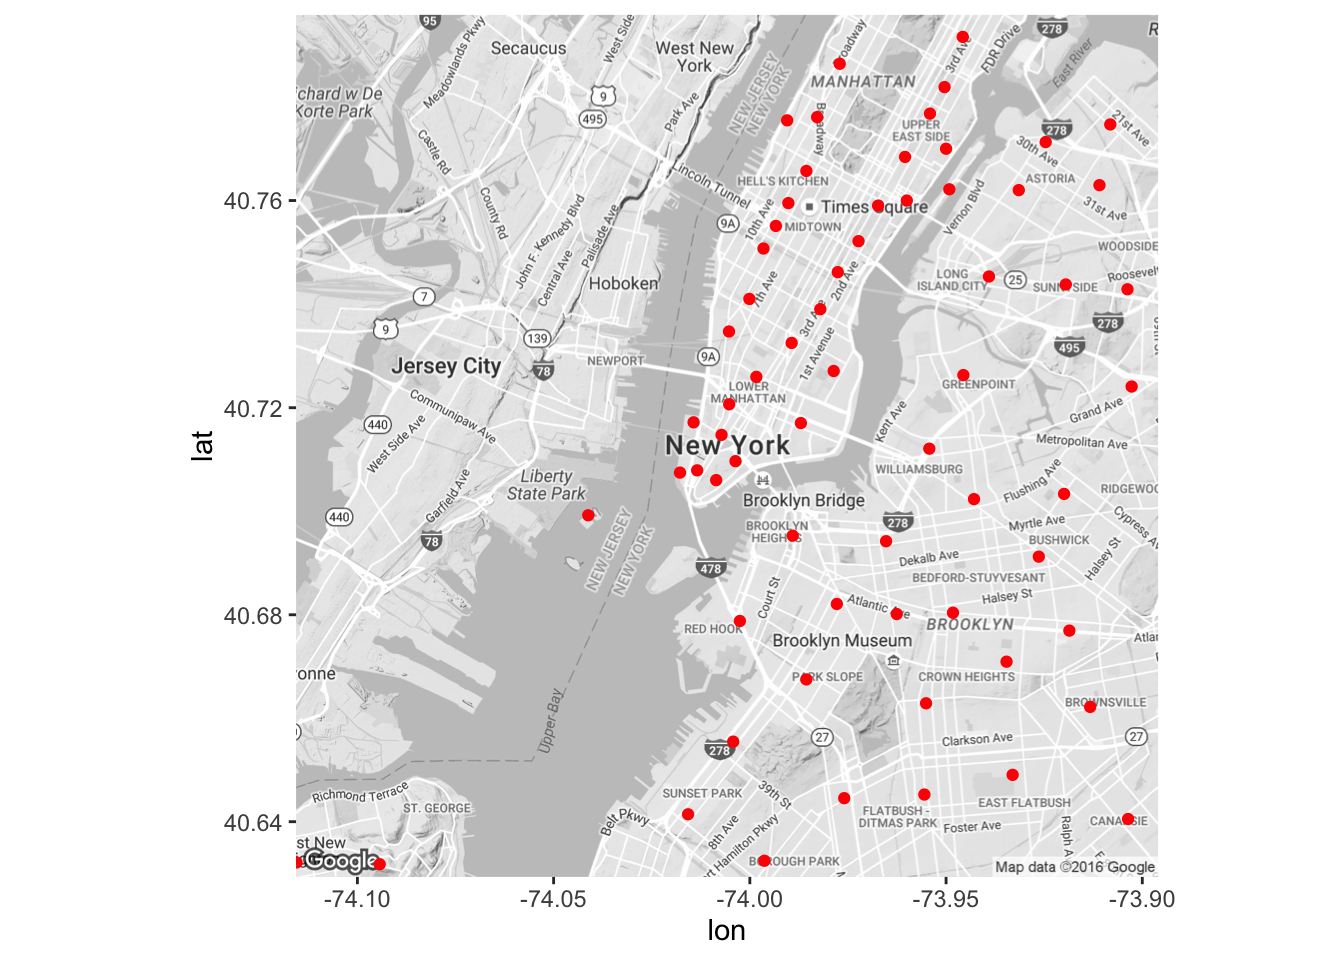
Now let’s check the locations of Mcdonald and Starbuck stores
ggmap(get_map("New York, New York",zoom=12,color = "bw"))+
  geom_point(data=ny, aes(x=longitude,y=latitude,group=city,colour=factor(Has_any)), size=4) +
  labs(colour="Store Location")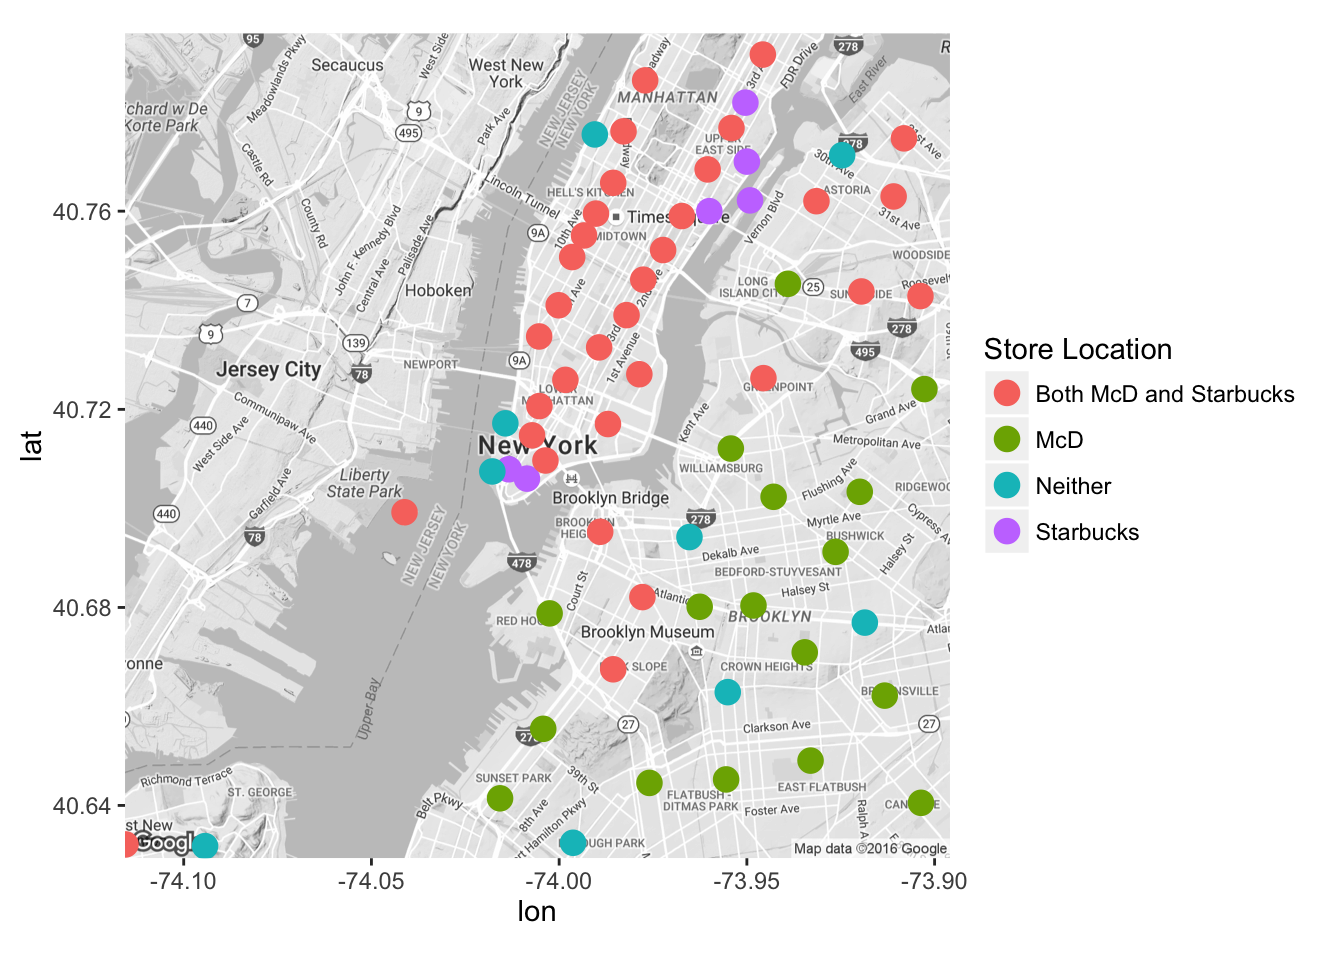
1.3 Decision Tree Model
The validation column in data defines rows to use to train and test model. We now run a simple decision model.
Train <- ny[ny$Validation=="Training",]
Test <-ny[ny$Validation=="Validation",]
If the validation column does not exist in the data, you will need to create it. Here is a typical way to create validation column.
#set.seed(3000)
#spl = sample.split(ny$logHouseValue, SplitRatio=0.7)
#Train = subset(ny, spl==TRUE)
#Test = subset(ny, spl==FALSE)
Let’s run a CART model.
tree1<- rpart(Has_McDonald ~logpop+logincome+log.HouseValue+black+over65+lessHS+female +single+poverty,
      data=Train, method="class")

prp(tree1)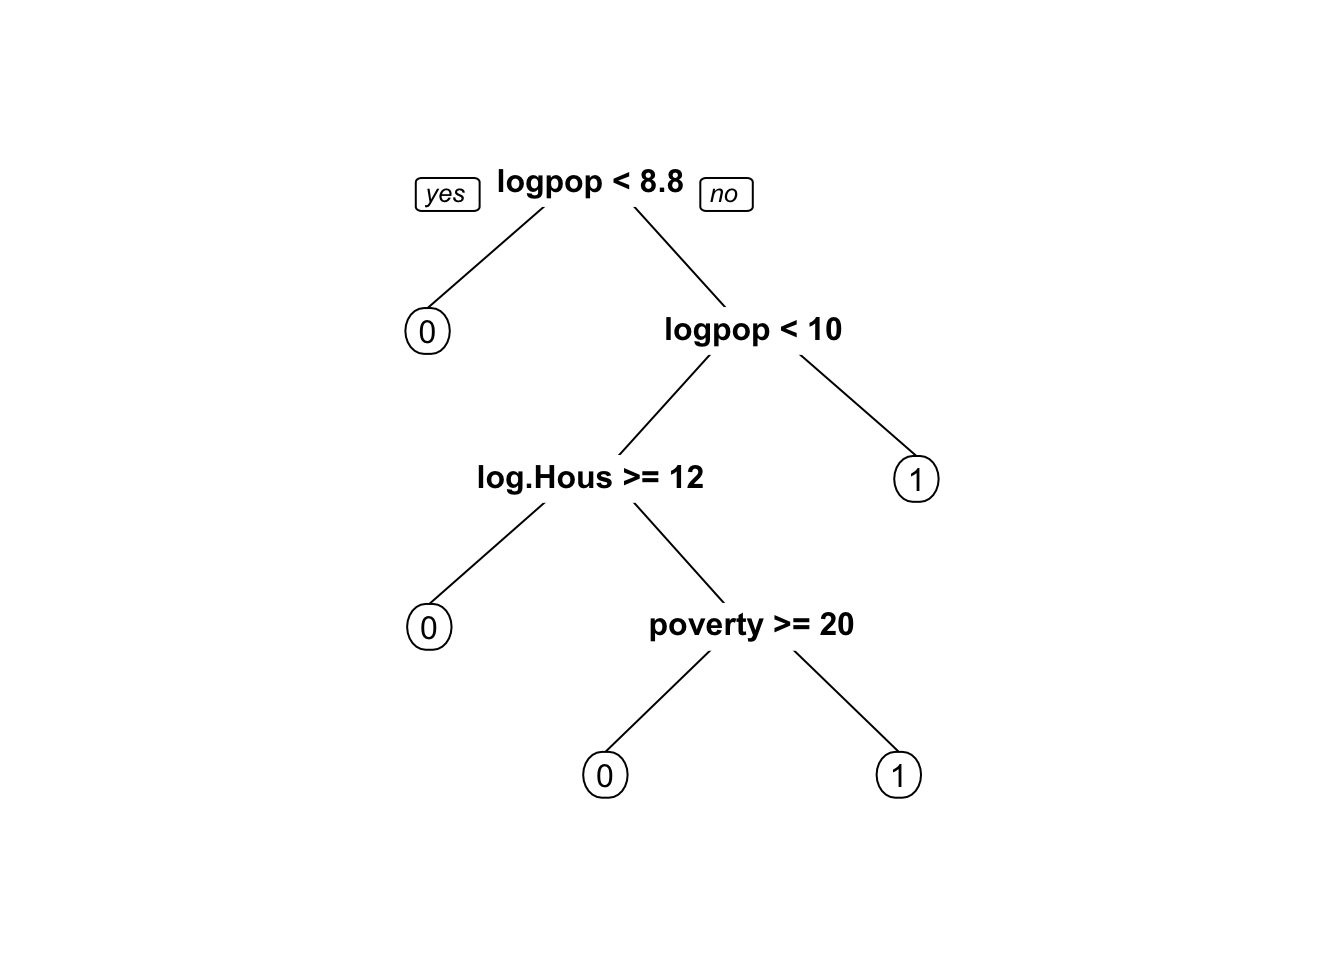
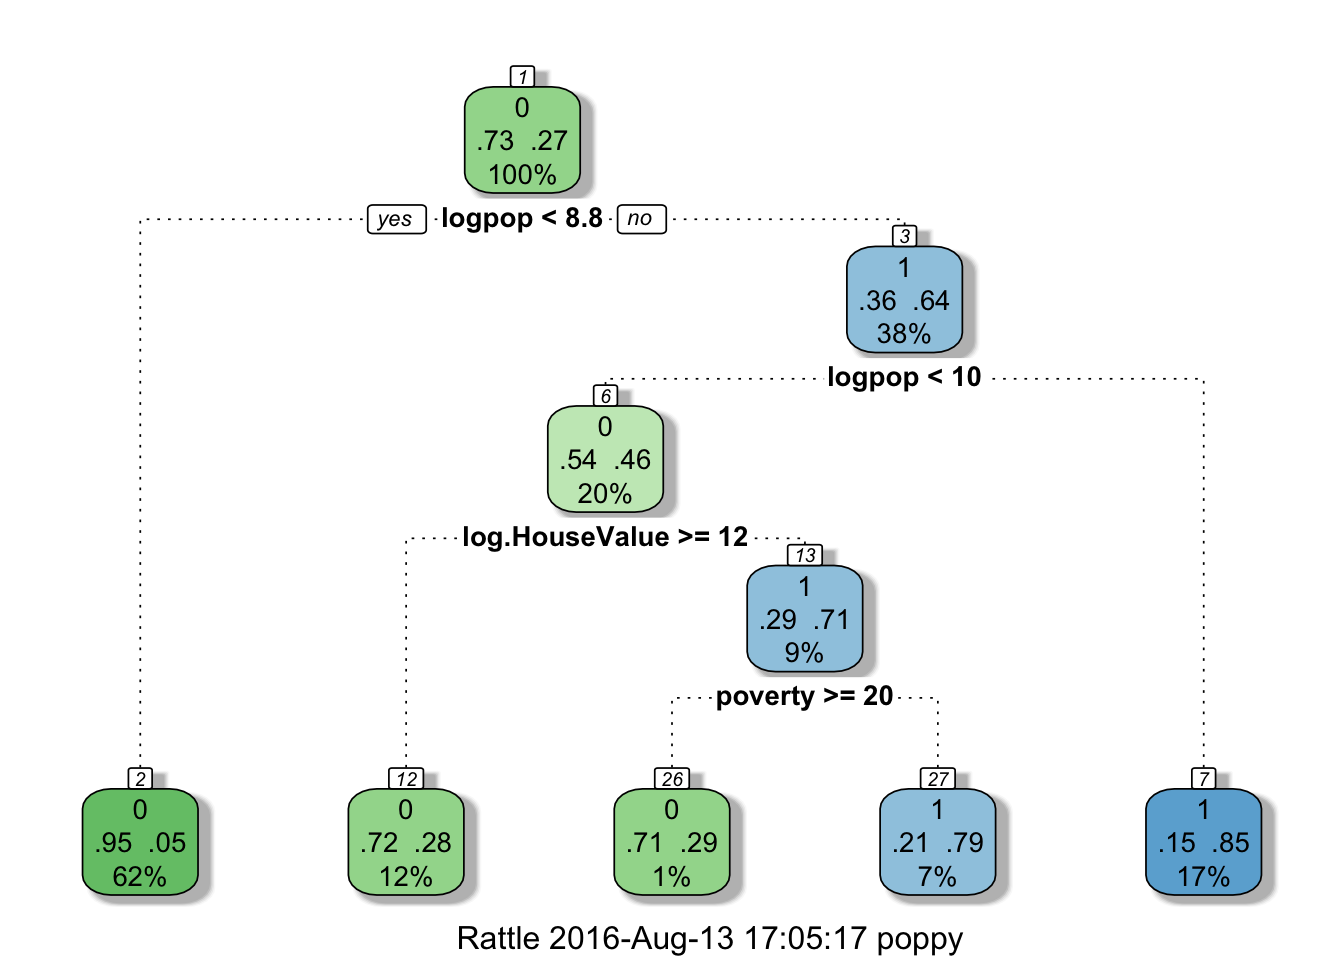
We can optimize our tree using fancyRpartPlot(). This function is from rattle package.
fancyRpartPlot(tree1)