2 Materials and Methods
2.1 Study Area
Our aim is to predict the dengue outbreak in each of its several districts shown in Figure 2.1.
![The map of Bangkok with enumerated 50 districts (Image Source: [@wikiBKK])](images/bangkok_district.png)
Figure 2.1: The map of Bangkok with enumerated 50 districts (Image Source: (Wikipedia 2016))
## Warning: package 'tseries' was built under R version 3.3.2Now, let’s look at some of the descriptive statistics of dengue in Bangkok from year 2008 to 2015. We have the data available for each month throughout the year, however in a few cases data from some of the districts is missing. I will report about the missing data when it is required for our analysis. We have the data about following variables.
- Monthly Dengue Incidence (MD) (for each district)
- Dengue Fever (DF) data.
- Dengue Haemorrhagic Fever (DHF) and
- Dengue Shock Syndrome (DSS)
- Meteorological Variables (uniform for all districts in Bangkok)
- Monthly Average Rainfall (MR)
- Monthly Diurnal Temperature Range (DTR)
- Socio-Economic Data (for each district)
- Population Demographics in different age groups (2014)
- Number of communities (schools, hospitals, meetup centers etc.) in 2011.
- Yearly Garbage Collection (2012 to 2014).
- Location Specific Data (for each district)
- Attached to the river stream.
- Distance from the river stream.
2.2 Meteorological Data
2.2.1 Temperature
The temperatur data is collected as Diurnal Temperature Range abbreviated as DTR. DTR is the difference between the daily maximum and minimum temperature. It is shown in Table 2.1.
| Month | 2015 | 2014 | 2013 | 2012 | 2011 | 2010 | 2009 | 2008 |
|---|---|---|---|---|---|---|---|---|
| Jan | 9.6 | 11.2 | 10.3 | 9.2 | 9.9 | 8.6 | 10.6 | 9.0 |
| Feb | 9.0 | 8.6 | 9.0 | 8.3 | 8.8 | 7.2 | 9.7 | 7.8 |
| Mar | 8.0 | 8.1 | 9.1 | 8.3 | 7.4 | 8.9 | 8.9 | 8.0 |
| Apr | 8.7 | 8.7 | 9.2 | 8.5 | 8.1 | 8.4 | 9.5 | 8.1 |
| May | 8.3 | 9.3 | 8.9 | 8.8 | 7.6 | 8.5 | 8.1 | 7.0 |
| Jun | 8.6 | 7.6 | 7.8 | 7.6 | 6.7 | 8.7 | 7.1 | 6.9 |
| Jul | 7.8 | 7.4 | 7.2 | 6.9 | 7.7 | 8.2 | 7.3 | 6.4 |
| Aug | 7.9 | 7.9 | 8.1 | 7.9 | 7.4 | 8.1 | 8.4 | 6.4 |
| Sep | 8.1 | 8.1 | 7.3 | 7.3 | 7.4 | 8.3 | 8.5 | 6.7 |
| Oct | 7.2 | 7.9 | 7.9 | 7.6 | 7.7 | 7.2 | 8.6 | 6.9 |
| Nov | 8.0 | 8.5 | 8.5 | 8.0 | 8.6 | 7.6 | 9.3 | 7.0 |
| Dec | 8.4 | 8.6 | 10.5 | 9.7 | 9.2 | 8.7 | 9.3 | 9.0 |
The visualization of DTR within Bangkok throughout the years is shown in Fig 2.2 and Fig 2.3.
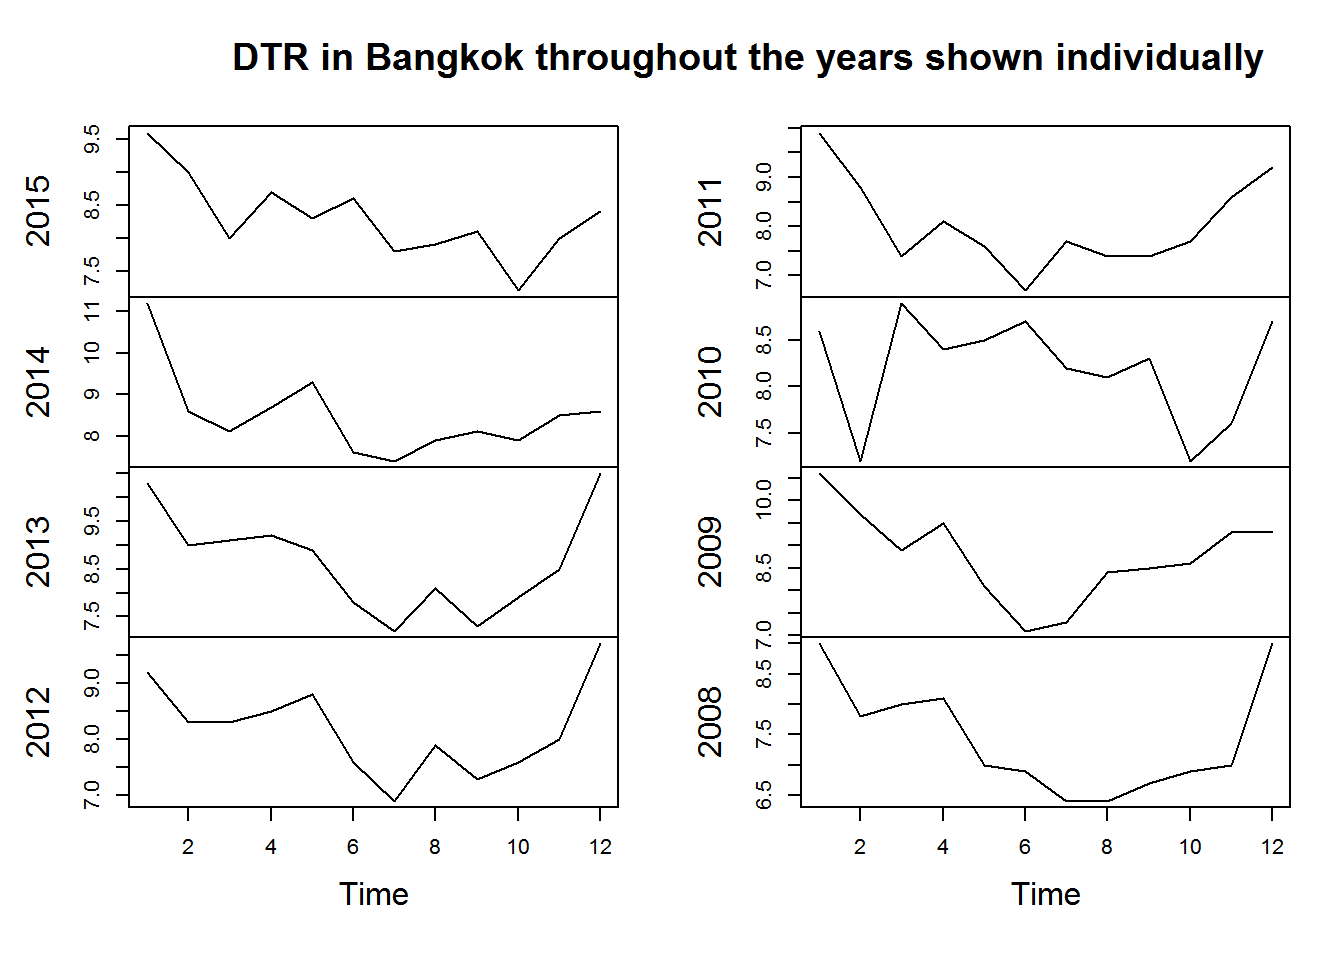
Figure 2.2: DTR within Bangkok throughout the years put together shown individually.
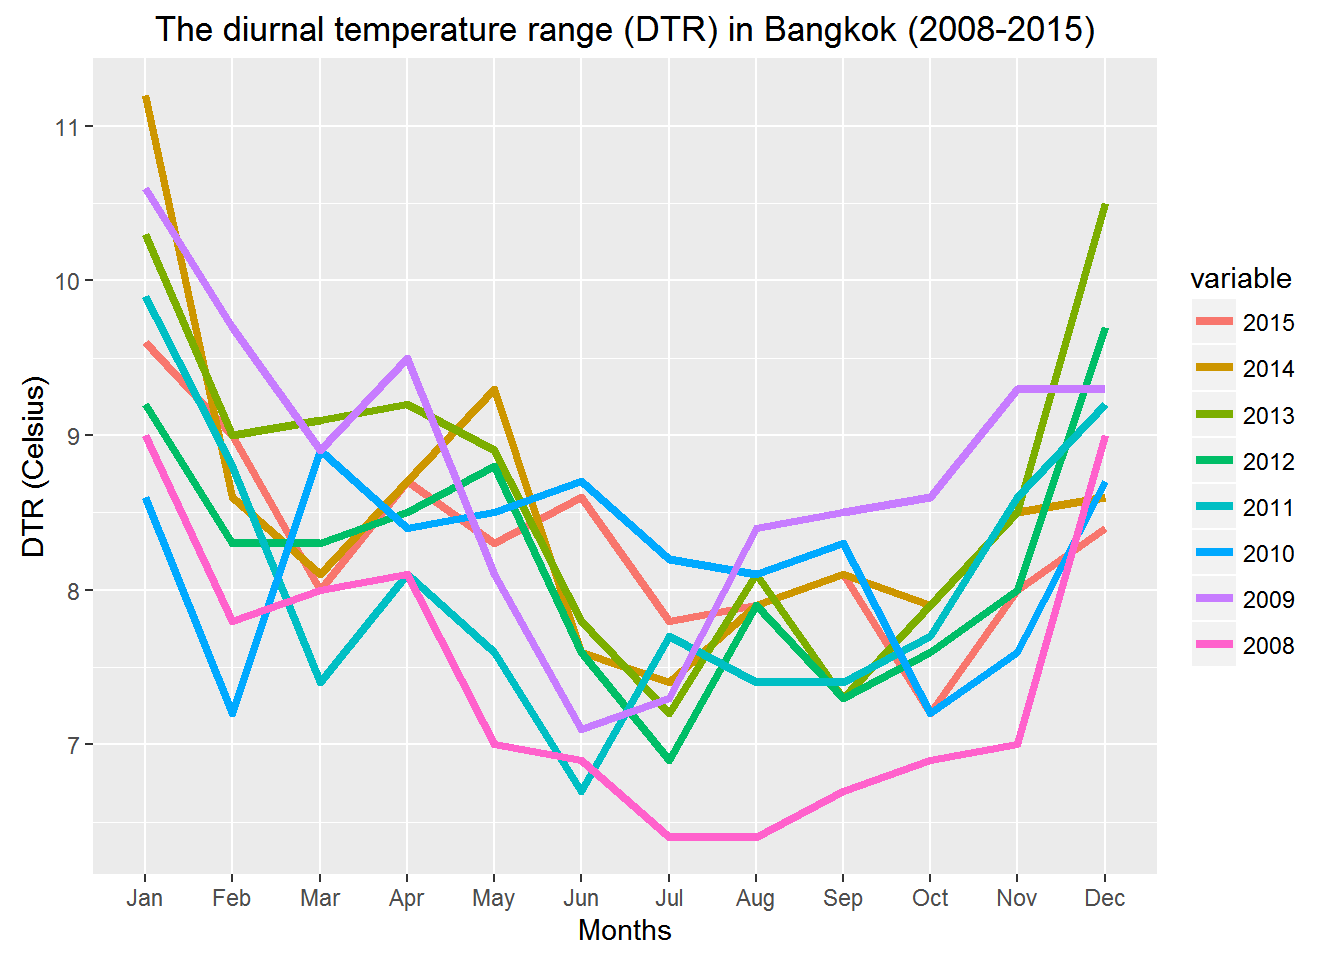
Figure 2.3: DTR within Bangkok throughout the years put together.
2.2.2 Rainfall
The data for average monthly rainfall in Bangkok is shown in Table 2.2.
Plotting average monthly rainfall for all the years on the same plot.
| Month | 2015 | 2014 | 2013 | 2012 | 2011 | 2010 | 2009 | 2008 |
|---|---|---|---|---|---|---|---|---|
| Jan | 3.5 | 0.000 | 32.206 | 43.354 | 0.630 | 99.9 | 0.0 | 62.1 |
| Feb | 16.8 | 2.512 | 4.098 | 18.654 | 37.342 | 2.9 | 0.0 | 69.3 |
| Mar | 183.9 | 19.314 | 35.918 | 31.888 | 136.716 | 14.6 | 30.2 | 3.6 |
| Apr | 128.9 | 25.358 | 64.366 | 51.914 | 136.662 | 17.3 | 359.6 | 180.8 |
| May | 82.5 | 125.410 | 111.540 | 108.984 | 246.128 | 279.3 | 463.4 | 257.9 |
| Jun | 495.0 | 125.936 | 206.946 | 123.418 | 196.584 | 198.8 | 219.3 | 163.6 |
| Jul | 220.8 | 122.270 | 142.212 | 176.626 | 288.680 | 348.7 | 175.7 | 221.8 |
| Aug | 50.5 | 218.006 | 228.214 | 190.436 | 292.804 | 343.1 | 354.0 | 172.1 |
| Sep | 352.4 | 203.436 | 312.220 | 548.736 | 266.538 | 409.5 | 351.8 | 335.2 |
| Oct | 334.2 | 206.998 | 314.090 | 236.996 | 337.502 | 256.3 | 264.2 | 399.3 |
| Nov | 34.9 | 51.506 | 69.286 | 106.022 | 1.880 | 30.6 | 46.5 | 36.7 |
| Dec | 42.7 | 25.926 | 2.060 | 12.256 | 0.584 | 22.7 | 7.3 | 0.0 |
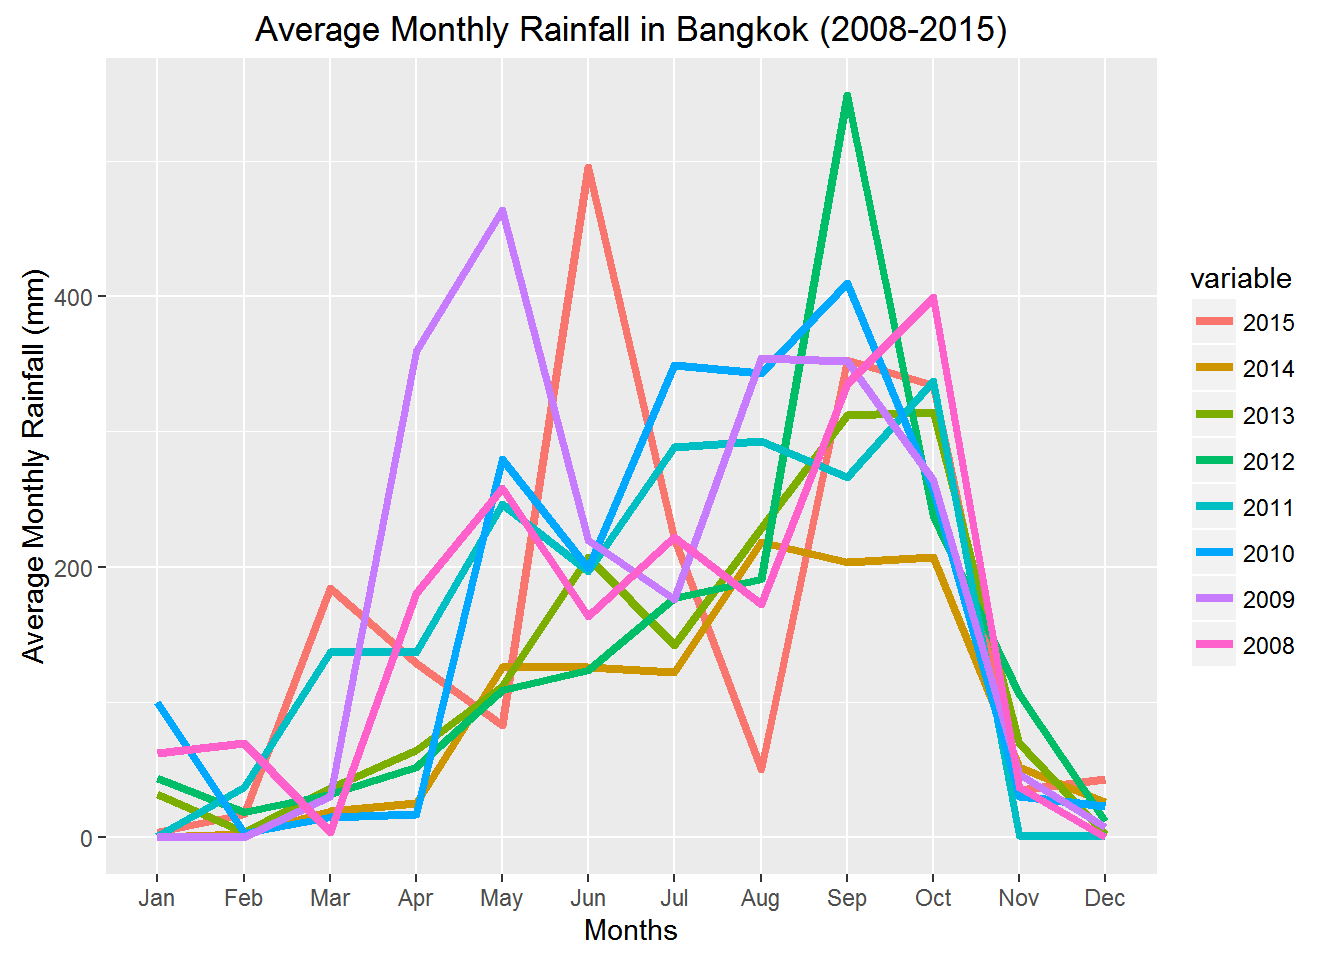
Figure 2.4: DTR within Bangkok throughout the years put together.
2.3 Dengue Incidences
In this study, we only use the data for DHF.
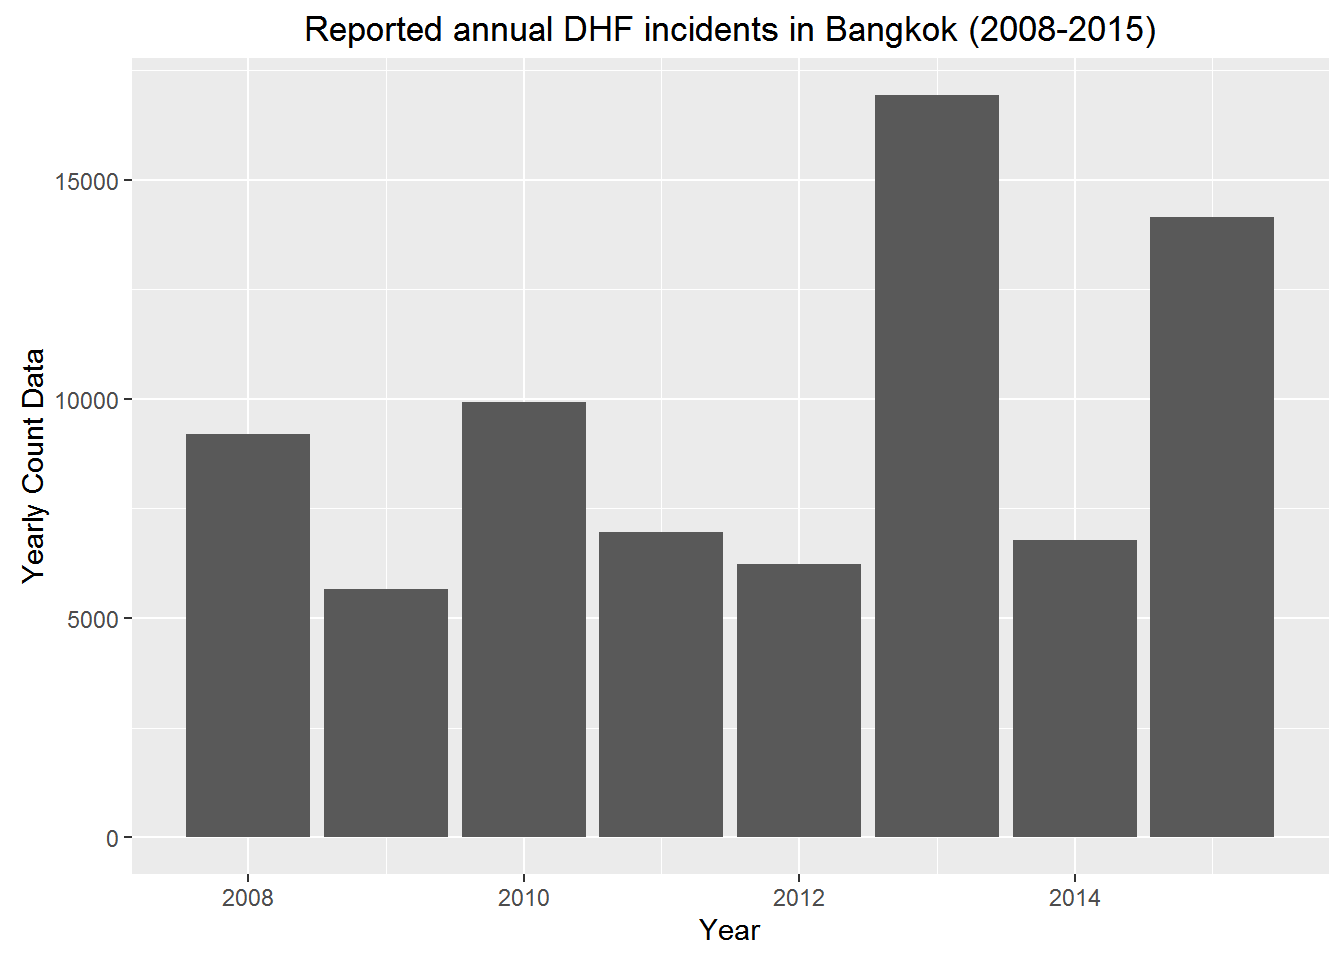
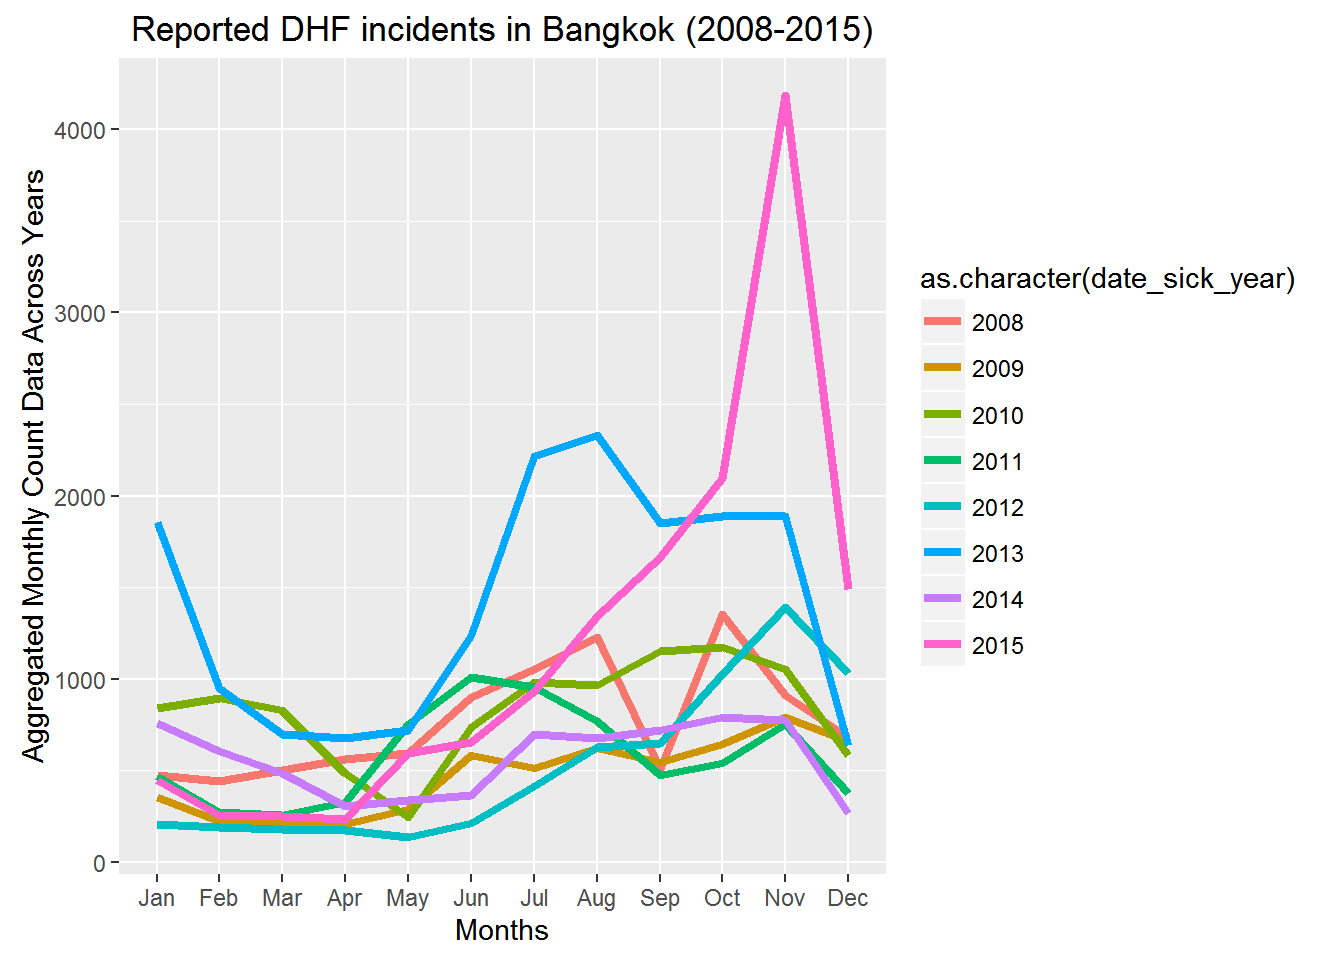
Figure 2.5: The DHF incidence peaked in 2013 and 2015. It seems that dengue outbreak increases every alternative year.
We can observe a trend in Fig 2.5 that dengue outbreak increases every alternative year. But is it really a pattern? Well, we don’t have enough data for say that, however we will check and see if we can exploit this ‘pattern’ for better prediction of dengue.
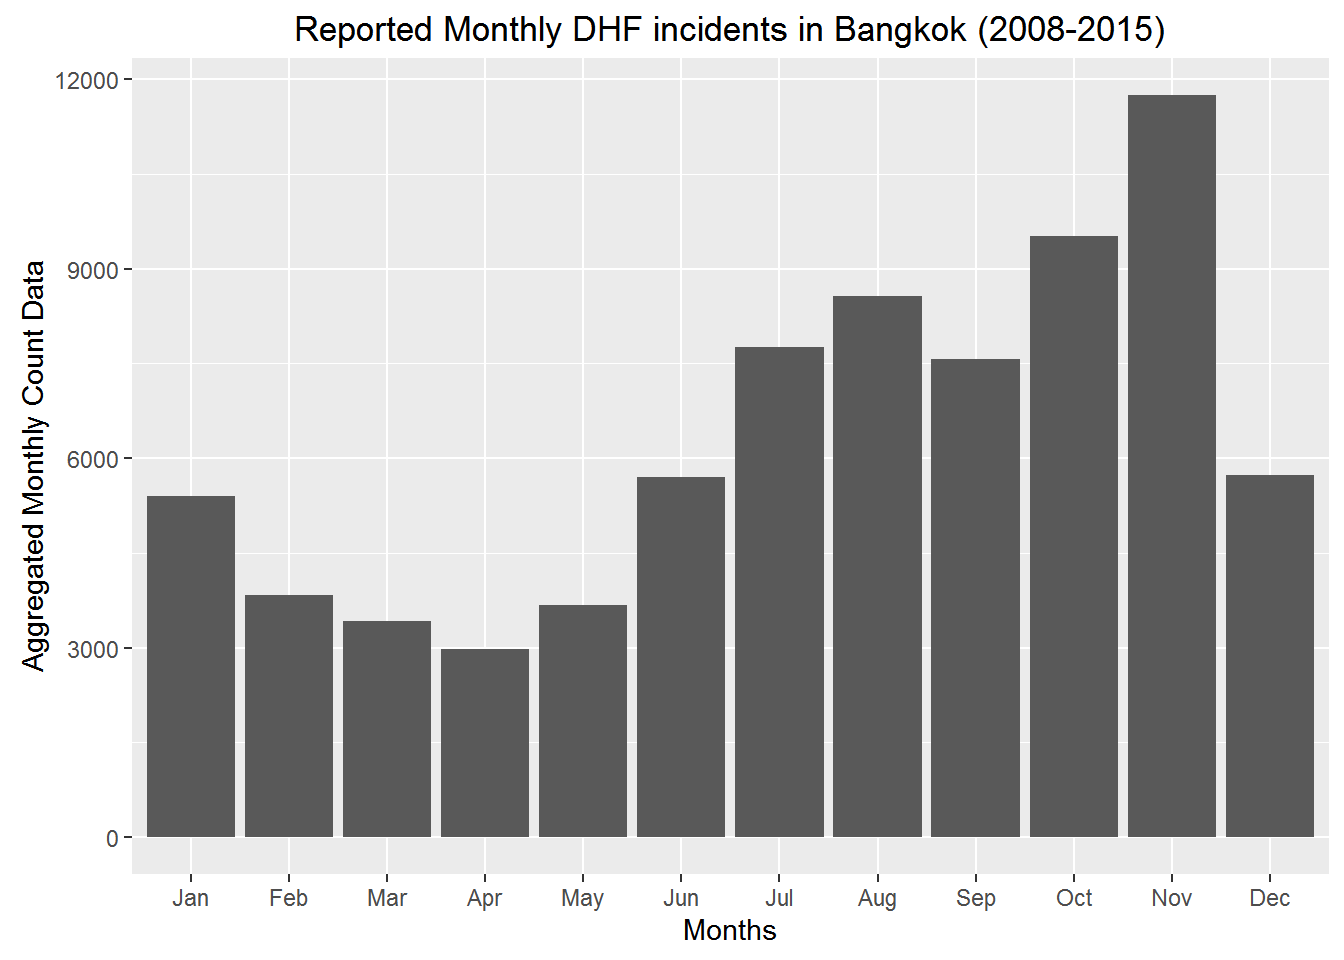
Figure 2.6: The DHF incidence peaked in October and November . It seems that dengue outbreak increases every alternative year.
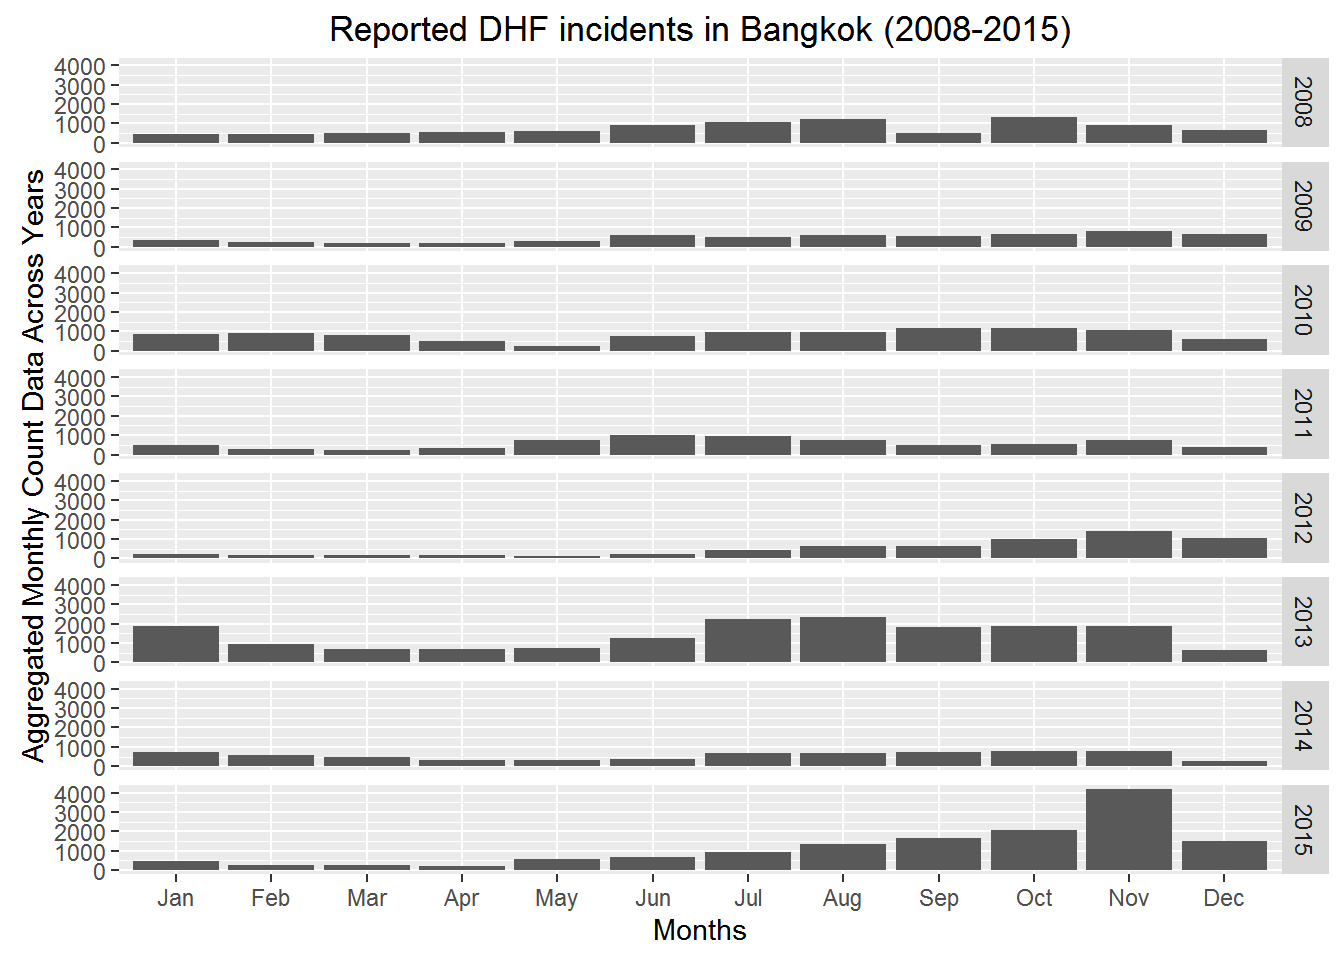
Figure 2.7: The DHF incidence peak every year in the months of October and November. However in the year 2013 it seems that DHF occured for many months continously at an alarming rate.
2.4 Interaction of Meteorological Variables
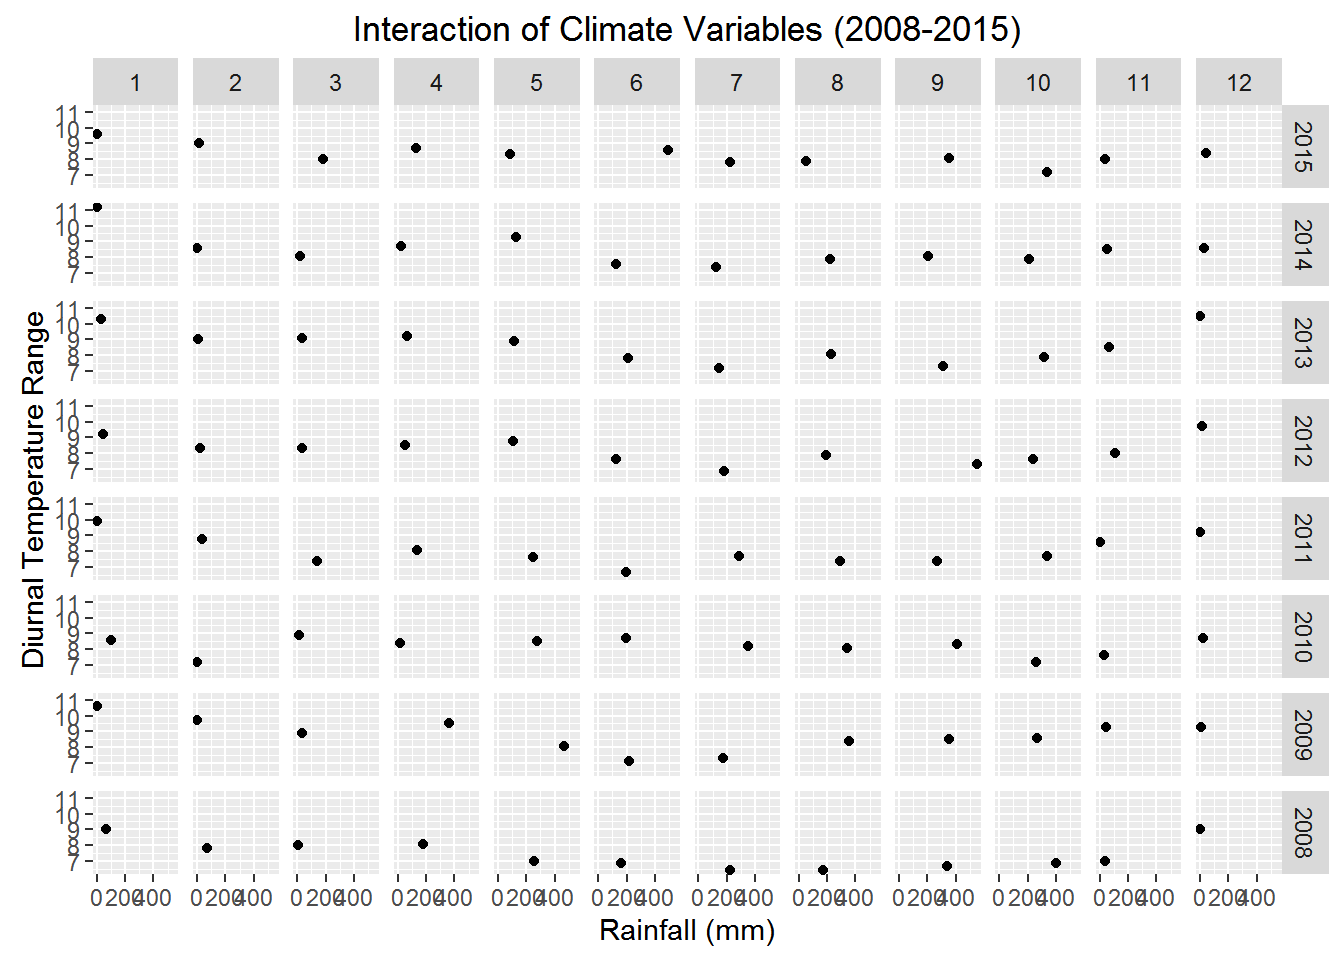
Figure 2.8: The temperature and rainfall data rogether acroos several years
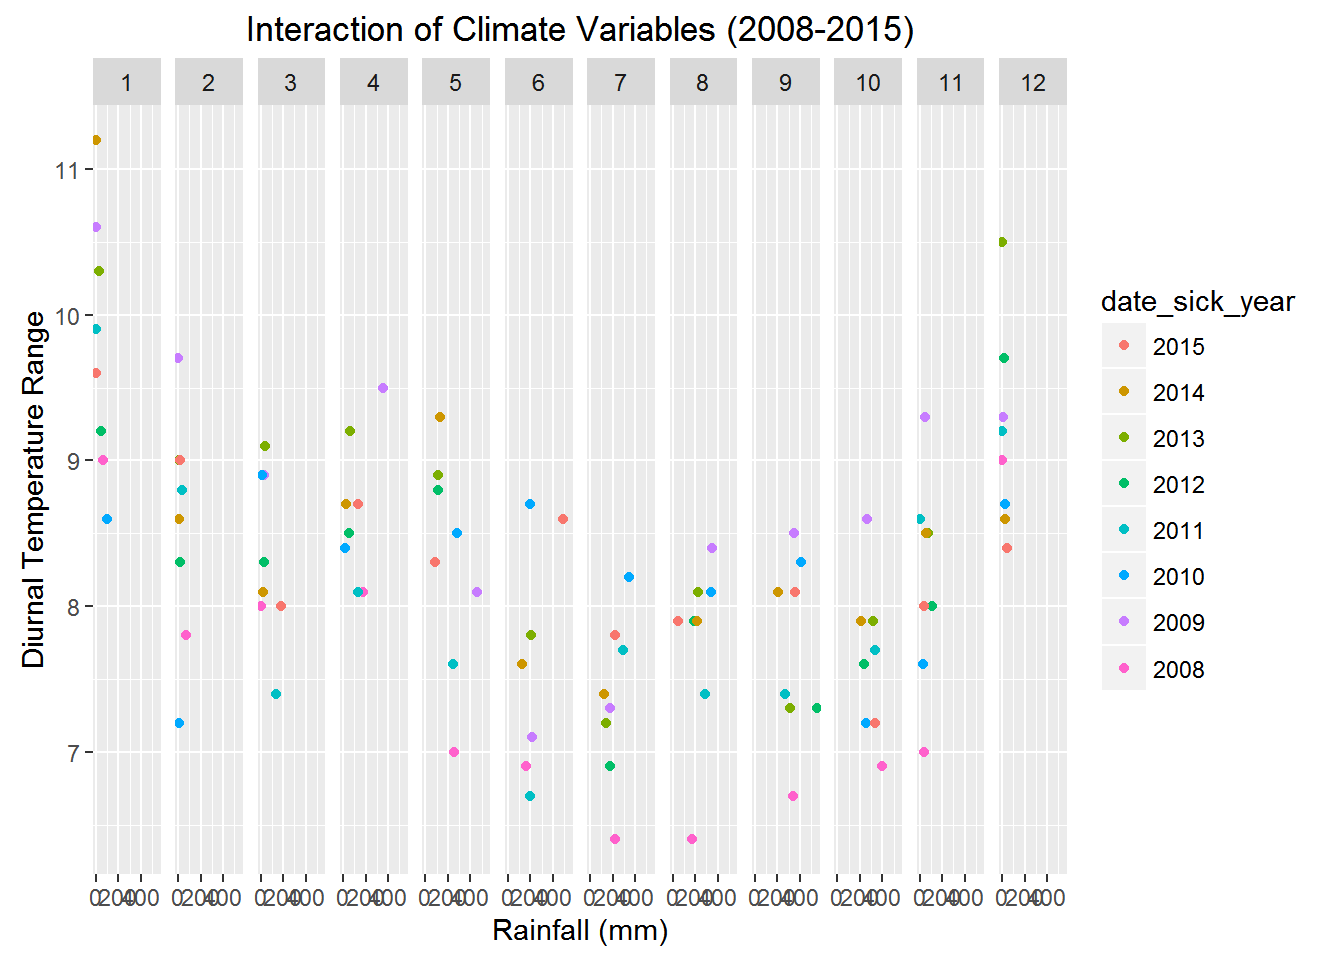
Figure 2.9: The temperature and rainfall data rogether in the same plot.
There are 18 districts that are close to stream as shown in Figure 2.1. Their names are:
 [1] "Bang Su"         "Dusit"           "Bang Plad"
 [4] "Phra Nakhon"     "Bangkok Noi"     "Bangkok Yai"
 [7] "Thon Buri"       "Khlong San"      "Pom Pram Sattru"
[10] "Samphantawong"   "Bang Rak"        "Sathorn"
[13] "Bang Kho Laem"   "Yannawa"         "Rat Burana"
[16] "Khlong Toey"     "Prakanong"       "Bang Na"
References
Wikipedia. 2016. “List of Districts of Bangkok — Wikipedia, the Free Encyclopedia.” https://en.wikipedia.org/w/index.php?title=List_of_districts_of_Bangkok&oldid=732094425.