6 ggplot2 formatare grafic
##
## Attaching package: 'dplyr'
## The following objects are masked from 'package:stats':
##
## filter, lag## The following objects are masked from 'package:base':
##
## intersect, setdiff, setequal, union
zboruri <- flights[flights$year==2013 & flights$carrier=='AS',]
ggplot(data=zboruri, aes(x=dep_delay, y=arr_delay))+
  geom_point(aes(color=air_time))
## Warning: Removed 5 rows containing missing values (`geom_point()`).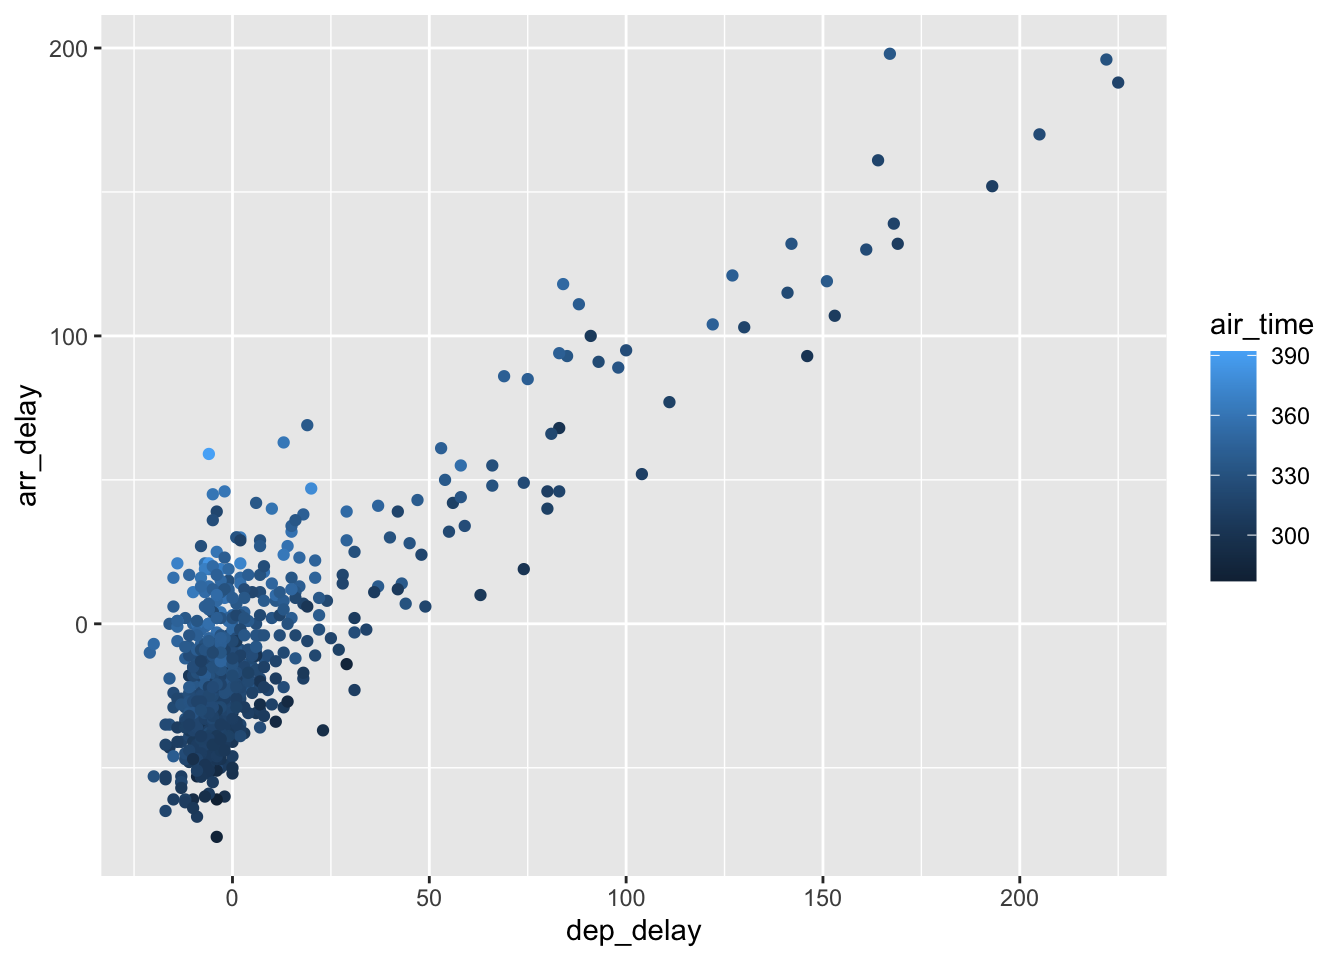
format text
ggplot(data=zboruri, aes(x=dep_delay, y=arr_delay))+
  geom_point(aes(color=air_time))+
  theme(
    axis.text.x = element_text(face='bold', size=13, angle=45, color='tomato'),
    axis.text.y = element_text(face='italic', size=15, angle=90, color='deepskyblue')
  )
## Warning: Removed 5 rows containing missing values (`geom_point()`).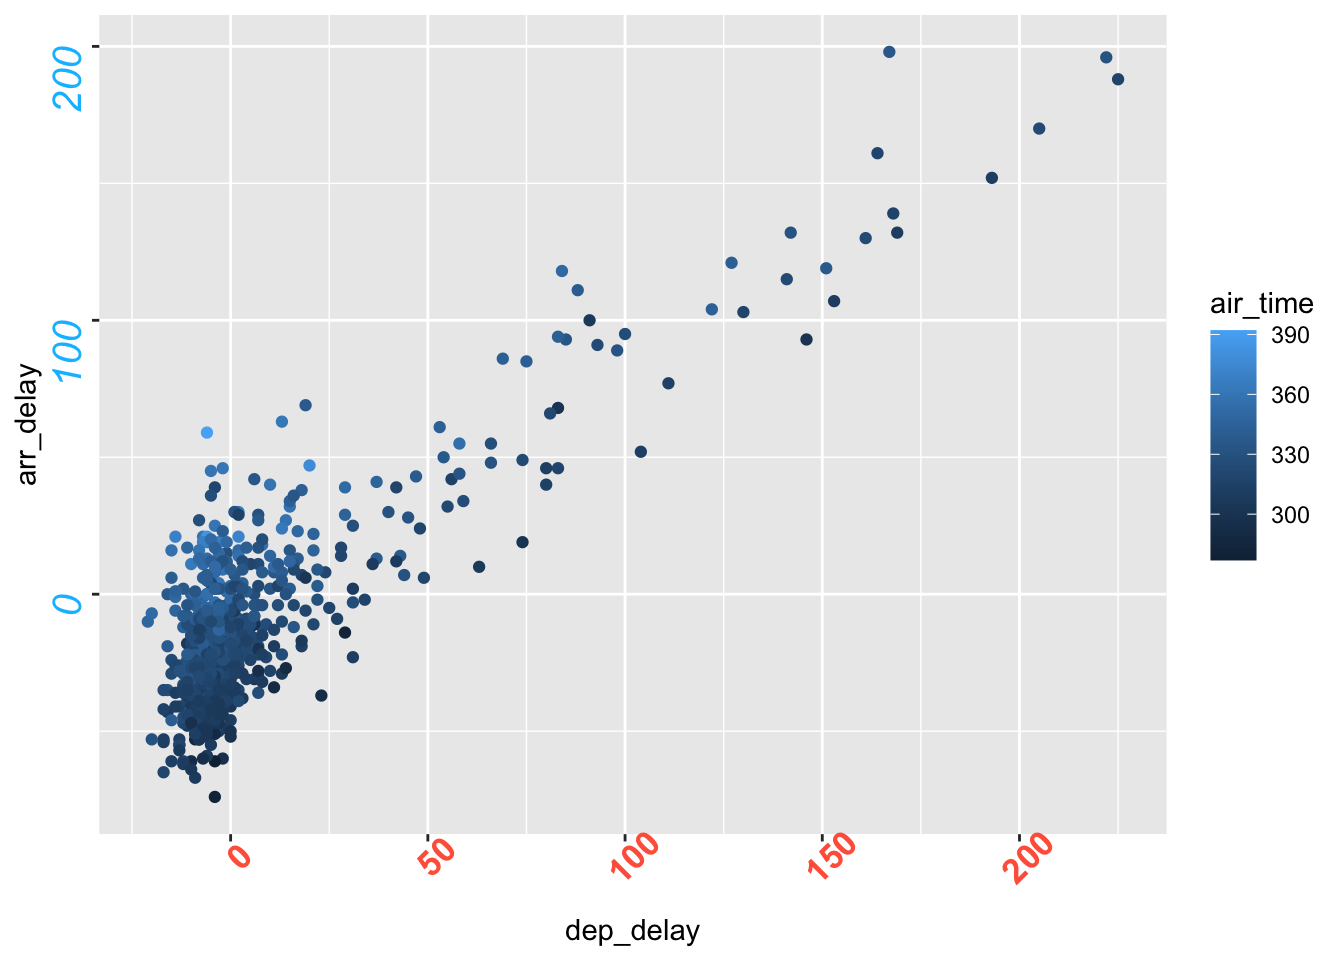
fara text pe axe
ggplot(data=zboruri, aes(x=dep_delay, y=arr_delay))+
  geom_point(aes(color=air_time))+
  theme(
    axis.text.x = element_blank(),
    axis.text.y = element_blank()
  )
## Warning: Removed 5 rows containing missing values (`geom_point()`).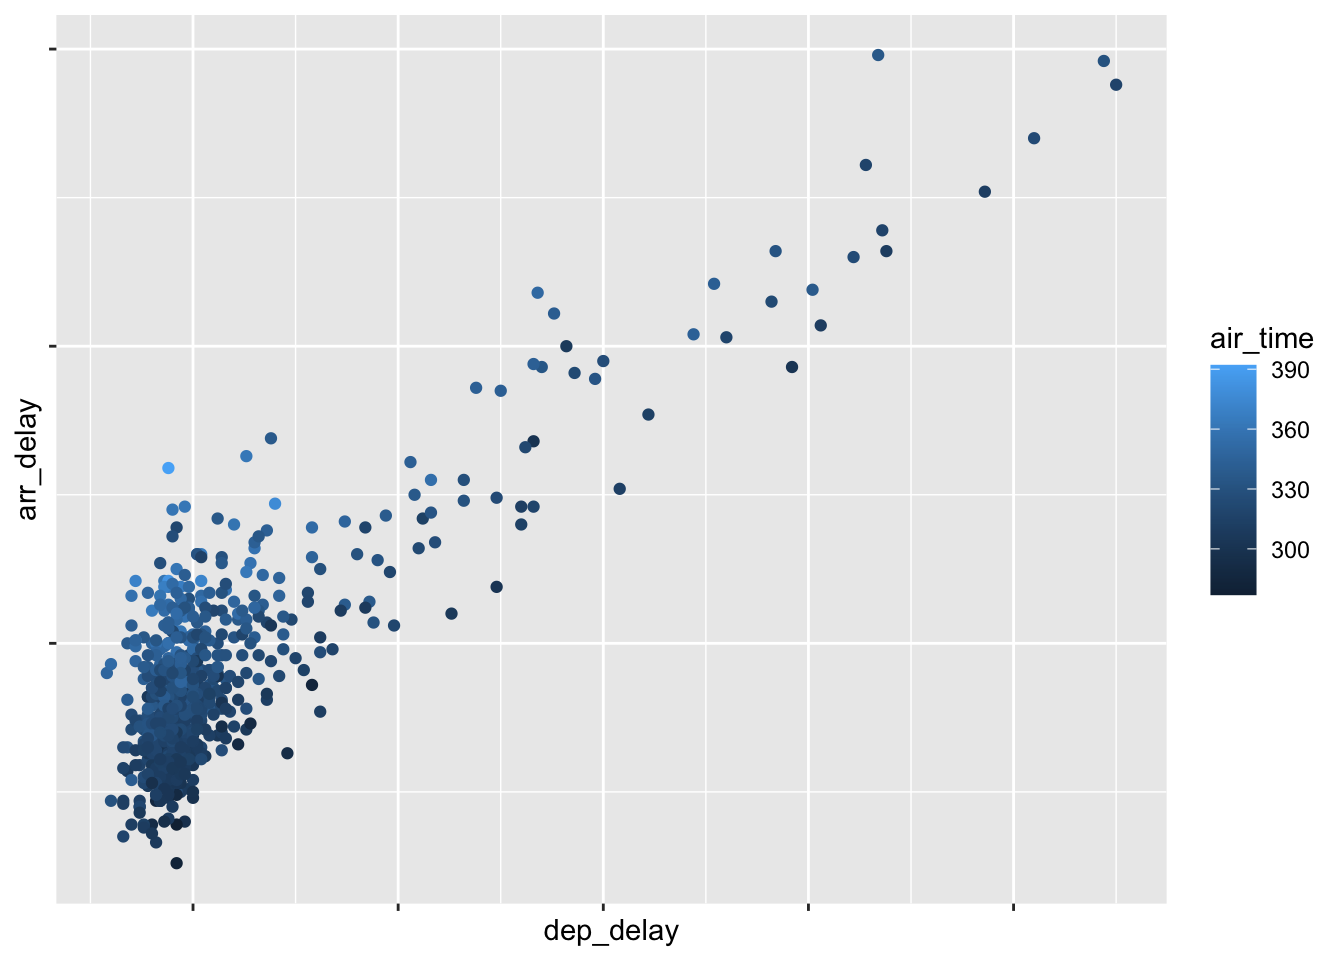
fara ticks
ggplot(data=zboruri, aes(x=dep_delay, y=arr_delay))+
  geom_point(aes(color=air_time))+
  theme(
    axis.text.x = element_blank(),
    axis.text.y = element_blank(),
    axis.ticks = element_blank()
  )
## Warning: Removed 5 rows containing missing values (`geom_point()`).
scale_x_discrete(name, breaks, labels, limits)
scale_y_discrete(name, breaks, labels, limits)
- pentru grafice cu var discrete…
scale_x_continuous(name, breaks, labels, limits)
scale_y_continuous(name, breaks, labels, limits)
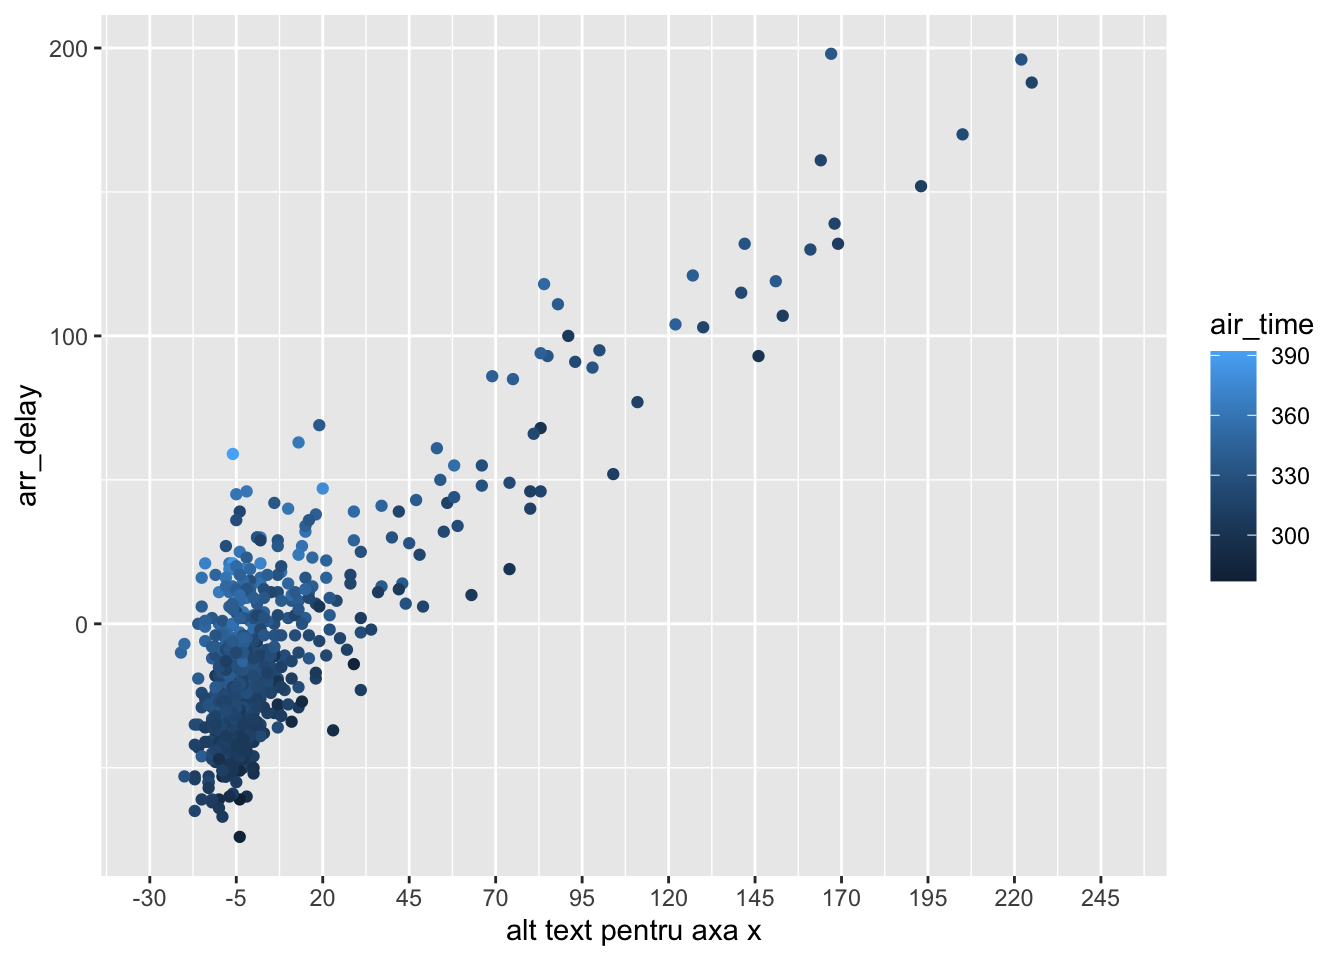
ggplot(data=zboruri, aes(x=dep_delay, y=arr_delay))+
  geom_point(aes(color=air_time))+
  scale_x_continuous(name="alt text pentru axa x",
                     limits = c(-30,250),
                     breaks = c(0, 140, 210))
## Warning: Removed 5 rows containing missing values (`geom_point()`).
?seq
seq(from=10, to=100, by=3)## [1] 10 13 16 19 22 25 28 31 34 37 40 43 46 49 52 55 58 61 64
## [20] 67 70 73 76 79 82 85 88 91 94 97 100
ggplot(data=zboruri, aes(x=dep_delay, y=arr_delay))+
  geom_point(aes(color=air_time))+
  scale_x_continuous(name="alt text pentru axa x",
                     limits = c(-30,250),
                     breaks = seq(-30, 250, 25))
## Warning: Removed 5 rows containing missing values (`geom_point()`).