5 Triple-Double vs Categorical Variables
First, we would like to find out whether each one these following categorical variables is a helpful predictor of whether Westbrook recorded a triple-double. They include the game result of Russ’ team; OKC - win or lose; where the game was hosted - at OKC’s house or away; and where OKC’s opponent is from - East or West. Since we want to model the TripDbl variable as the response, it’d be a good idea to code it as a factor before getting the models.
5.1 Game Result
The first relationship we are interested in looking at is between whether Westbrook tallies a triple-double and OKC’s game result. We start off with a simple bar plot of number of triple-double associated with games won and lost, accompanied by a two-way table of counts.
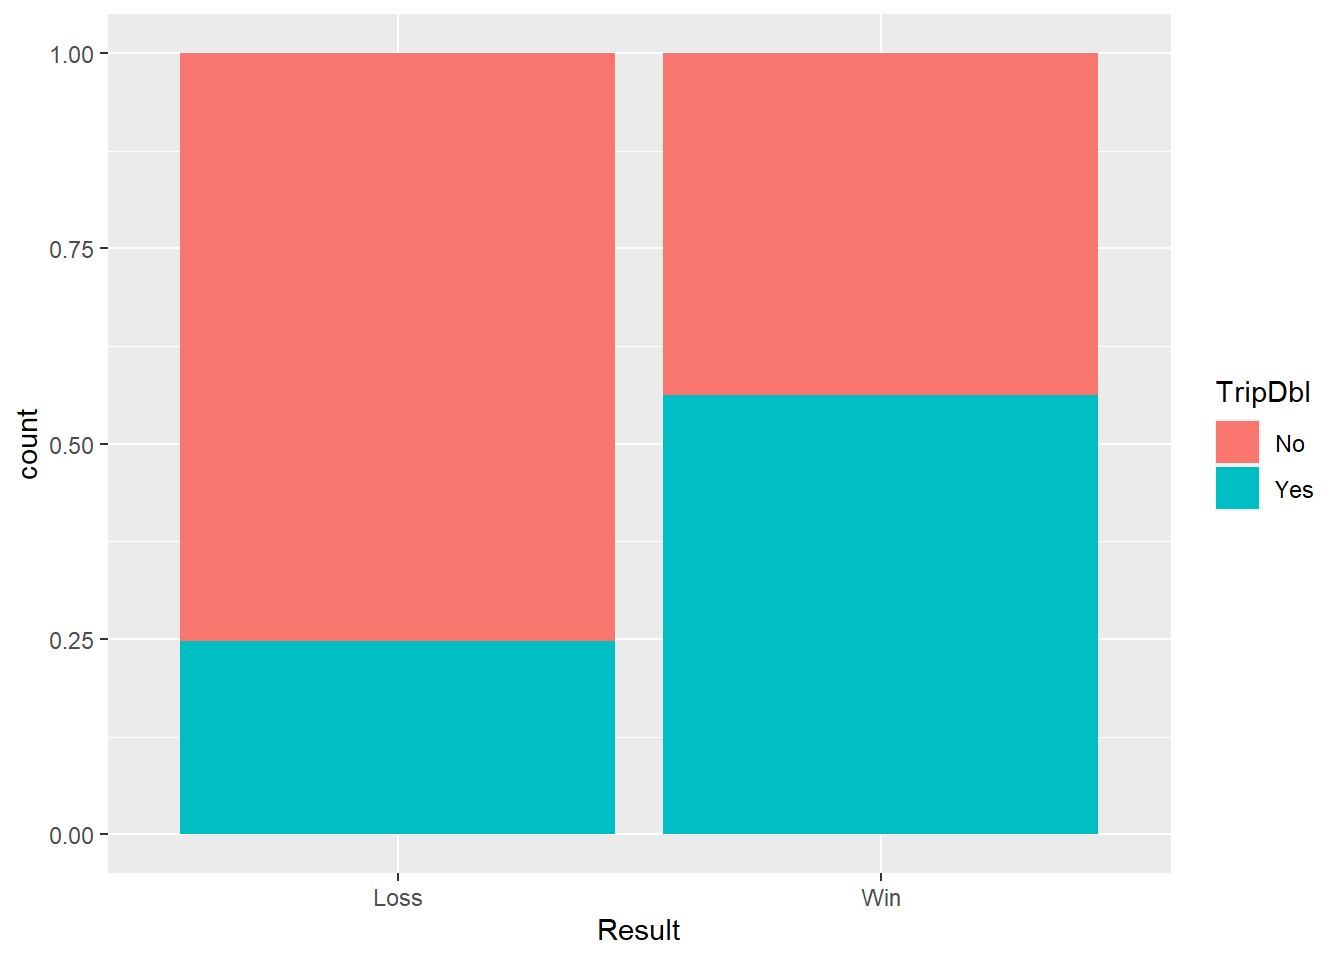
##        Result
## TripDbl Loss Win
##     No    73  60
## Yes 24 77## Result
## TripDbl Loss Win
## No 75.26 43.80
## Yes 24.74 56.20Just by looking at our basic summaries, we can tell that the chance of having a triple-double in wins is higher than in losses. Now we’d like to compare the likelihood of success, specifically the likelihood of recording a triple-double in a win and a loss of Westbrook. One way to do this is to use the above two-way table to calculate the empirical odds and empirical odds ratio between these two categories.
## [1] 1.283333## [1] 0.3287671## [1] 3.903472We get the empirical odds of having a triple-double in a win and in a loss are 1.28 and 0.33 respectively. Their odds ratio of 3.9 indicates that the empirical odds of notching a triple-double in a victory are 3.9 times higher than the odds of finishing with this stat line in a defeat.
Now we’re going fit a logistic regression model to illustrate the relationship between tripled-double outcome (Yes/No) and game result (Win/Loss). As a quick refresher, logistic regression is used to model a binary categorical response variable, meaning that there are exactly two outcome levels (yes/no, pass/fail, heads/tails, etc.) The general equation for a logistic regression model is of the form
\[\displaystyle log(odds) = logit(\pi) = log \left( \frac{\pi}{1- \pi} \right) = \beta_0 + \beta_1 X_{1} + \beta_2 X_{2} + \ldots + \beta_k X_{k}\]
with main components: the log odds of success as the response variable; and a linear predictor \(\beta_0 + \beta_1 X_1 + \beta_2 X_2 + \ldots + \beta_k X_k\), which is a linear combination of the explanatory variables (the \(X\)’s), with the \(\beta\)’s as the regression coefficients to be estimated.
To get the logistic regression model for our first relationship, we use R’s glm function, which stands for “generalized linear models”. In addition to a model statement and a data argument, we also specify that we want logistic regression for a binary categorical variable (“family = binomial”)
We can now make inferences about the term in our logistic regression model. Here we’d like to know if the likelihood of Westbrook accumulating double figures in three basketball statistics differs for wins and losses.
##              Estimate Std. Error   z value     Pr(>|z|)
## (Intercept) -1.112406  0.2352981 -4.727644 2.271404e-06
## ResultWin    1.361866  0.2915800  4.670645 3.002558e-06
Since we get a (Wald) Z standardized test statistic of 4.67 and a small corresponding p-value of 0.000, we have evidence that the chance of Russ having a triple-double differ for the 2 types of game result - win and loss. Thus we have significant evidence that the result of the game helps predict whether a triple-double is recorded.
Now let’s construct and interpret a 95% confident interval for the Result Win coefficient. R gives us the 95% CI for the log odds ratio, so we’d exponentiate the endpoints to get the odds of Russ notching a triple-double for winning vs losing result.
##                  2.5 %     97.5 %
## (Intercept) -1.5938084 -0.6670185
## ResultWin 0.8014312 1.9474729## 2.5 % 97.5 %
## (Intercept) 0.2031505 0.5132365
## ResultWin 2.2287285 7.0109475So we get a 95% confident interval of (2.23, 7.01). Thus we’re 95% confident that Russ has 2.23 to 7.01 times greater odds of recording a triple-doubles in wins than losses
5.2 Side
The second relationship we’re going to look at is between triple-double and OKC’s playing side (home or away). As always, we begin with basic visual and numerical summaries of our variables.
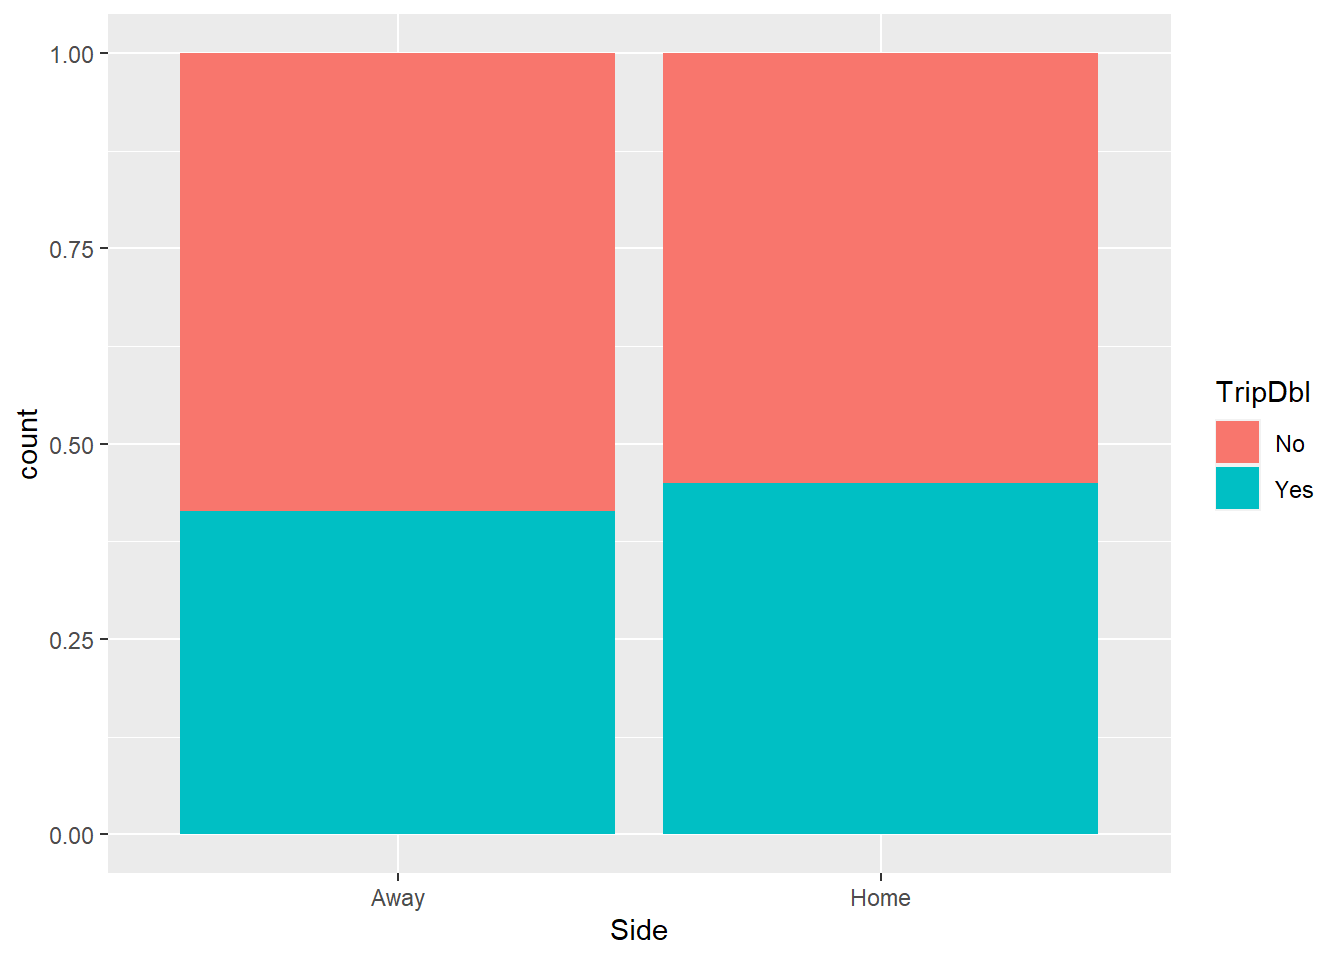
##        Side
## TripDbl Away Home
##     No    68   65
## Yes 48 53## Side
## TripDbl Away Home
## No 58.62 55.08
## Yes 41.38 44.92It doesn’t seem like side has much of an effect on triple-double outcome according to the above graph and numbers. This time, instead of using the logistic regression approach, to test for a relationship between two categorical variables (triple-double and side in this case), we use Karl Pearson’s infamous Chi-square test for association. The null hypothesis for this test is there’s no relationship between the variables, and the alternate hypothesis is that the two variables are related.
##
##  Pearson's Chi-squared test with Yates' continuity correction
##
## data:  SideTable
## X-squared = 0.17141, df = 1, p-value = 0.6789
Since we get a fairly large p-value of 0.679, we don’t have evidence that triple-double and side are not related. In other words, Westbrook’s team’s playing side is not a helpful predictor for whether he achieved a triple-double.
5.3 Opponent’s Conference
The last categorical variable we’re going to examine is opponent’s conference. We’d like to find out if Westbrook’s chance of tallying at least 10 points, 10 rebounds and 10 assists in the same game differ for contests against Eastern and Western opposing squads.
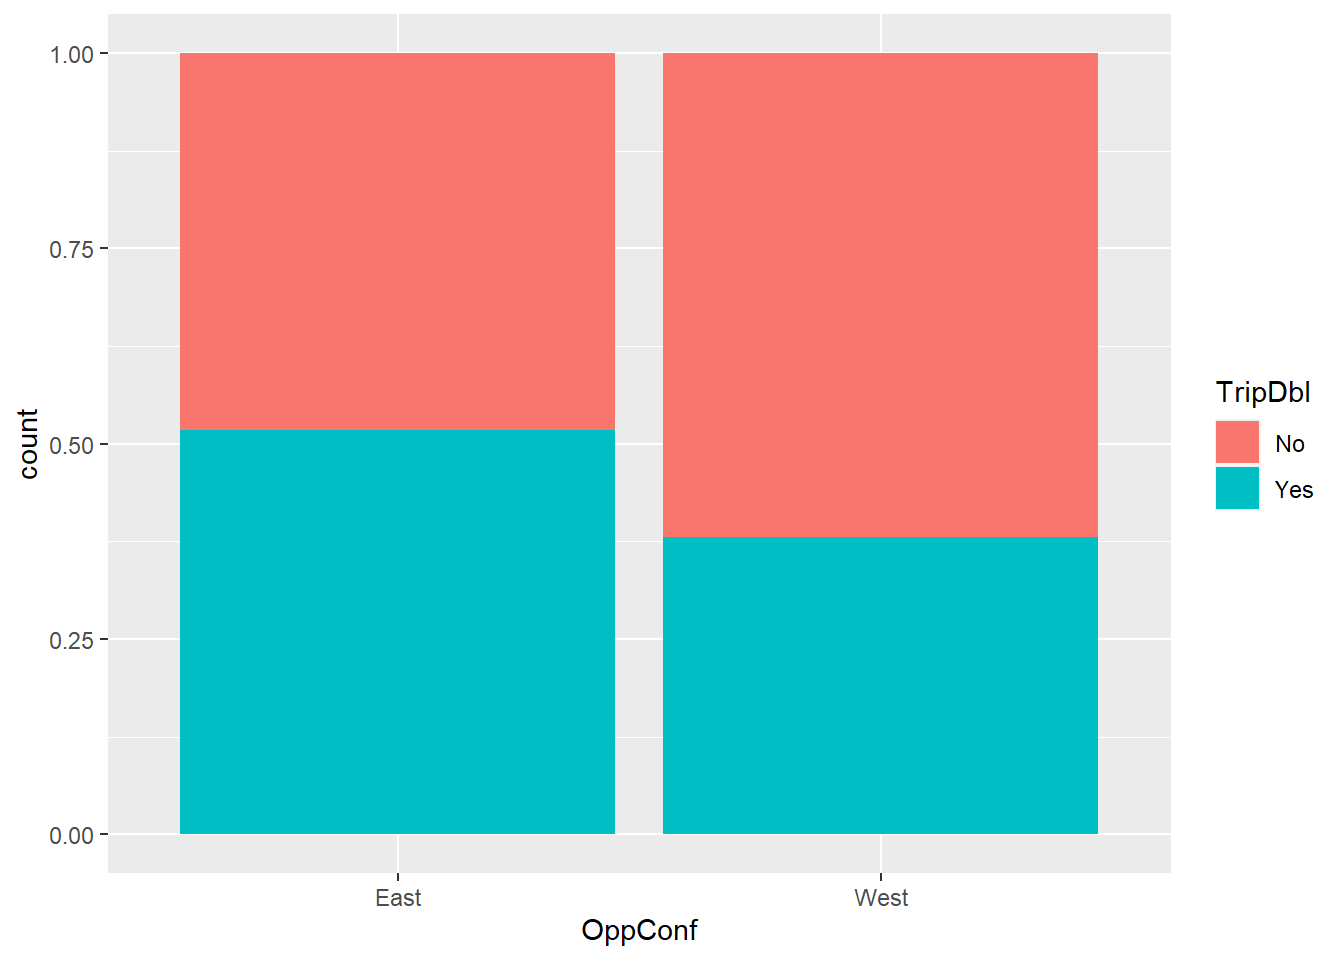
##        OppConf
## TripDbl East West
##     No    42   91
## Yes 45 56## OppConf
## TripDbl East West
## No 48.28 61.90
## Yes 51.72 38.10It seems like Westbrook has a higher chance of having a triple-double when playing against an East team than against a West team. This makes sense to some degree, since over the last few years, West teams have been stronger and the East has been viewed as the weaker conference (or according to some - the “Leastern” conference.)
We now take a look at the OppConf coefficient of the model and interpret it. Since the fitted slope of a logistic regression model tells us the log odds ratio, we’d back-transform with the corresponding exponential function to get the odds ratio.
## (Intercept) OppConfWest
## 0.06899287 -0.55450069## OppConfWest
## 0.574359So we get an odds ratio value of about 0.57, which in context means Westbrook has 0.57 times greater odds of tallying a triple-double in a game against a West team than in a contest with a team from the East. We can then make statistical inference to draw conclusions about the triple double - opponent’s conference relationship.
##                Estimate Std. Error  z value   Pr(>|z|)
## (Intercept)  0.06899287  0.2145501  0.32157 0.74777849
## OppConfWest -0.55450069  0.2736383 -2.02640 0.04272377
We get a p-value of 0.043, which is very close to our usual cutoff, 0.05, so it’s pretty marginal. But we can still conclude that West and East teams are different in terms of their chance of allowing a Westbrook triple-double when playing the Thunder. Hence, opponent’s conference is a helpful predictor for triple-double.