9.4 Multiple figures side by side
You can place multiple figures side by side using the fig.show="hold" along with the out.width option. In the example below, we have set out.width="50%" (see Figure 9.2 for the output):
```{r, figures-side, fig.show="hold", out.width="50%"}
par(mar = c(4, 4, .1, .1))
plot(cars)
plot(mpg ~ hp, data = mtcars, pch = 19)
```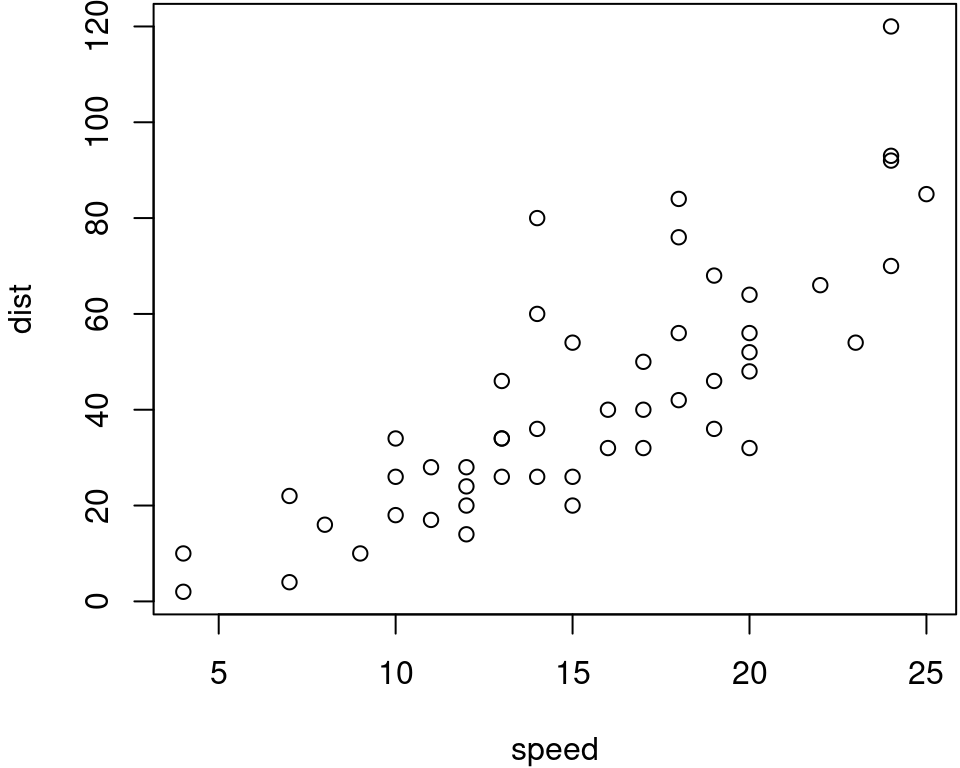
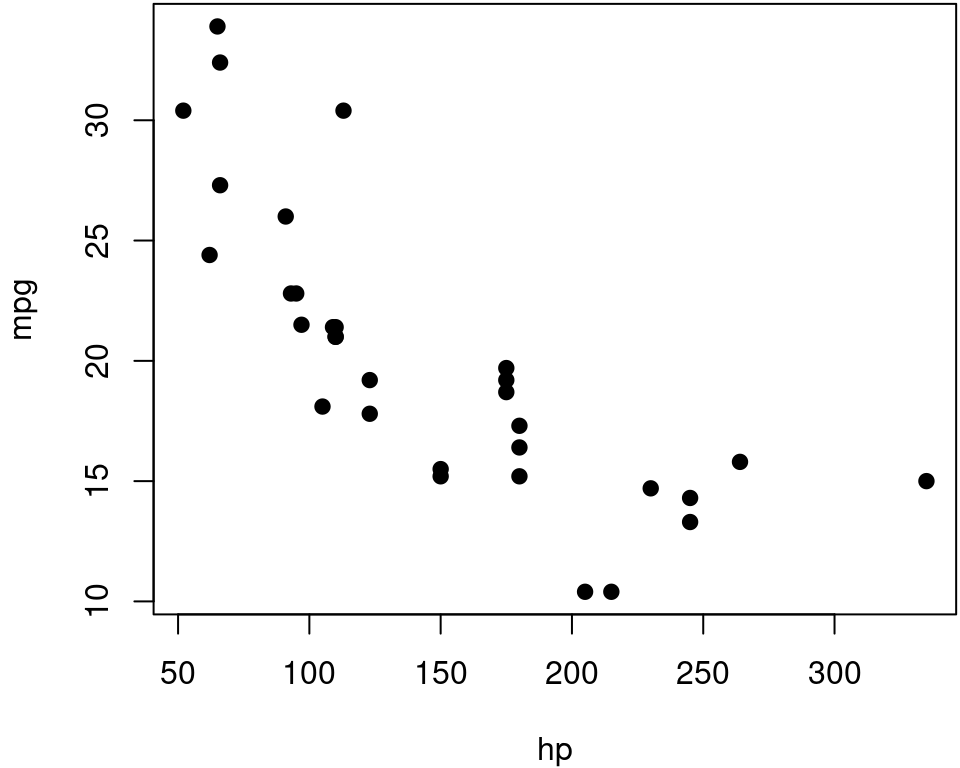
FIGURE 9.2: Side-by-side figures.
This simple approach works for both PDF and HTML output.
If you want to use sub-figures when there are multiple plots in a figure, you may see Section 6.6, but please note that sub-figures are only supported in LaTeX output.