Water Temperature
Interagency Ecological Program Spring Season report
Background
- Water temperature is monitored monthly by DWR’s Environmental Monitoring Program.
- Fish growth and reproduction is highest in certain temperature ranges.
- Increasing Spring temperatures may lower Delta Smelt reproduction.
- Spring temperatures are lower closer to the ocean and slightly higher in the Delta.
Figure 6: picture of a thermometer in water
Temperature by Region
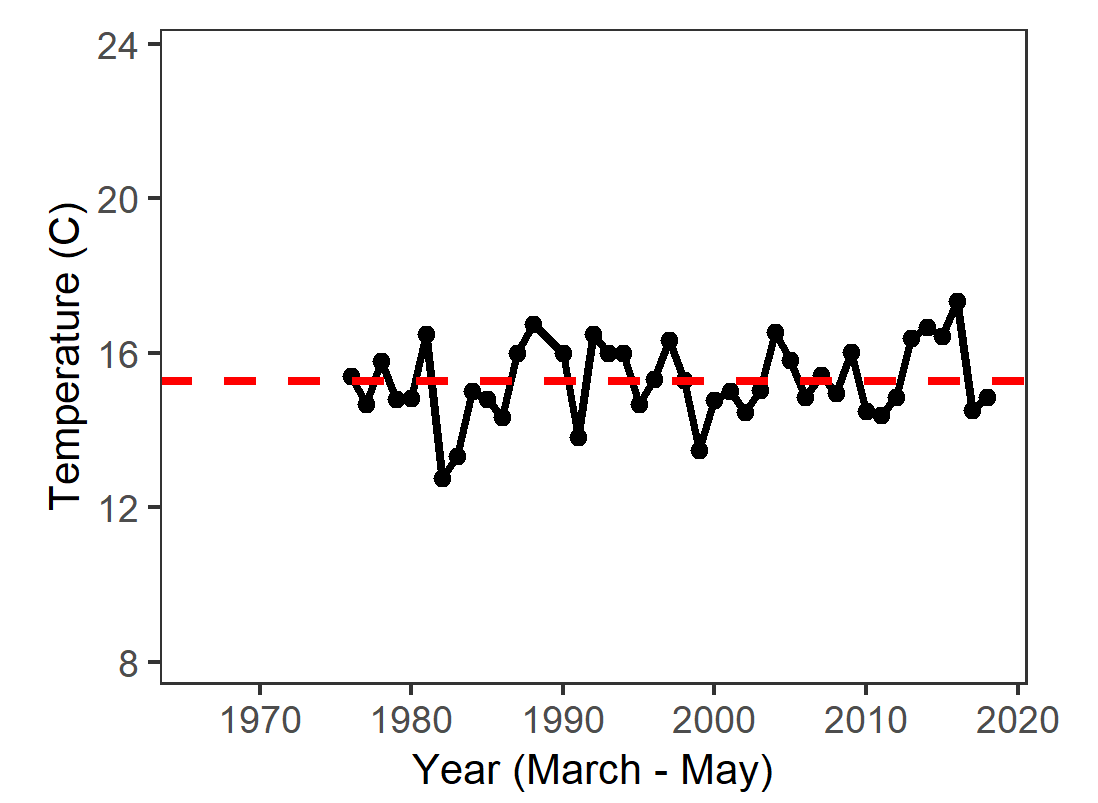
Figure 7: Graph of average spring water temperature in San Pablo Bay from 1975 to 2018. Values range from 13 to 18.
In 2018, San Pablo Bay temperatures were similar to the long-term average.
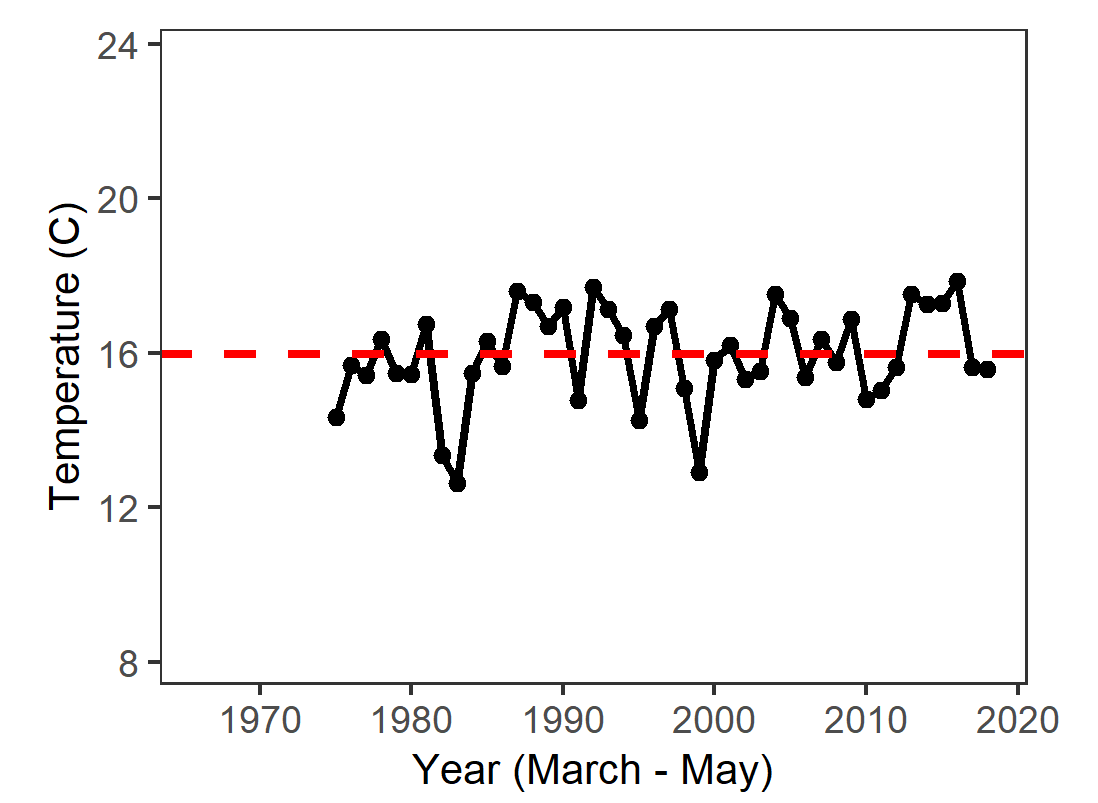
Figure 8: Graph of average spring water temperature in Suisun from 1975 to 2018. Values range from 13 to 18.
In 2018, Suisun Bay was similar to the long-term average.
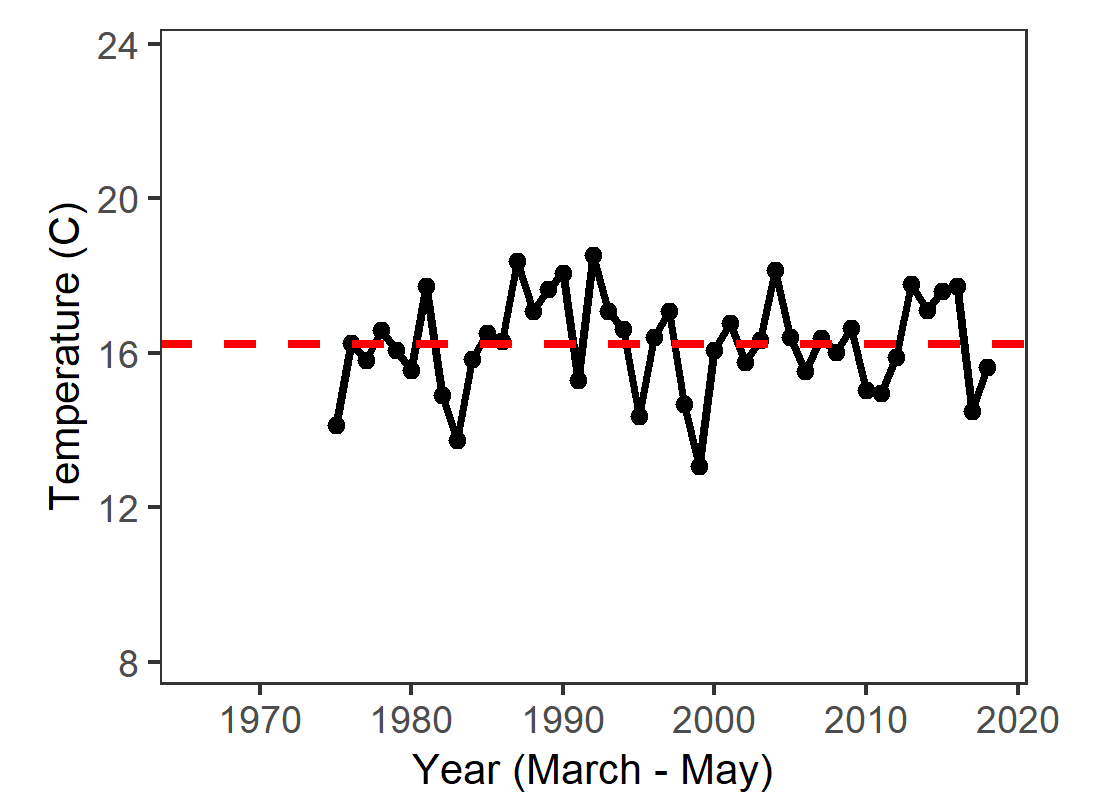
Figure 9: Graph of average spring water temperature in the Delta from 1975 to 2018. Values range from 13 to 18.
In 2018, the Delta was slightly cooler than average.
For more information see: Jeffries, et al.. 2016. Effects of high temperatures on threatened estuarine fishes during periods of extreme drought. The Journal of Experimental Biology 219(11):1705-1716.