Zooplankton
Interagency Ecological Program Spring Season report
Background
- Zooplankton is sampled monthly by the CDFW/DWR Environmental Monitoring Program but sampling in San Pablo Bay did not begin until 1998.
- Zooplankton are an important food source for pelagic fish.
- Calanoid copepods and mysids are particularly good fish food. Cyclopoid copepods are not as good for fish food.
- Biomass in Spring tends to be higher than Winter, but lower than Summer.
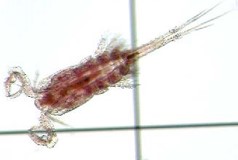
Figure 14: picture of a copepod
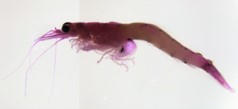
Figure 15: picture of a copepod
Average Spring Zooplankton Biomass by Region
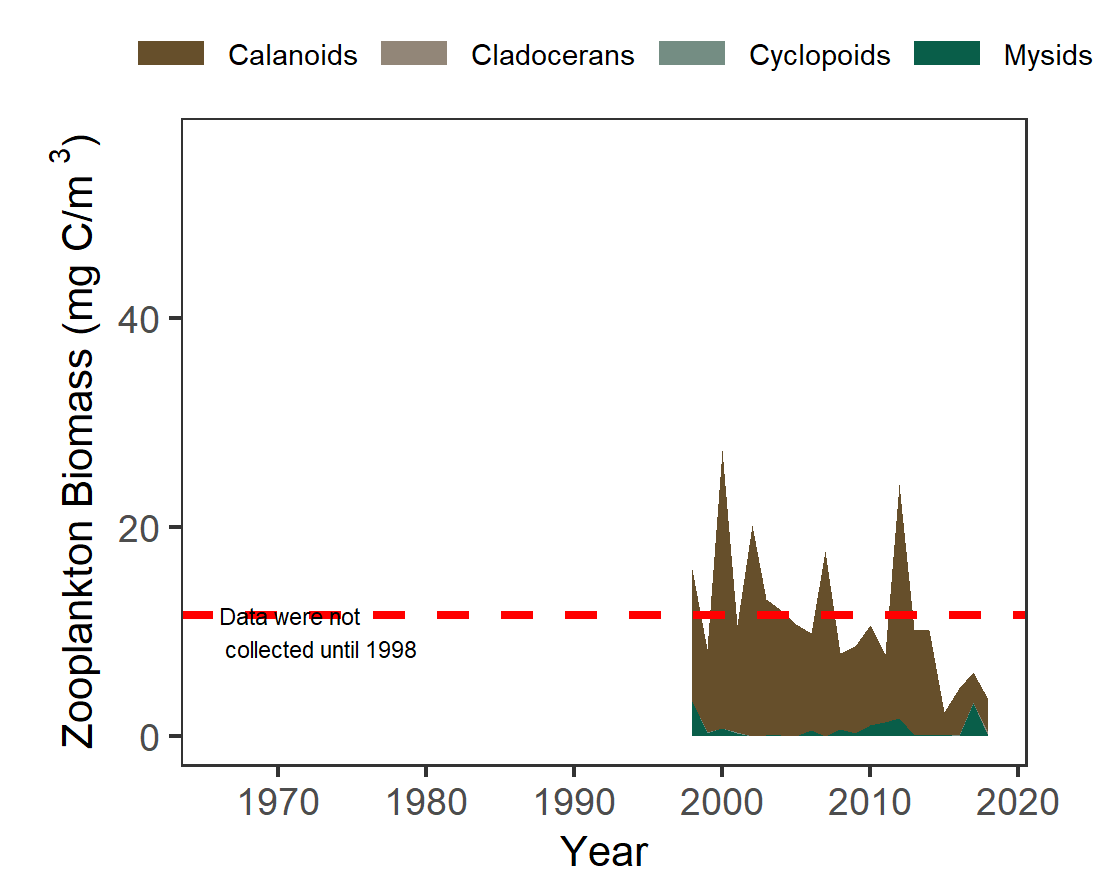
Figure 16: Graph of average spring zooplankton biomass in San Pablo Bay from 1975 to 2018. Values range from 5 to 25.
In 2018, San Pablo Bay had much lower than average biomass, mostly calanoid copepods
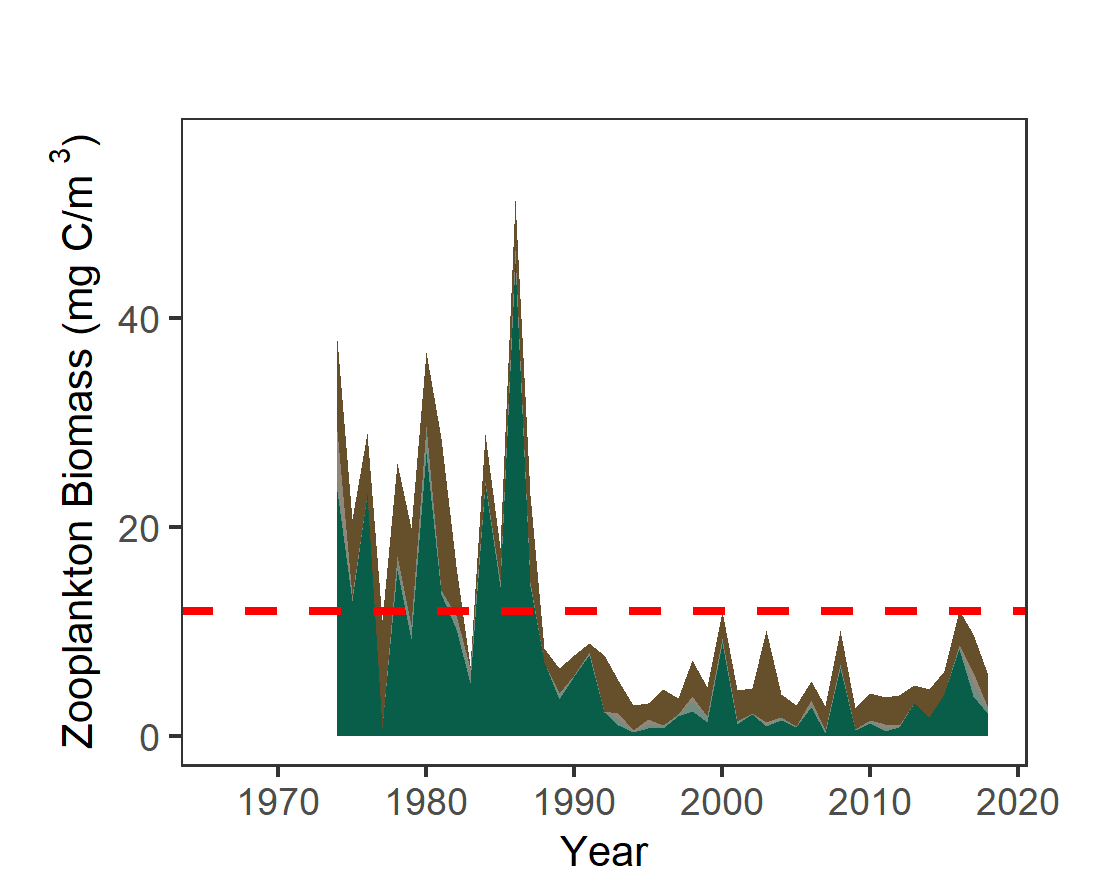
Figure 17: Graph of average spring chlorophyll in Suisun from 1975 to 2018. Values range from 5 to 45 with much higher biomass before 1986.
In 2018, Suisun Bay also had much lower than average total biomass.
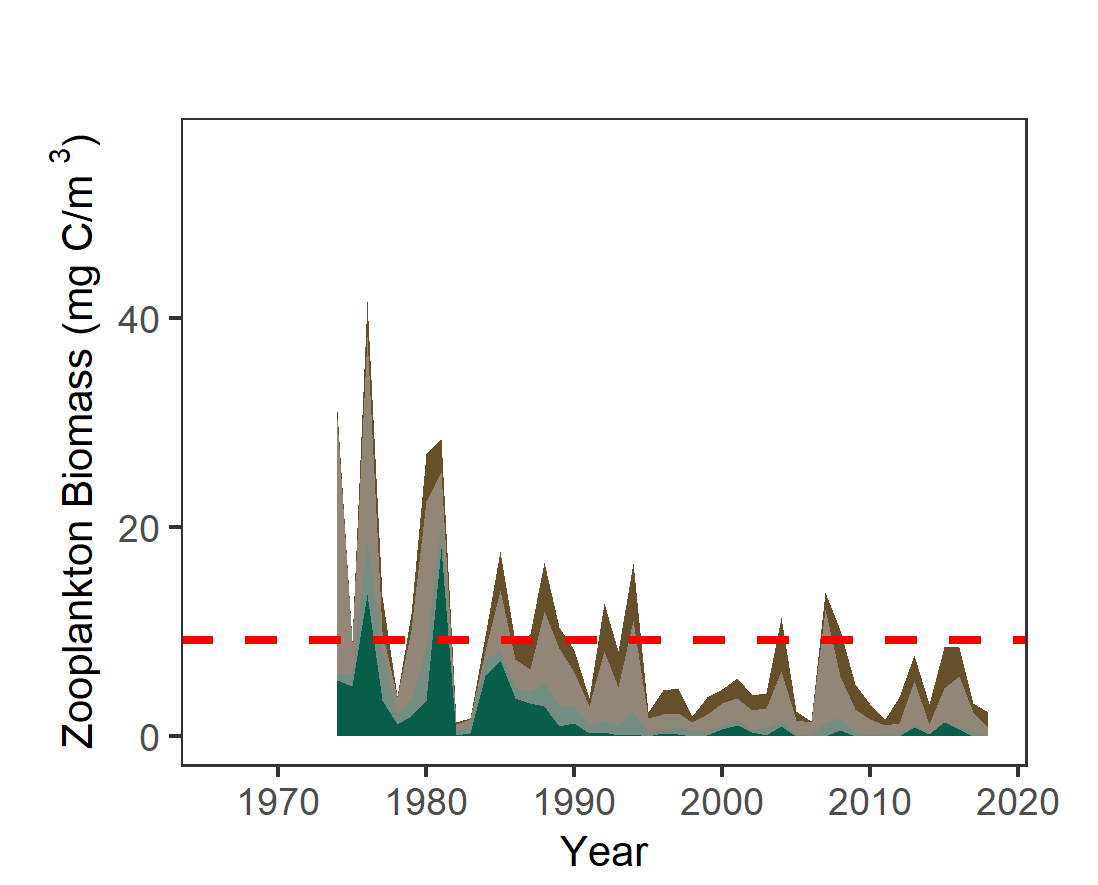
Figure 18: Graph of average spring zooplankton biomass in the Delta from 1975 to 2018. Values range from 3.5 to 39.
In 2018, the Delta also had much lower than average total biomass.
For more information see: Hennessy, A. 2018. Zooplankton Monitoring 2018. IEP Newsletter 32(1):21-32.