Chapter 4 Estimate true capture rate
These tools should be used following a green crab assessment to estimate either the true capture rate (section 4.2) or trap-adjusted capture rate (section 4.3) based on trapping results. If you have a management target (i.e., target true capture rate), use these tools to estimate the probability this target has been met.
Use these tools to interpret trapping results at a site over a relatively short time period. See section 1.3 for more information, which can help guide decisions about the spatial and temporal extent of data that should be aggregated together for interpretation.
Data can be uploaded from just one site and time period, or from multiple sites and time periods at once. Follow along for the recommended workflow for interpreting data across multiple sites and time periods.
The following tutorials are focused on interpreting trapping results. Refer to section 4.4 for more information about using eDNA in these tools.
4.1 Choosing a metric
These tools allow you to estimate two metrics: true capture rate and trap-adjusted capture rate. Choose the value you’d like to estimate based on your goals and/or data limitations.
- Choose to estimate the
true capture rate(section 4.2) for any of the following reasons:- You are interested in estimating one
true capture ratethat is not delineated by crab size. - The carapace width (mm) of the captured crabs was not recorded.
- You are interested in estimating one
- Choose to estimate the
trap-adjusted capture rate(section 4.3) for any of the following reasons:- You used multiple types of traps at a site and want to estimate a capture rate that standardizes across trap types.
- You want to compare the
true capture rateacross time and space when different trap types are used at different sites and time points. - You are interested in estimating a
true capture ratedelineated by crab size. - The carapace width (mm) of the captured crabs was recorded.
Note that if you have used multiple types of traps, especially shrimp traps in conjunction with fukui or minnow traps, estimating the true capture rate without adjusting for trap type will likely yield misleading results.
4.2 Estimate true capture rate
Download example data to follow along with this tutorial. These data represent crab captures from three sites and two time periods where minnow and fukui traps were used. At each site and time period, 60 total traps were set.
Navigate to Assessment Interpretation > Estimate true capture rate. In these sections, we will focus on only trapping efforts.
4.2.1 Uploading data
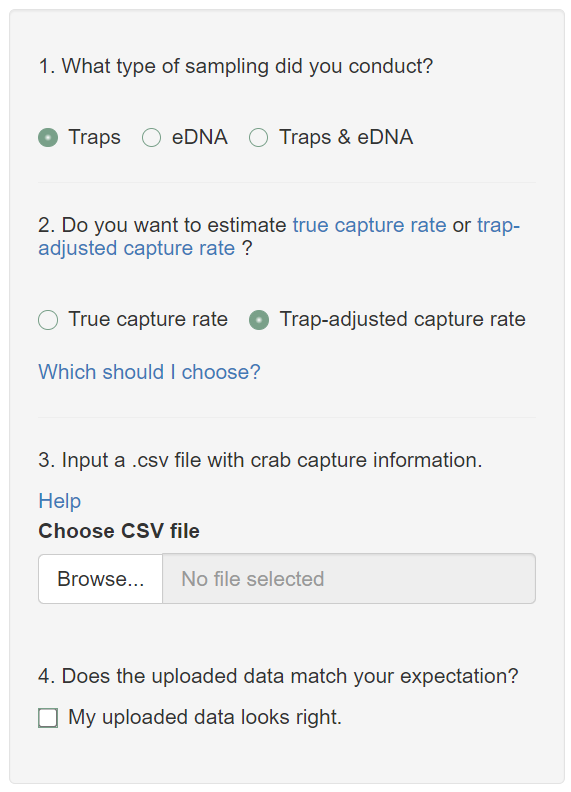
Select traps and true capture rate.
Ensure your uploaded data (.csv file) have the following requirements:
Include one row for each crab capture.
Must include columns labeled Crab_ID, Site_Name, Capture_Date, Trap_ID, and Trap_Type.
Optionally include columns labeled Latitude and Longitude to identify the locations of trapped crabs. This will be used if you want to visualize your results on a map.
Only include fukui, shrimp, and large-mouth minnow trap types. The following labels can be used:
- Minnow traps: Minnow, minnow, M, or m
- Fukui traps: Fukui, fukui, F, or f
- Shrimp traps: Shrimp, shrimp, S, or s
Data can include extra columns, but the data cannot have missing values in the Site_Name, Trap_ID, and Capture_Date fields.
Trap_ID can be any unique identifier for a trap set.
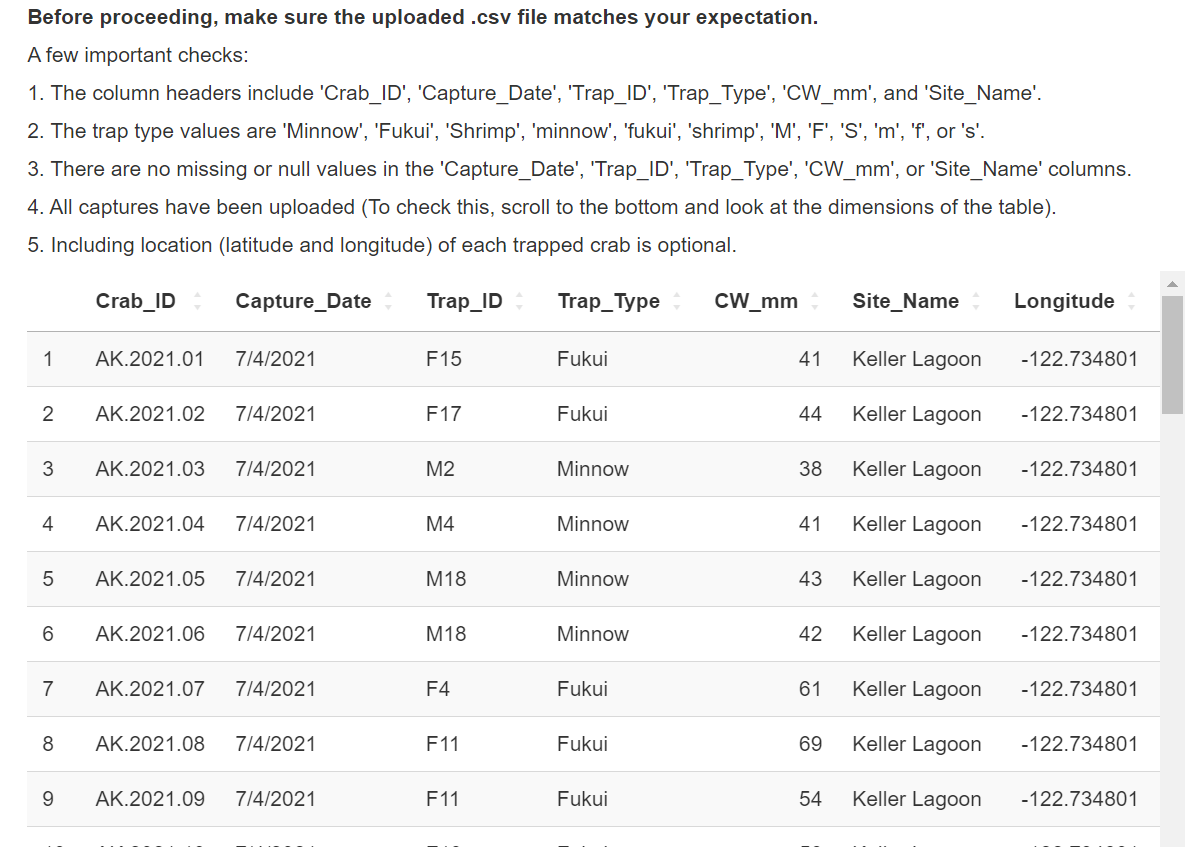
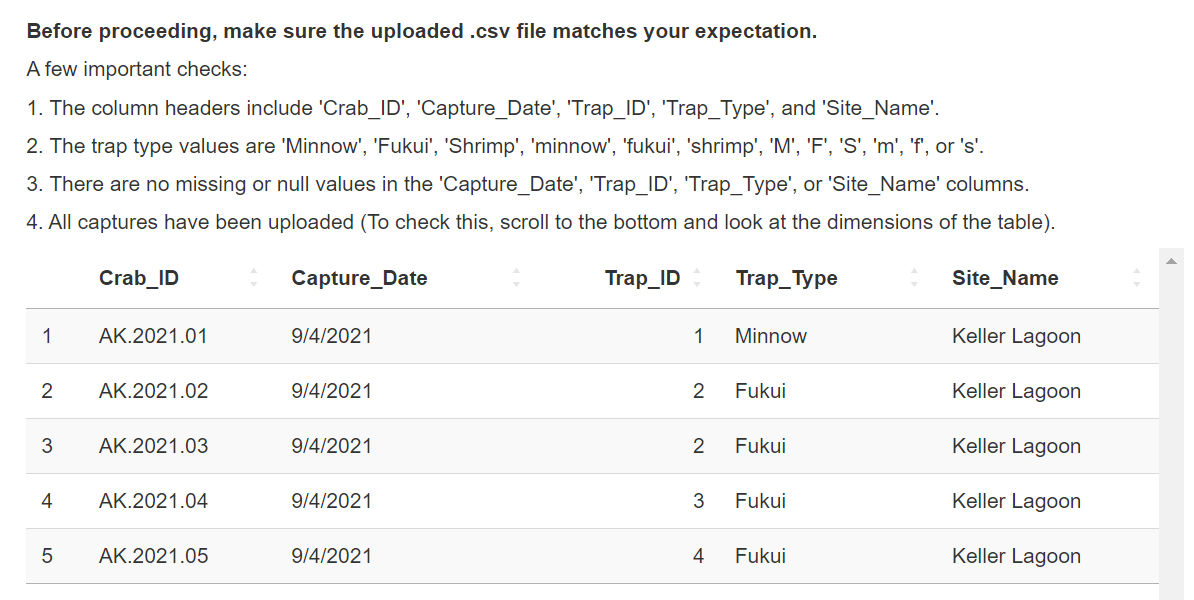
Upload your data and look through the data check to ensure your data has been uploaded into the app as expected. The most likely culprit for errors is mislabeled columns. Contact us at crabteam@uw.edu if you are having trouble.
If you are satisfied with how your data has been uploaded, check the My uploaded data looks right checkbox.
4.2.2 Inputs
Cycle through each site and time period you plan to interpret.
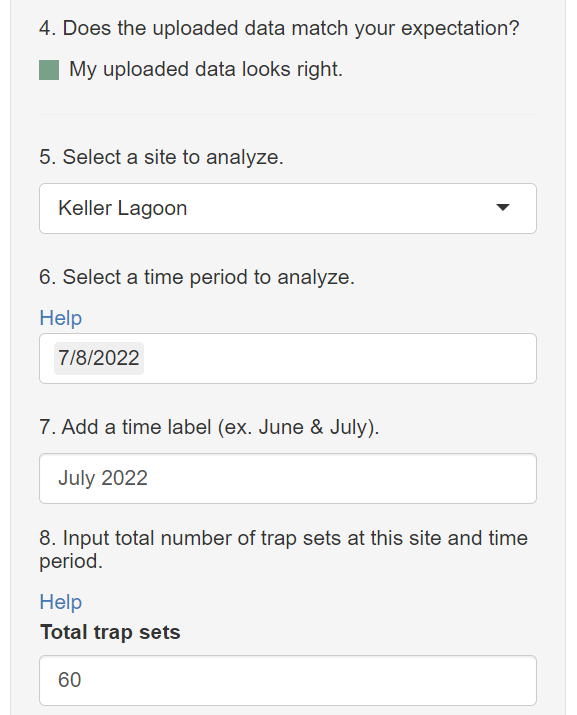
Let’s begin with Keller Lagoon and aggregate data from 7/4/2021 and 7/8/2021 to be analyzed together. Sixty total traps were set at all sites and time periods in this example.
Fill in the remaining inputs for this site and time period.
This tool actually runs the model on your data. Click Run Model when all inputs have been added!
4.2.3 Interpreting the plot
Interpret the text and plot to identify the most likely true capture rate based on your trapping results.
Note: The model uses Markov chain Monte Carlo to estimate the true capture rate. This means that your results may differ slightly than the results displayed here and could change slightly if you run the model multiple times on the same data.
4.2.4 Creating summary tables
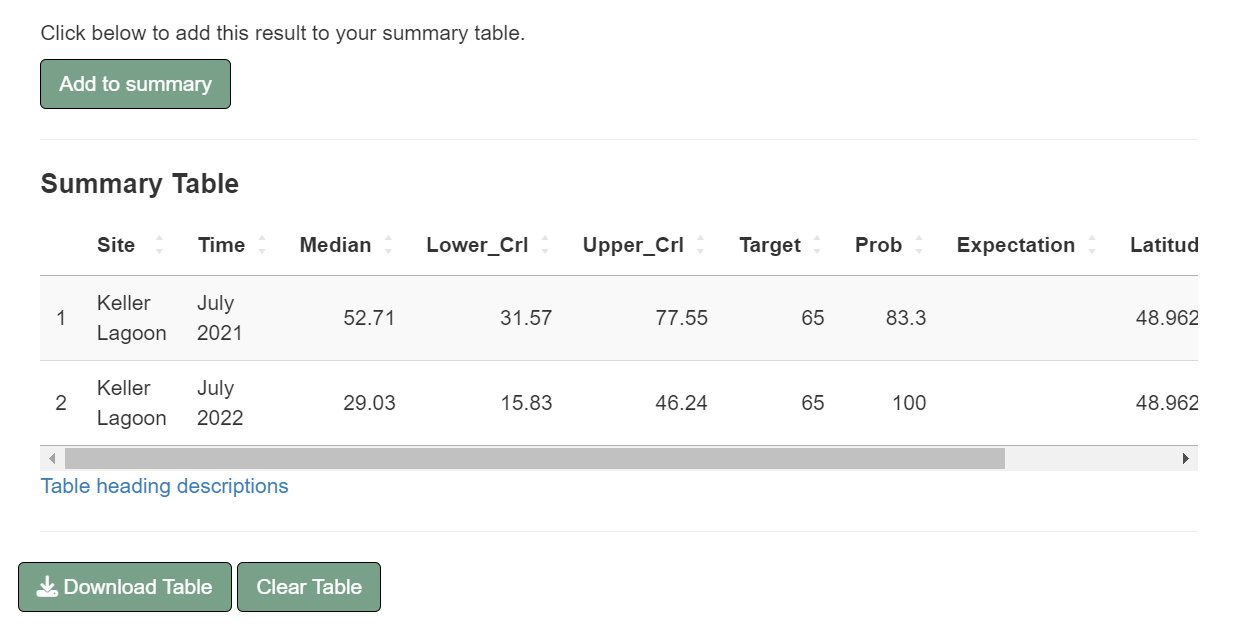
Add your results to a summary table by clicking the Add to summary button.
This action will populate the summary table. Refer to the table heading descriptions hyperlink for a description of each column in the table. To summarize, the Median column refers to the most likely true capture rate, the Lower_CrI column refers to the lower bound of the 95% credibility interval for the true capture rate, and the Upper_CrI column refers to the upper bound of the 95% credibility interval for the true capture rate. There should be one row in the summary table for each site and time period.
At any point, you can download the summary table to save the table as an .xlsx file. This file will contain a README tab that describes the table column headings. You can also clear the table to remove the rows.
4.2.5 Iterate through sites and time periods
Now we will cycle through all sites and time periods to estimate the true capture rate.
Next, we will keep the site as Keller Lagoon, but now choose capture dates from July 2022.
Let’s keep the same remaining inputs (numbers 9 and 10) and click “Run Model”.
The plot now displays results for Keller Lagoon in July 2022.
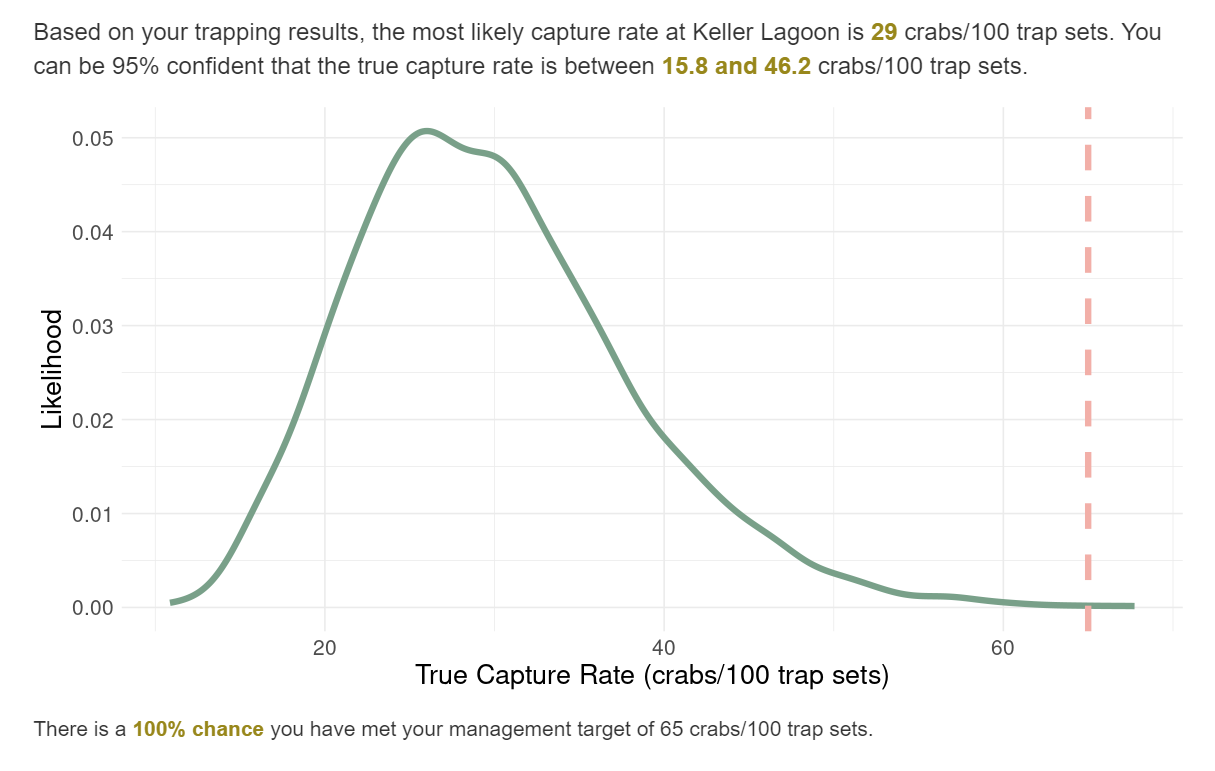
You can see that the most likely true capture rate at Keller Lagoon has decreased since July 2021. There is now a 100% chance that the management target of 65 crabs/100 trap sets has been achieved.
Now add this result to the summary table.
Cycle through the other sites (Keller Bay and Keller River) at all time periods (July 2021 and July 2022) and add to the summary table.
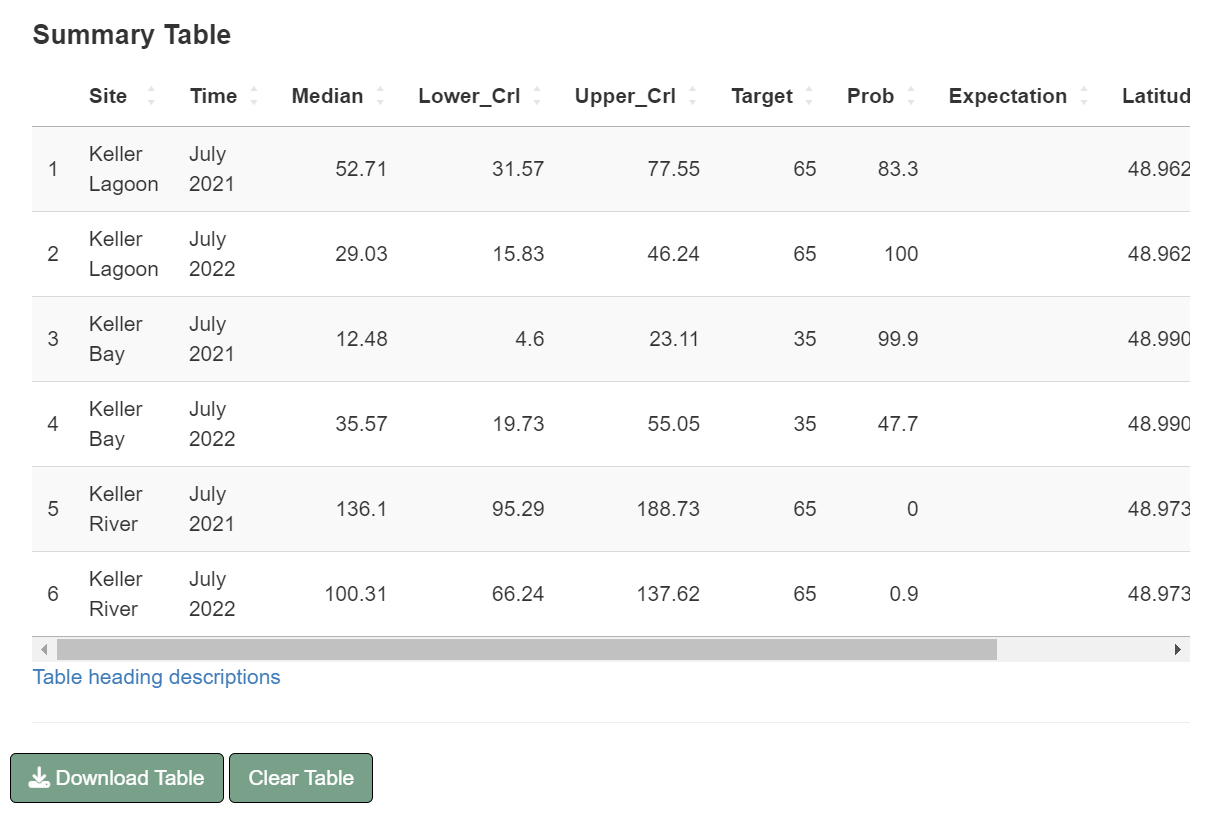
You can see that the most likely true capture rate decreased at Keller Lagoon, increased at Keller Bay, and remained somewhat stable at Keller River between July 2021 and July 2022.
4.2.6 Visualizing results on a map
If your uploaded data contained the latitude and longitude of your crab captures, you can visualize your summary results on a map.
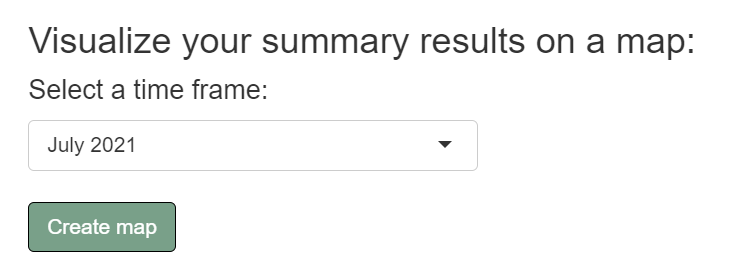
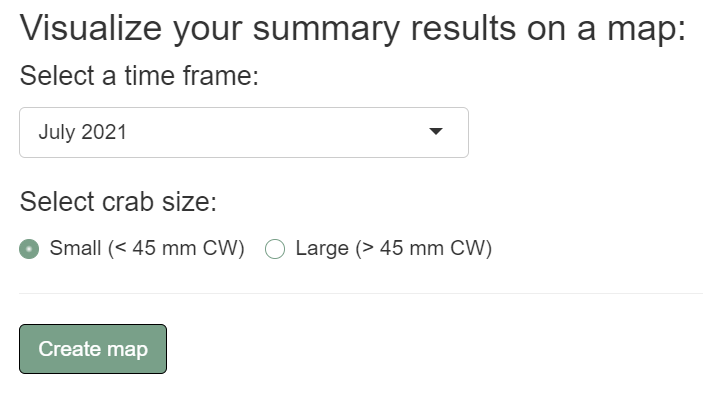
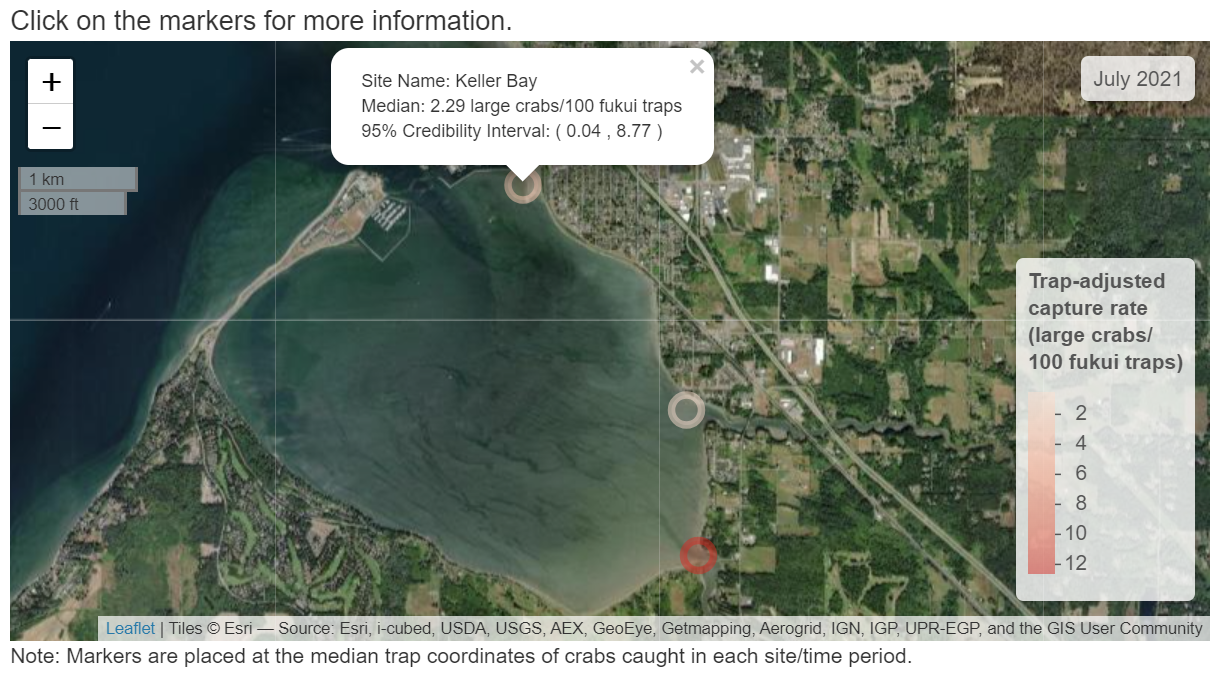
Select the time period you would like to visualize, and create the map by clicking “Create map”.
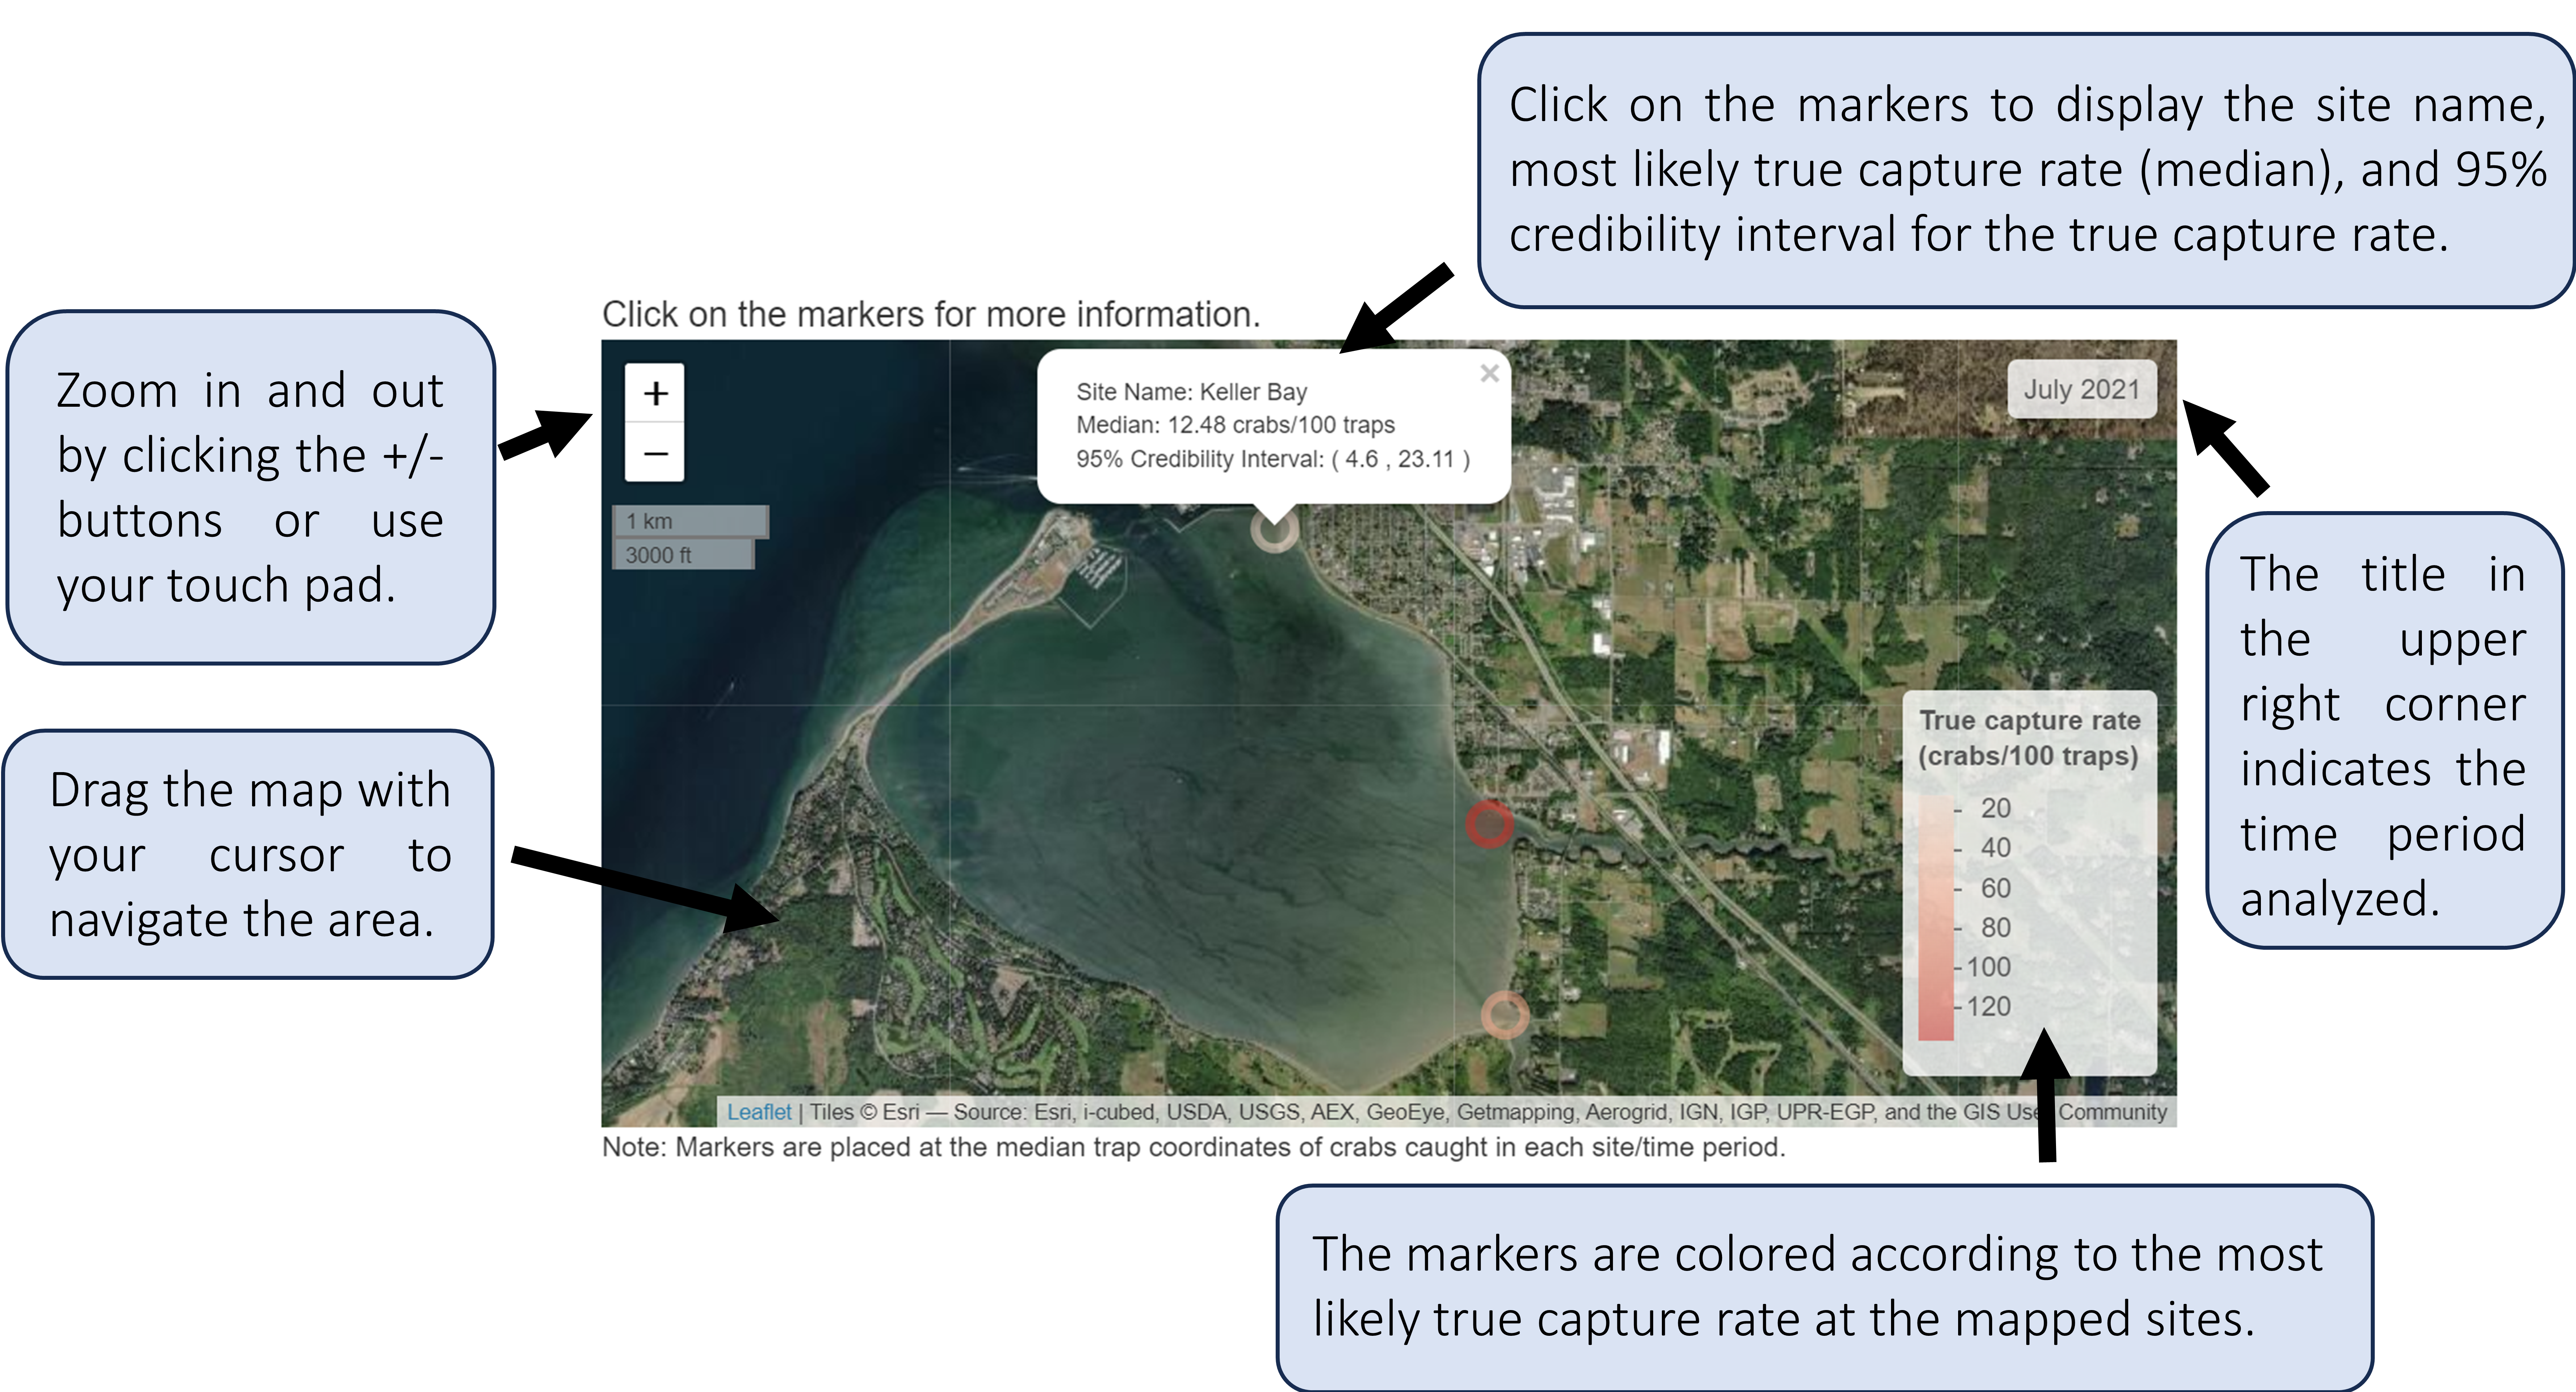
The map will display how estimates of the true capture rate vary across space. The markers will be placed at the median trap coordinates of crabs caught in each site/time period.
Note: these are simulated data from real locations that do not reflect the true capture rates in these areas.
Now switch the input to July 2022 to see how these results change over time.
4.3 Estimate trap-adjusted capture rate
This tool estimates the trap-adjusted capture rate by adjusting trap observations based on the trap type. The types of traps used in this section are:
Square fukui fish traps (1.27 cm mesh)
Modified steel minnow traps (2 inch opening, 0.635 cm mesh)
Non-collapsible shrimp traps (1 inch mesh)
If the type of trap you use is not listed here, choose the trap above that functions most similarly to your trap, or contact us at crabteam@uw.edu if you have further questions. Note that one trap set refers to a soak window with one overnight tide (typically a ~16-18 hr time period).
Download example data to follow along with this tutorial. These data are from three sites and two time periods. In 2021, minnow and fukui traps were used, and in 2022, minnow, fukui, and shrimp traps were used. At each site and time period, 60 total traps were set.
Navigate to Assessment Interpretation > Estimate true capture rate. In these sections, we will focus on only trapping efforts.
4.3.1 Uploading data
Select traps and trap-adjusted capture rate.
Ensure your uploaded data (.csv file) have the following requirements:
Include one row for each crab capture.
Must include columns labeled Crab_ID, Site_Name, Capture_Date, Trap_ID, Trap_Type, and CW_mm.
Optionally include columns labeled Latitude and Longitude to identify the locations of trapped crabs. This will be used if you want to visualize your results on a map.
Only include fukui, shrimp, and large-mouth minnow trap types. The following labels can be used:
- Minnow traps: Minnow, minnow, M, or m
- Fukui traps: Fukui, fukui, F, or f
- Shrimp traps: Shrimp, shrimp, S, or s
Data can include extra columns, but the data cannot have missing values in the Site_Name, Trap_ID, Capture_Date, and CW_mm fields.
Trap_ID can be any unique identifier for a trap set.
Upload your data and look through the data check to ensure your data has been uploaded into the app as expected. The most likely culprit for errors is mislabeled columns. Contact us at crabteam@uw.edu if you are having trouble.
If you are satisfied with how your data has been uploaded, check the My uploaded data looks right checkbox.
4.3.2 Inputs
Cycle through each site and time period you plan to interpret.
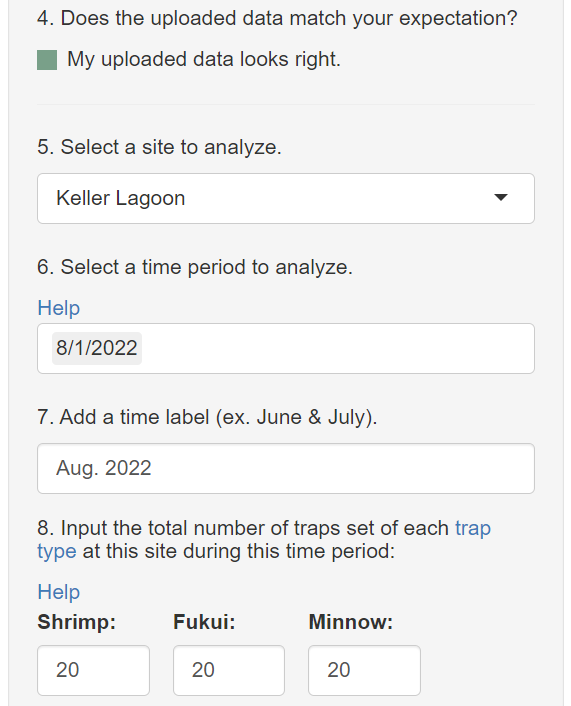
Let’s begin with Keller Lagoon and data from July 2021. In 2021, the 60 total traps at each site and time period included equal numbers of fukui and minnow traps.
Fill in the remaining inputs for this site and time period.
This tool actually runs the model on your data. Click Run Model when all inputs have been added!
4.3.3 Interpreting the plot
Interpret the text and plot to identify the most likely trap-adjusted capture rate based on your trapping results.
Note: The model uses Markov chain Monte Carlo to estimate the trap-adjusted capture rate. This means that your results may differ slightly than the results displayed here and could change slightly if you run the model multiple times on the same data.
4.3.4 Creating summary tables
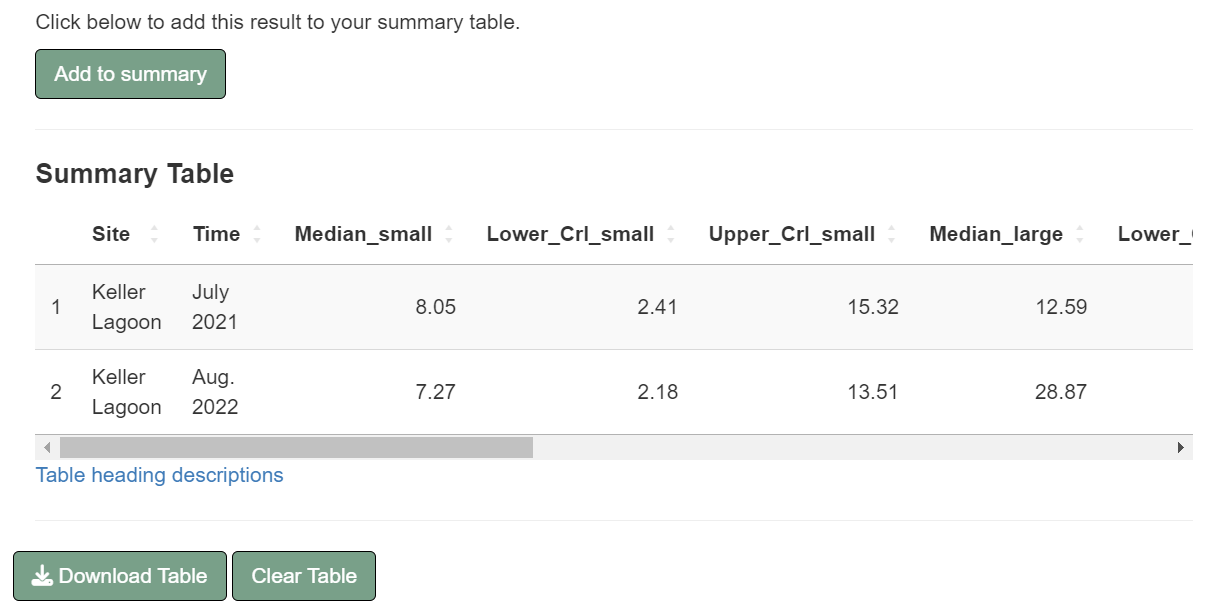
Add your results to a summary table by clicking the Add to summary button.
This action will populate the summary table. Refer to the table heading descriptions hyperlink for a description of each column in the table. To summarize, the Median_small column refers to the most likely trap-adjusted capture rate of small crabs, the Median_large column refers to the most likely trap-adjusted capture rate of large crabs, the Lower_CrI_small column refers to the lower bound of the 95% credibility interval for the trap-adjusted capture rate of small crabs, and the Upper_CrI_Small column refers to the upper bound of the 95% credibility interval for the trap-adjusted capture rate of large crabs. There should be one row in the summary table for each site and time period.
At any point, you can download the summary table to save the table as an .xlsx file. This file will contain a README tab that describes the table column headings. You can also clear the table to remove the rows.
4.3.5 Iterate through sites and time periods
Now we will cycle through all sites and time periods to estimate the trap-adjusted capture rate.
Next, we will keep the site as Keller Lagoon, but now choose capture dates from August 2022. In 2022, the 60 total traps at each site and time period included equal numbers of fukui, minnow, and shrimp traps.
Let’s keep the same remaining inputs (numbers 9 and 10) and click “Run Model”.
The plot now displays results for Keller Lagoon in August 2022.
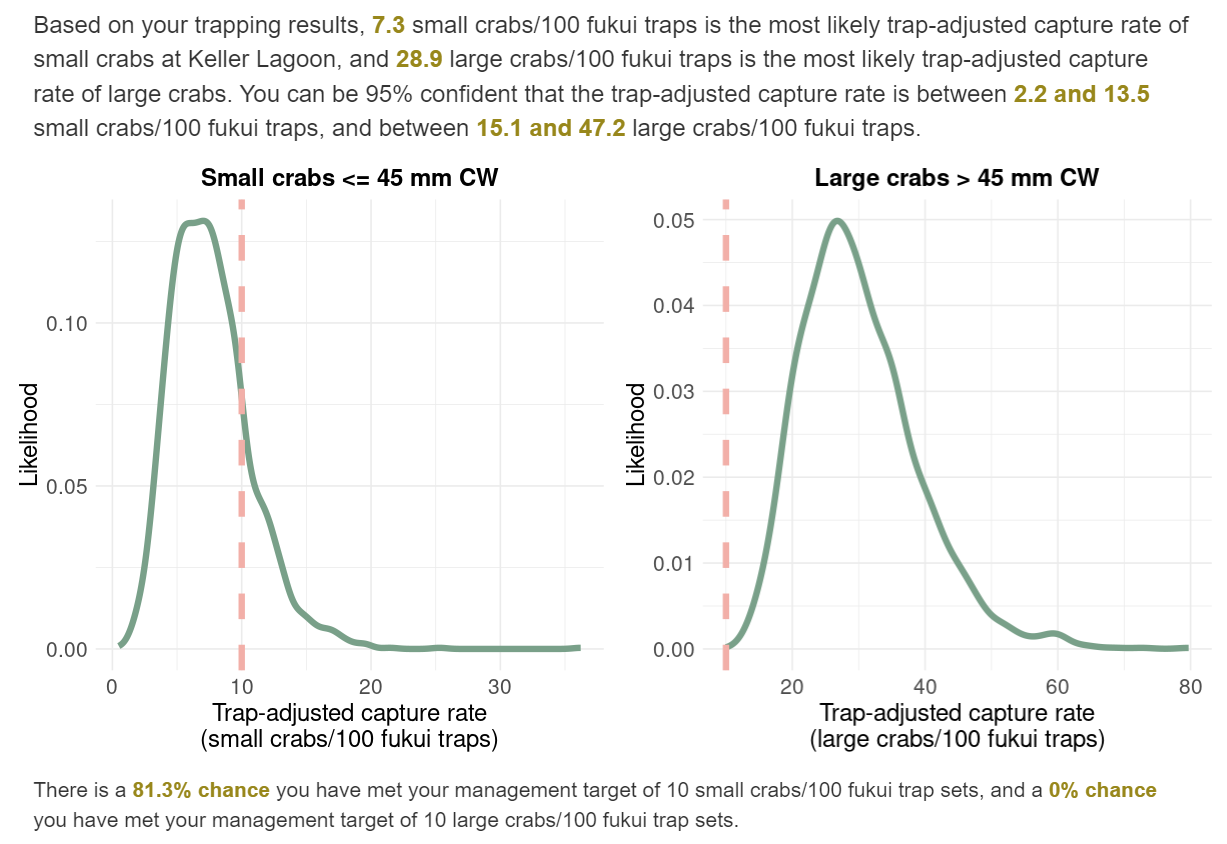
You can see that the most likely trap-adjusted capture rate of large crabs at Keller Lagoon has increased since July 2021. There is now a 0% chance that the management target of 10 large crabs/100 fukui trap sets has been achieved.
Now add this result to the summary table.
Cycle through the other sites (Keller Bay and Keller River) at all time periods (July 2021 and August 2022) and add to the summary table.
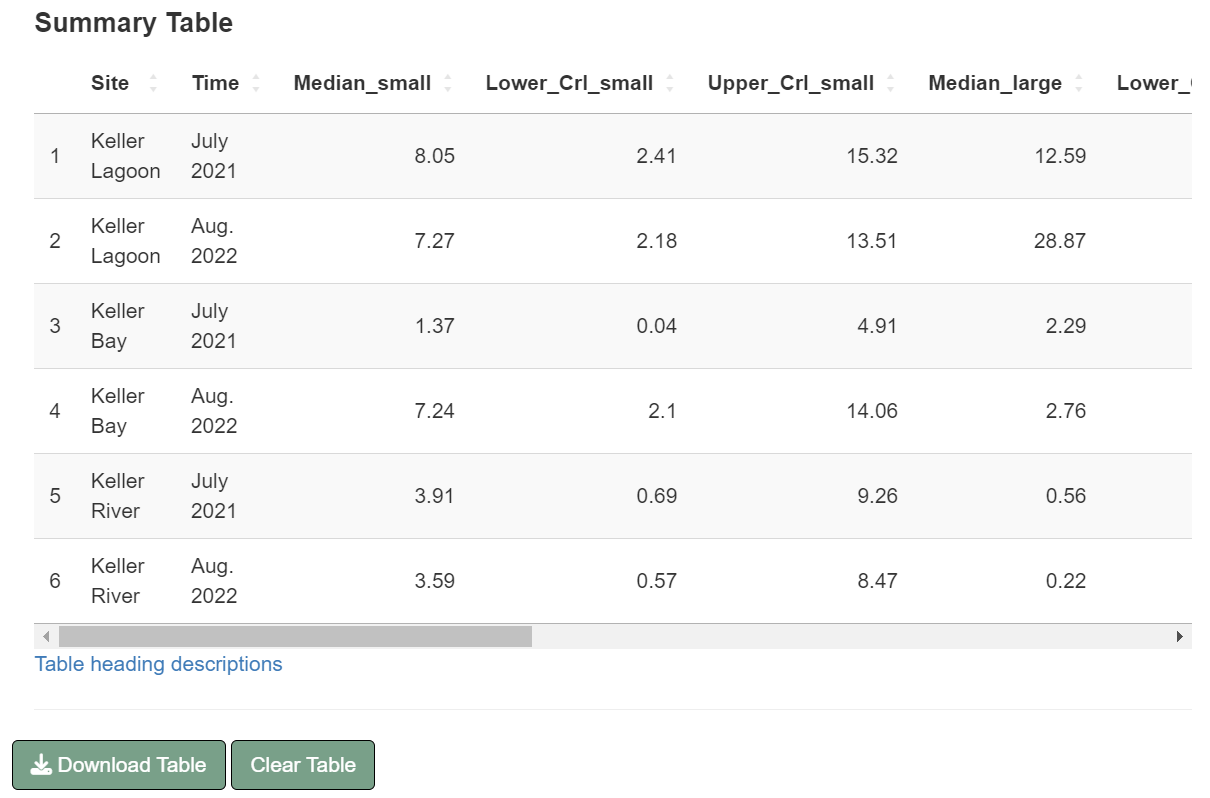
You can see that the most likely trap-adjusted capture rate of large crabs increased at Keller Lagoon, while the most likely trap-adjusted capture rate of small crabs remained stable at Keller Lagoon between July 2021 and August 2022.
Meanwhile, both the most likely trap-adjusted capture rates of large and small crabs at Keller River remained stable between July 2021 and August 2022.
4.3.6 Visualizing results on a map
If your uploaded data contained the latitude and longitude of your crab captures, you can visualize your summary results on a map.
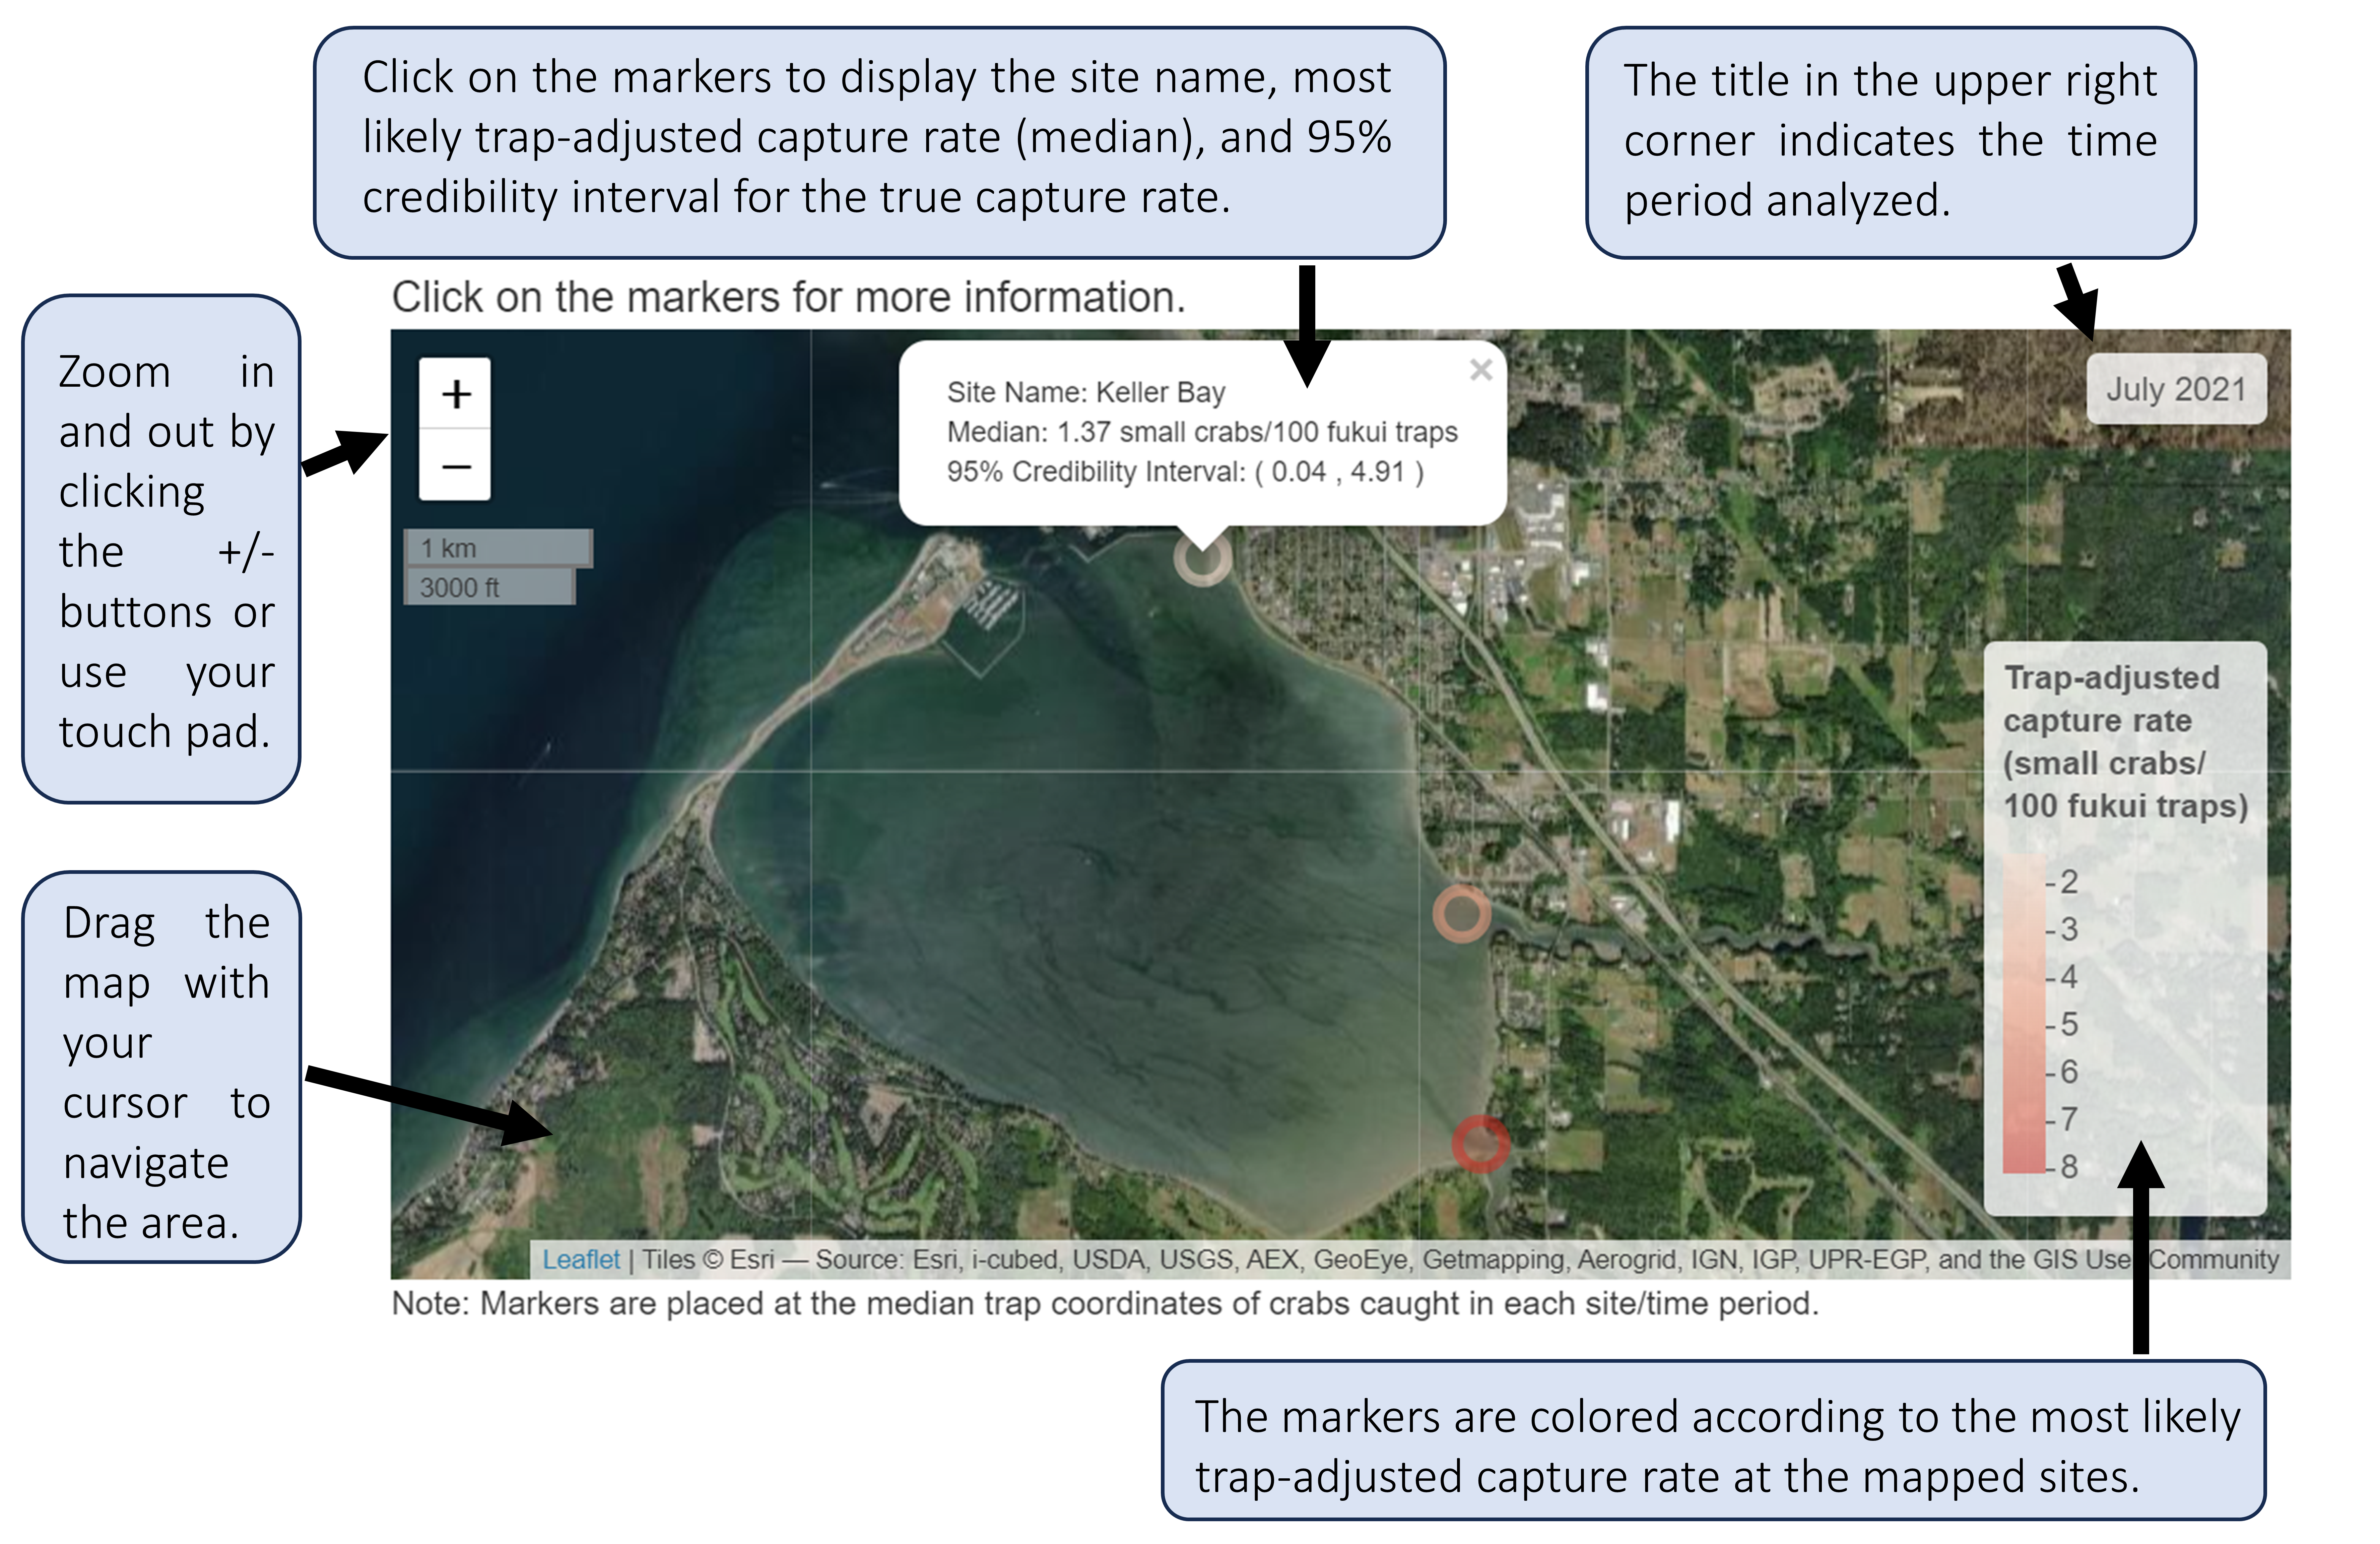
Select the time period and crab size you would like to visualize, and create the map by clicking “Create map”.
The map will display how estimates of the trap-adjusted capture rate vary across space. The markers will be placed at the median trap coordinates of crabs caught in each site/time period.
Note: these are simulated data from real locations that do not reflect the trap-adjusted capture rates in these areas.
Now toggle to the large crabs and create the map.
Now switch the input to August 2022 to see how these results change over time.
4.4 Environmental DNA (eDNA)
This section of the web app is sensitive to eDNA data collection methods. The model underlying this tool was built using eDNA data collected following the protocol in Keller et al. 2022. Water samples collected for eDNA analysis using different protocols may make inference using this web tool less applicable.
The sensitivity of eDNA detection relative to trapping likely depends upon the field collection protocols (i.e. water volume, collection depth) and laboratory protocols (i.e. DNA extraction and purification methods).
Seasonality may also play a role in eDNA sensitivity. Season-specific factors like green crab activity, movement, and molting cycles can affect the rate at which organisms shed eDNA. Also, the presence and density of organic matter in the water may vary seasonally and affect eDNA extraction and PCR inhibition.
However, this tool can be useful if your eDNA protocols are similar those outlined in Keller et al. or if you want to explore how the sensitivity of eDNA samples could potentially compare to trapping.
Download example trap data and example eDNA data to follow along with this tutorial. These data represent crab captures and eDNA qPCR results from a site where minnow and fukui traps were used and eDNA samples were collected. At this site, 60 total traps were set and six eDNA samples were collected.
In this tool, we will jointly estimate the true capture rate with the both eDNA and trap data as inputs.
Navigate to Assessment Interpretation > Estimate true capture rate.
4.4.1 Uploading data
Select traps and eDNA.
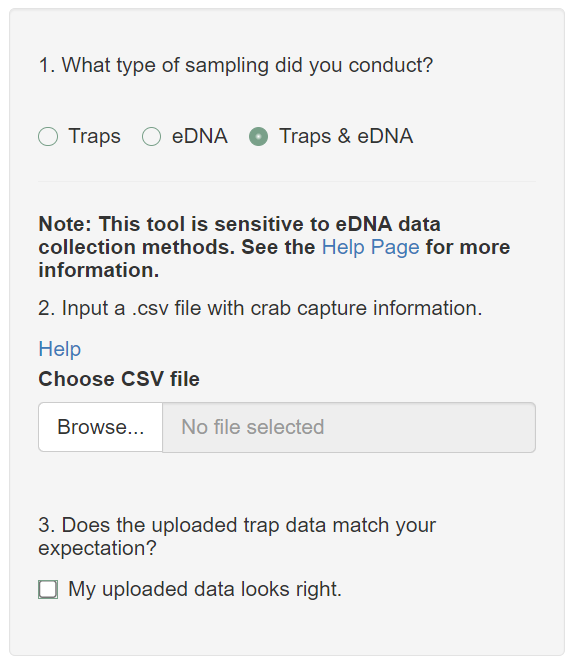
First, upload the trap data. While this example data only includes trapping results from one site and one time period, you can upload data from multiple sites and time periods and analyze them one at a time.
Ensure your uploaded data (.csv file) have the following requirements:
Include one row for each crab capture.
Must include columns labeled Crab_ID, Site_Name, Capture_Date, Trap_ID, and Trap_Type.
Optionally include columns labeled Latitude and Longitude to identify the locations of trapped crabs. This will be used if you want to visualize your results on a map.
Only include fukui, shrimp, and large-mouth minnow trap types. The following labels can be used:
- Minnow traps: Minnow, minnow, M, or m
- Fukui traps: Fukui, fukui, F, or f
- Shrimp traps: Shrimp, shrimp, S, or s
Data can include extra columns, but the data cannot have missing values in the Site_Name, Trap_ID, and Capture_Date fields.
Trap_ID can be any unique identifier for a trap set.
Upload your data and look through the data check to ensure your data has been uploaded into the app as expected. The most likely culprit for errors is mislabeled columns. Contact us at crabteam@uw.edu if you are having trouble.
If you are satisfied with how your data has been uploaded, check the My uploaded data looks right checkbox.
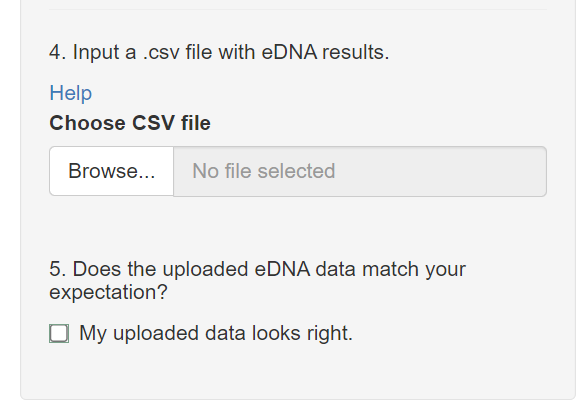
Next, upload the eDNA data. While this example data only includes trapping results from one site and one time period, you can upload data from multiple sites and time periods and analyze them one at a time.
Ensure your uploaded data (.csv file) have the following requirements:
Include one row for each water sample/biological replicate.
Must include columns labeled Date, Biological_Replicate, Site_Name, N, and Detections.
- N is the total number of qPCR replicates per water sample
- Detections is the total number of positive amplifications per water sample
Must have no missing value in any fields.
If you are satisfied with how your data has been uploaded, check the My uploaded data looks right checkbox.
4.4.2 Inputs
Cycle through each site and time period you plan to interpret.
In this example, there is only one site and time period, so let’s select Keller Lagoon and the data from 9/4/2021. Sixty total traps were set at all sites and time periods in this example.
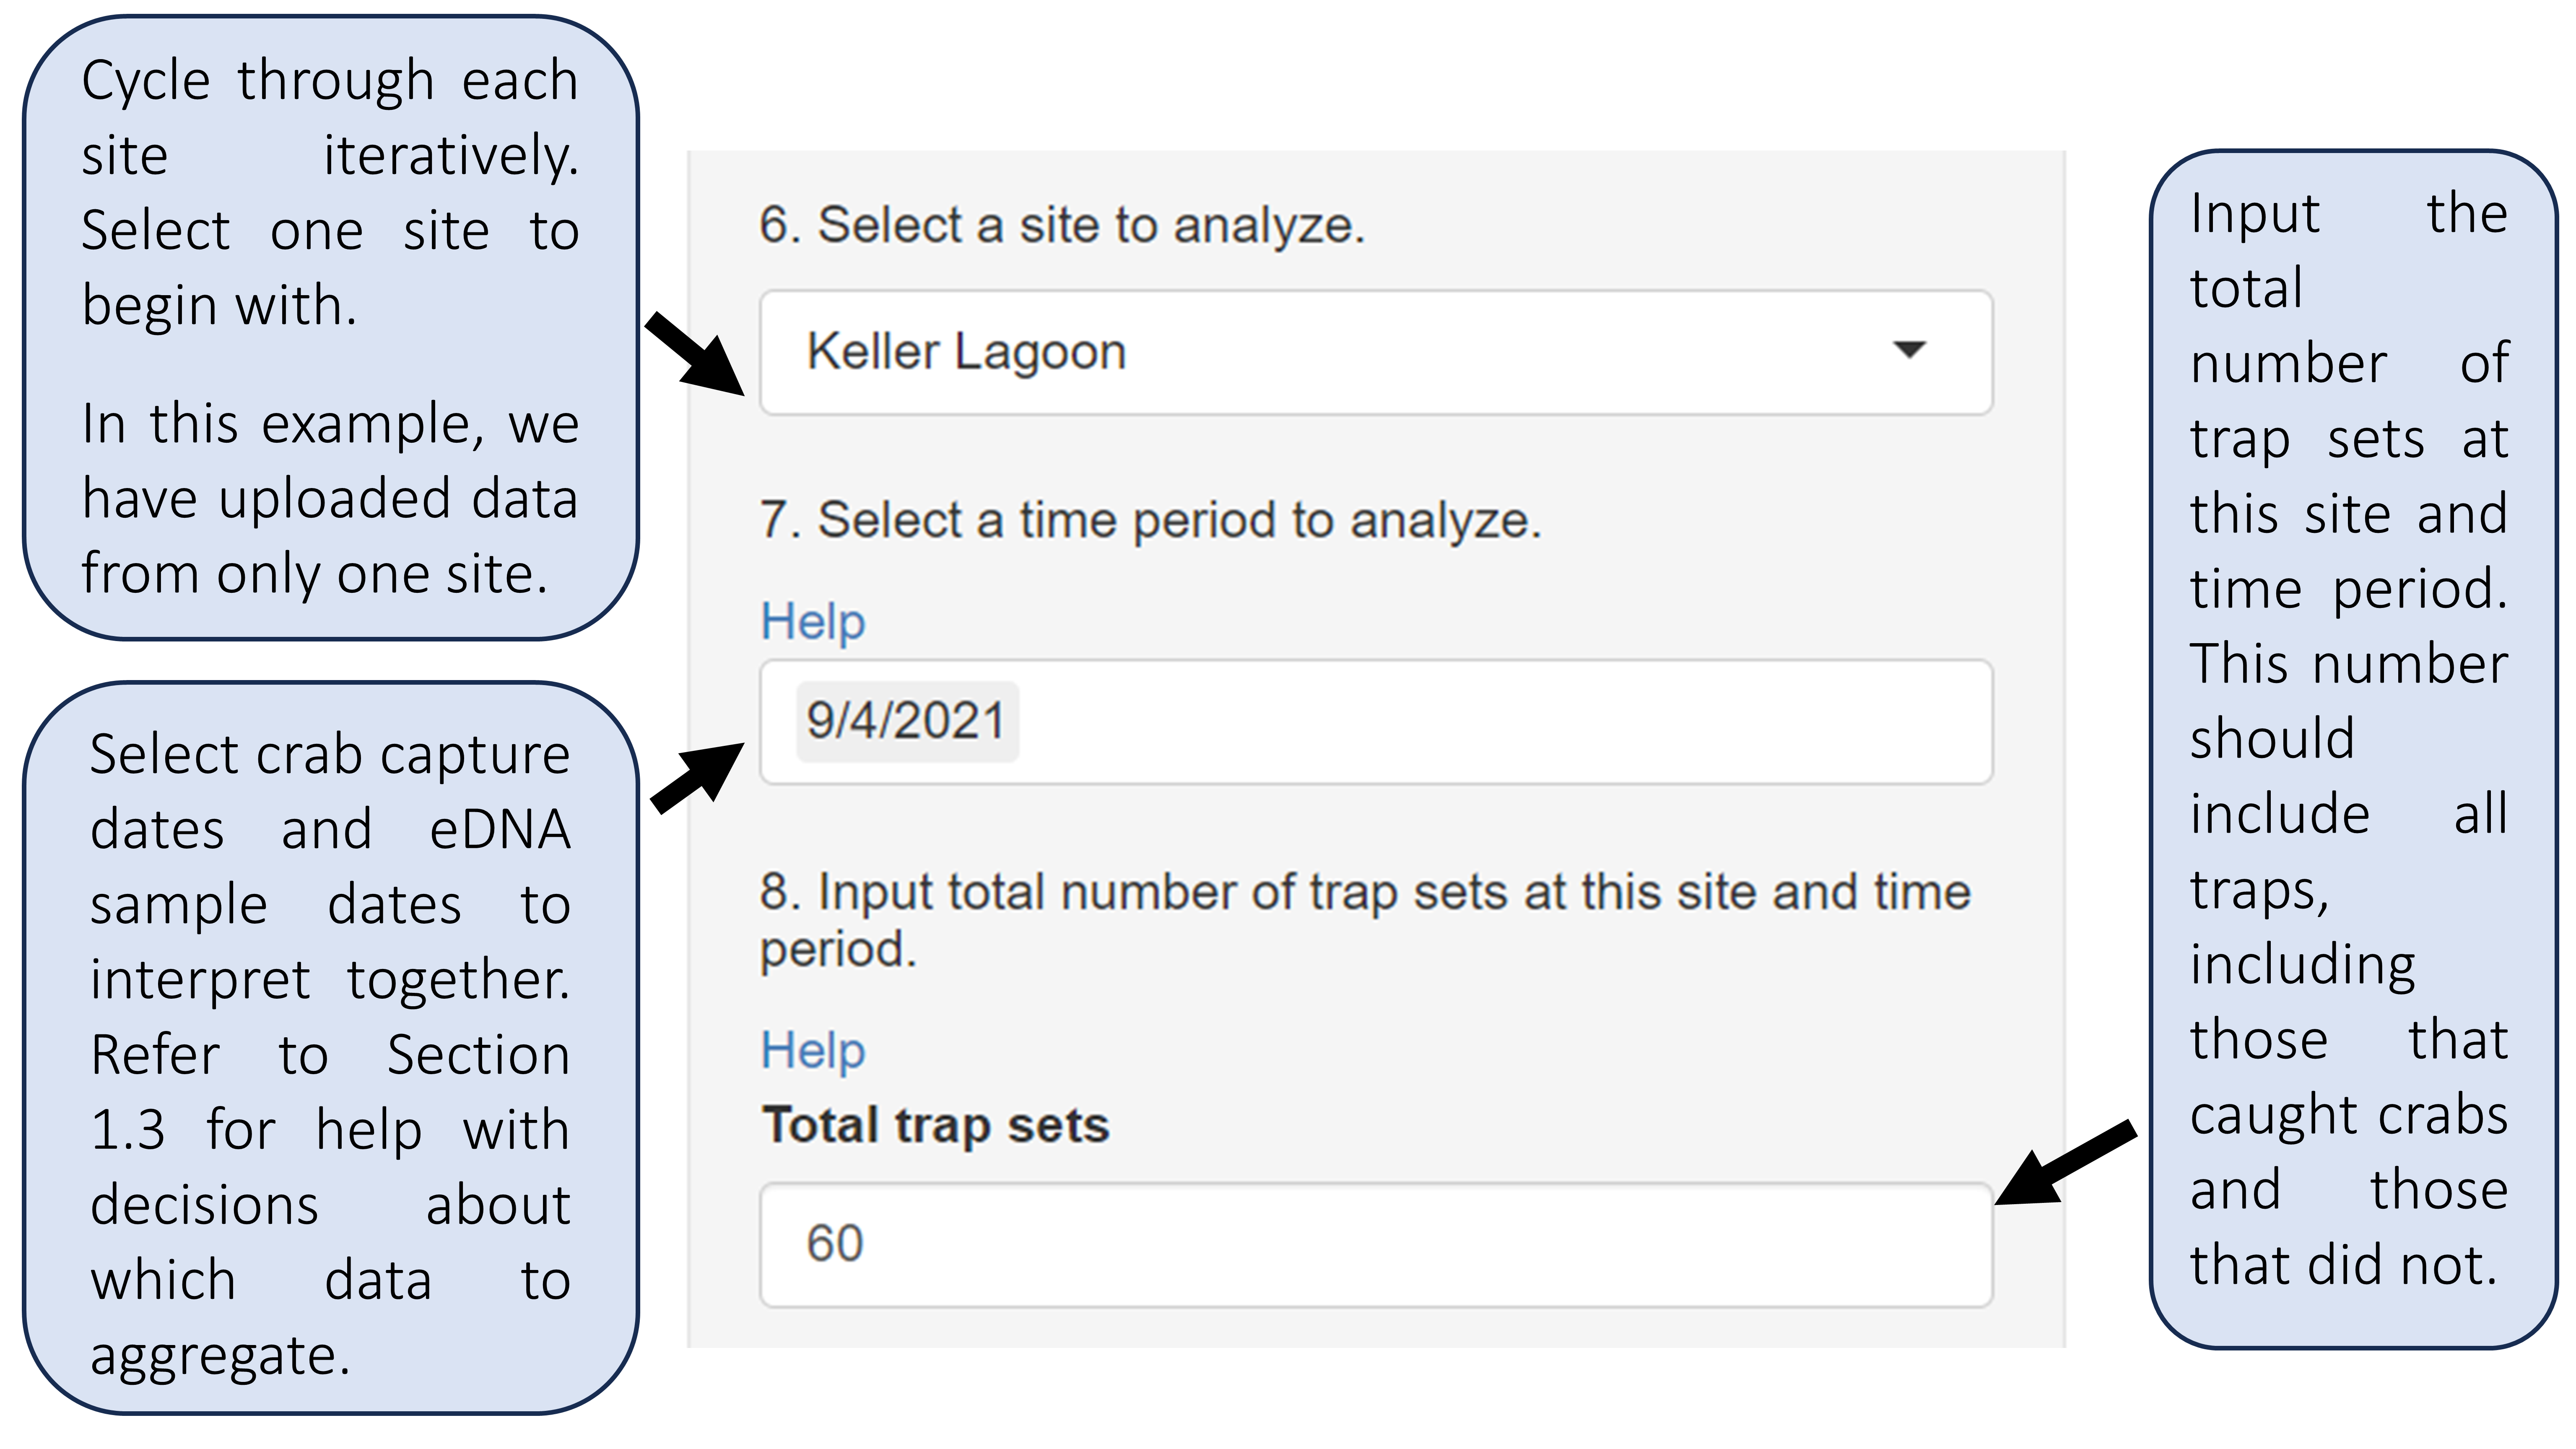
Fill in the remaining inputs for this site and time period.
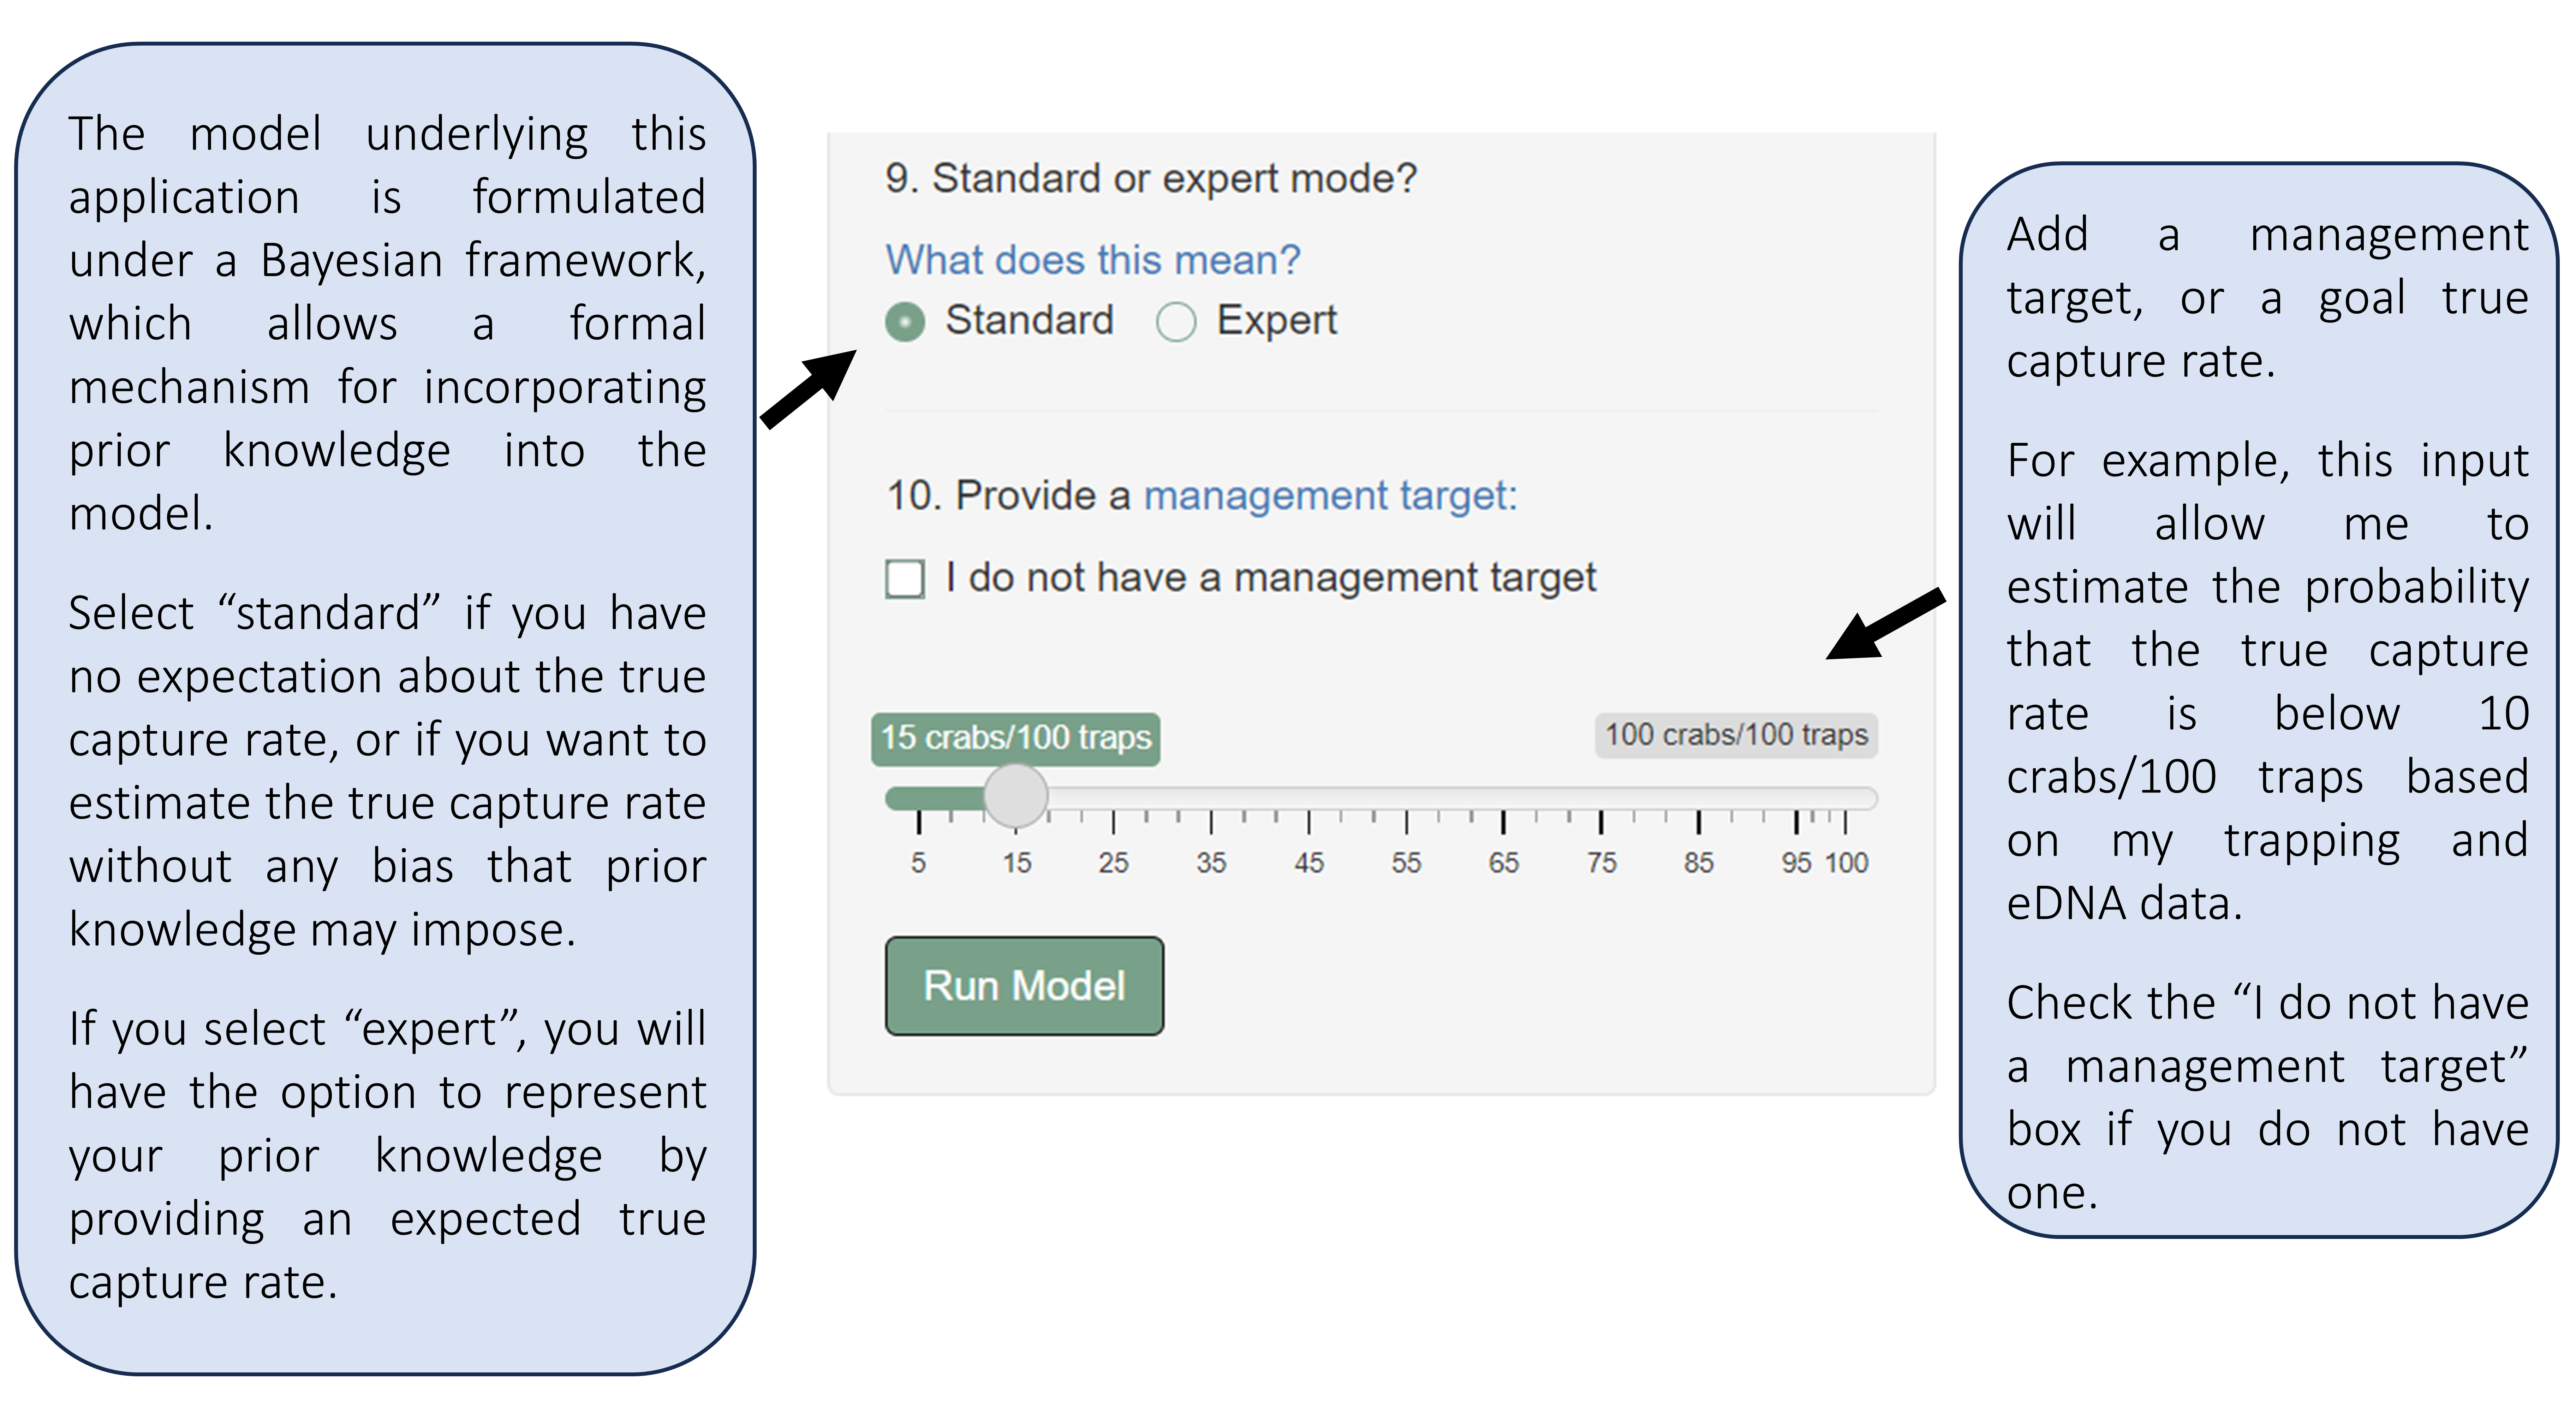
This tool actually runs the model on your data. Click Run Model when all inputs have been added!
4.4.3 Interpreting the plot
Interpret the text and plot to identify the most likely true capture rate based on your trapping and eDNA results.
Note: The model uses Markov chain Monte Carlo to estimate the true capture rate. This means that your results may differ slightly than the results displayed here and could change slightly if you run the model multiple times on the same data.