Chapter 3 Results
3.0.1 Table 1: Negative Binomial Regression Results
| Bufflehead | Redhead | Scaup | Total Sum | |||||
|---|---|---|---|---|---|---|---|---|
| Predictors | IRR(95% CI) | p-value | IRR(95% CI) | p-value | IRR(95% CI) | p-value | IRR(95% CI) | p-value |
| Average Temperature | 0.90 (0.81, 0.99) | 0.031 | 0.79 (0.63, 1.00) | 0.048 | 0.81 (0.70, 0.93) | 0.002 | 0.84 (0.74, 0.96) | 0.009 |
| Disturbances | 1.05 (0.97, 1.13) | 0.245 | 1.04 (0.93, 1.18) | 0.479 | 1.06 (0.96, 1.18) | 0.247 | 1.05 (0.97, 1.14) | 0.236 |
| Perdido Key vs Santa Rosa | 0.18 (0.08, 0.42) | < 0.001 | 0.34 (0.07, 1.57) | 0.166 | 0.18 (0.04, 0.86) | 0.031 | 0.25 (0.09, 0.67) | 0.006 |
3.0.2 Table 2: Multiple Variable Regression Results
| Bufflehead | Redhead | Scaup | Total Sum | |||||
|---|---|---|---|---|---|---|---|---|
| Predictors | IRR(95% CI) | p-value | IRR(95% CI) | p-value | IRR(95% CI) | p-value | IRR(95% CI) | p-value |
| Average Temperature | 0.88 (0.82, 0.95) | 0.001 | 0.77 (0.64, 0.93) | 0.006 | 0.84 (0.73, 0.96) | 0.012 | 0.84 (0.76, 0.93) | 0.001 |
| Perdido Key vs Santa Rosa | 0.13 (0.06, 0.28) | <0.001 | 0.15 (0.03, 0.67) | 0.013 | 0.14 (0.03, 0.72) | 0.019 | 0.15 (0.06, 0.36) | <0.001 |
| Disturbances | 1.14 (1.03, 1.26) | 0.011 | 1.08 (0.84, 1.38) | 0.548 | 1.16 (0.94, 1.44) | 0.157 | 1.13 (1.00, 1.29) | 0.048 |
| Survey Date | 1.00 (1.00, 1.00) | 0.137 | 1.00 (1.00, 1.00) | 0.901 | 1.00 (1.00, 1.00) | 0.208 | 1.00 (1.00, 1.00) | 0.871 |
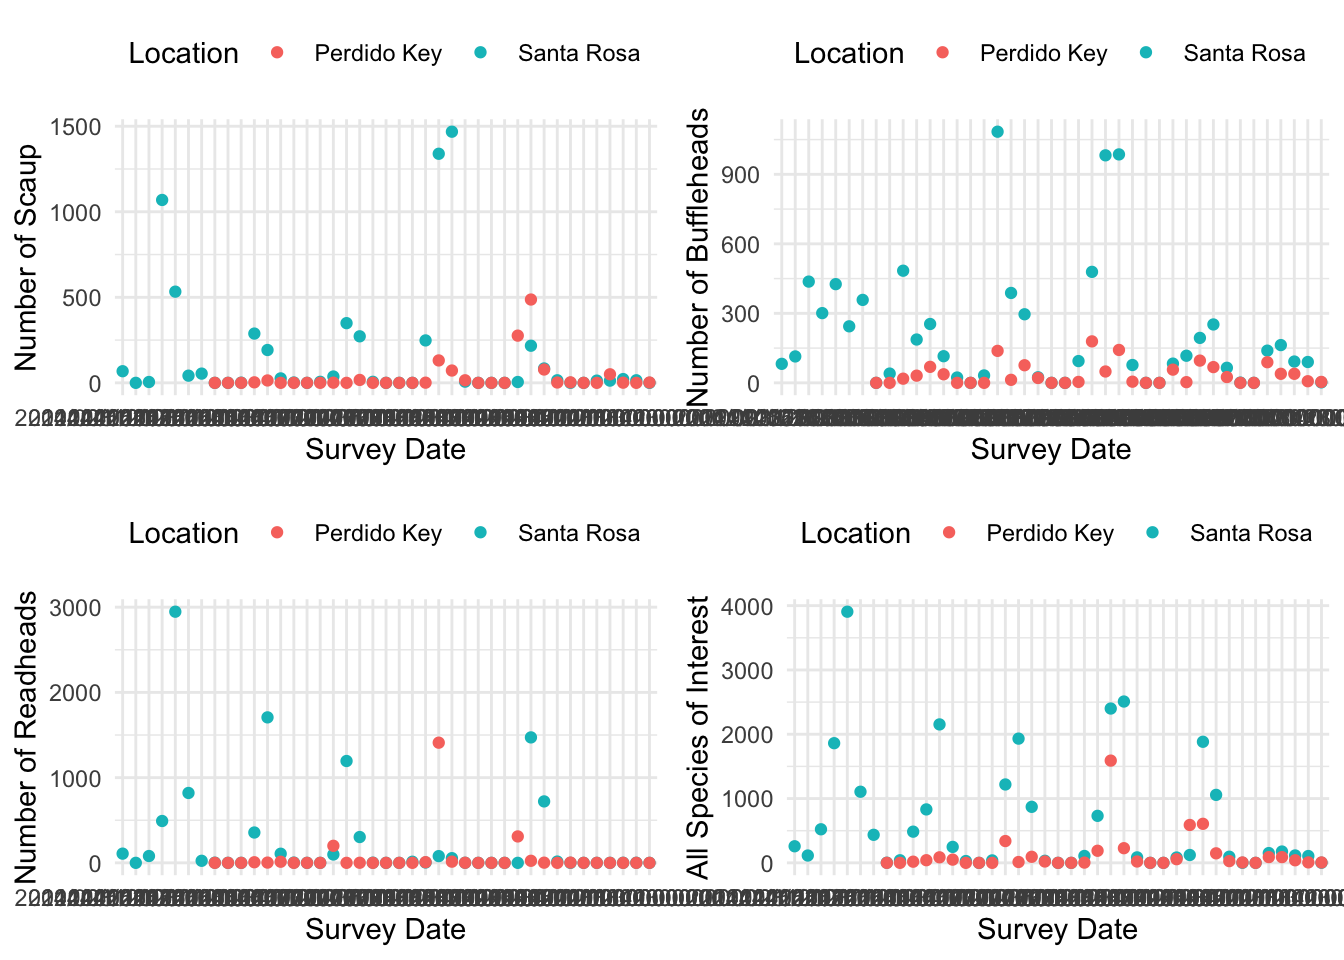
3.0.3 Figure 1: Longitudinal Graphs of Study Data
For the negative binomial regression, looking at table 1, average temperature proved to be significant for all four outcomes. There was 16% decrease for total waterfowl sum observed for each degree the temperature rises. Disturbances did not prove to be significant for any of the outcomes. Location did show significance with for the total bufflehead, scaup, and sum. There was a 75% decrease in total waterfowl in Perdido Key compared to Santa Rosa.
Now moving on to the multiple variable regression within table 2, average temperature is a significant predictor for all four of the outcomes. For the total sum of out species, there was a 16% decrease observed for each degree the temperature rises. Location was also significant for all four predictors with a 85% decrease in total waterfowl in Perdido Key compared to Santa Rosa. Disturbances proved to be a significant predictor for both total number of bufflehead and total sum. For every increase in disturbances, there was a 13% increase in the total sum of our species of interest. Lastly, survey date was seen to not be significant for any of the predictors.