4 Results
Figure 1 and Table 1 show that in the most recent decades (2001-2010; 2011-2017) intergenerational linkage rates were reasonable: 66-72%. This is perhaps what would be expected given the proportion of children born to parents who were also born in New Zealand. However, linkage rates drop away dramatically prior to 2001: approximately 45% for 1991-2000, 33% for 1981-90; 20% for 1971-1980, and 0.1% or less for decades prior to 1971.
As these linkage rates were so low prior to 2001, multi-generational linkage are likely to be limited. As such, we did not direct compute the answers to our two questions – (i) the number of generations able to be linked, and (ii) the total numbers at each generation – as we can give approximate answers from the linkage rates we did compute. These approximations indicate that the number of generations able to be linked back (ng) is = 1 for about 69% of cases for parents having children since 2001, and close to no cases for parents having children prior to 1970. Even assuming very short generations (20 years) and a random probability of being linked back to a previous generation, it is likely that ng =2 for ~30% of cases for parents having children since 2011 (i.e., 0.675*0.456 = 0.308 for parent1, and 0.666*0.445=0.296 for parent2), and ng = 3 for ~6% of cases (i.e., 0.675*0.456*0.189 = 0.058 for parent1, and 0.666*0.445*0.201=0.060 for parent2). Using similar methodology and assuming (more reasonably) generations=30 years, ng = 2 for ~22% of cases for parents having children since 2011, and ng = 3 for no cases. It is very unlikely there are any cases for ng = 4.
| Decade | N.of.child.IDs.in.parent1.dataset | N.of.individual.IDs.linked.as.parent1 | X..of.parent1.links | N.of.child.IDs.in.parent2.dataset | N.of.individual.IDs.linked.as.parent2 | X..of.parent2.links |
|---|---|---|---|---|---|---|
| Before 1881 | 240516 | 0 | 0.0 | 241854 | 0 | 0.0 |
| 1881-1890 | 191235 | 0 | 0.0 | 186216 | 0 | 0.0 |
| 1891-1900 | 187845 | 0 | 0.0 | 181533 | 0 | 0.0 |
| 1901-1910 | 240516 | 0 | 0.0 | 233115 | 0 | 0.0 |
| 1911-1920 | 294018 | 0 | 0.0 | 286746 | 6 | 0.0 |
| 1921-1930 | 308799 | 0 | 0.0 | 301974 | 6 | 0.0 |
| 1931-1940 | 308526 | 6 | 0.0 | 303039 | 0 | 0.0 |
| 1941-1950 | 441441 | 21 | 0.0 | 434925 | 15 | 0.0 |
| 1951-1960 | 573921 | 63 | 0.0 | 566562 | 60 | 0.0 |
| 1961-1970 | 634017 | 348 | 0.1 | 620706 | 393 | 0.1 |
| 1971-1980 | 572856 | 108201 | 18.9 | 549156 | 110115 | 20.1 |
| 1981-1990 | 544269 | 180216 | 33.1 | 512439 | 172662 | 33.7 |
| 1991-2000 | 585924 | 267330 | 45.6 | 548598 | 244002 | 44.5 |
| 2001-2010 | 611007 | 439497 | 71.9 | 576036 | 406338 | 70.5 |
| 2011-2017 | 360450 | 243228 | 67.5 | 343623 | 228810 | 66.6 |
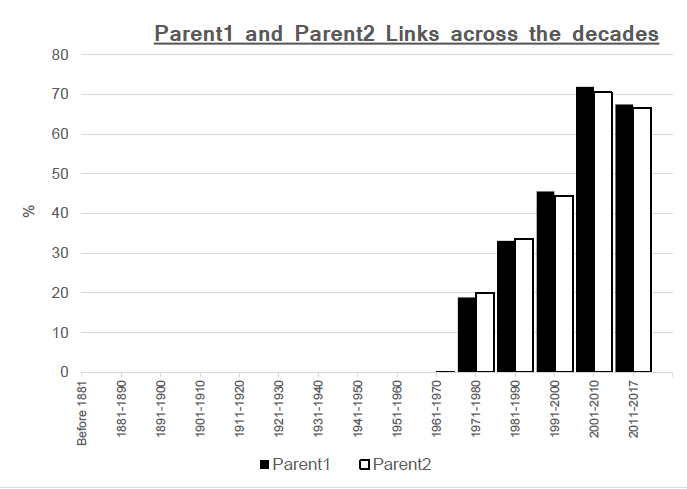
Figure 4.1: Comparison of the proportion of individuals to child links in eah decade from the IDI birth dataset.