Chapter 8 Exercise 3-2-c
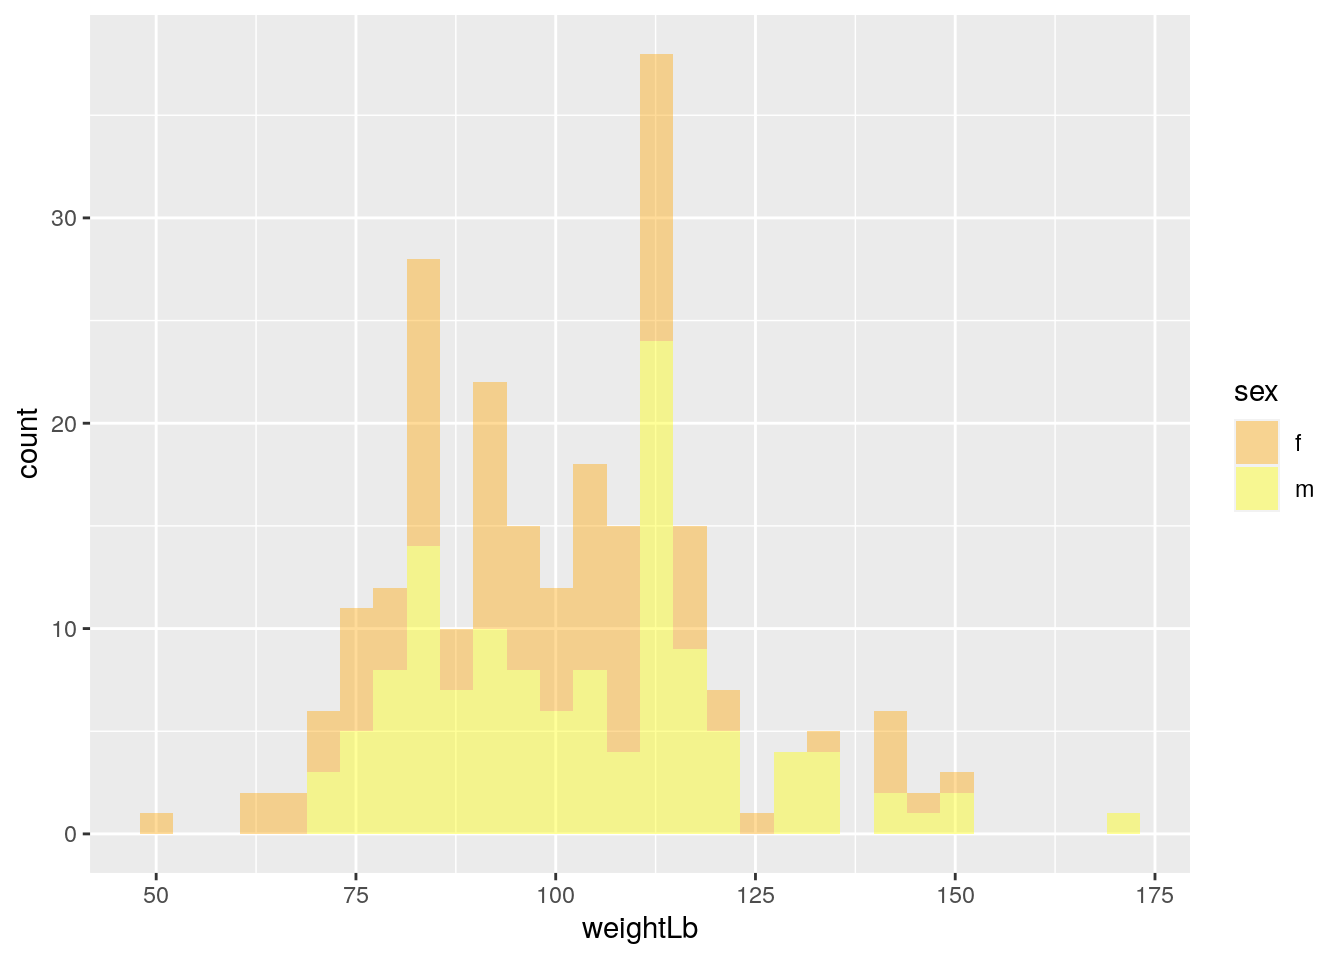
p2<-ggplot(heightweight,aes(x=weightLb,fill=sex))+geom_histogram()
p2+scale_color_manual(values=alpha(c("orange","yellow"),.4))+scale_fill_manual(values=alpha(c("orange","yellow"),.4))
## `stat_bin()` using `bins = 30`. Pick better value with `binwidth`.