Chapter 9 Exercise 3-2-d
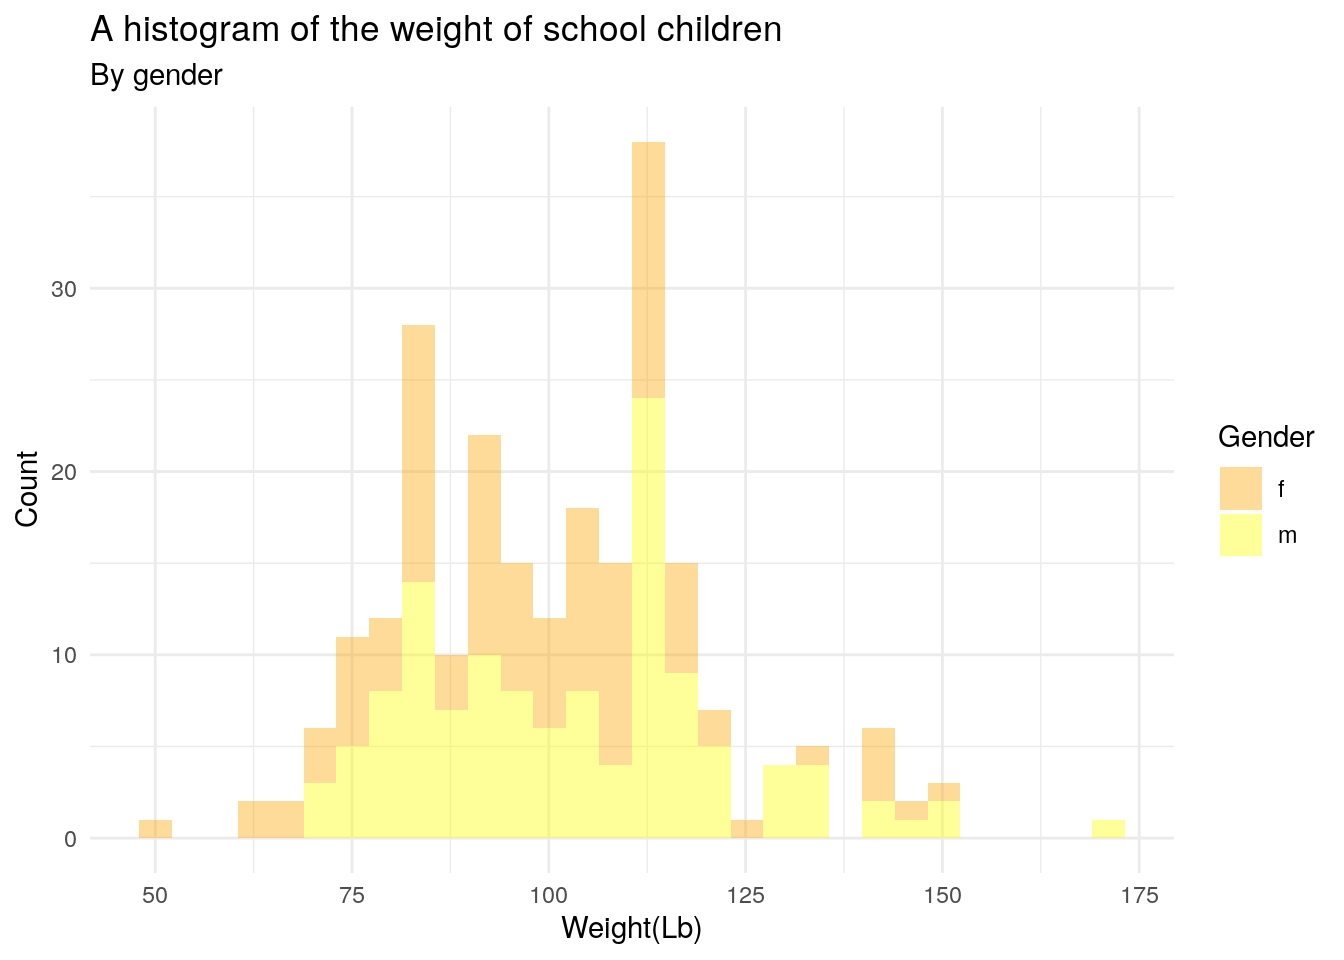
p2<-ggplot(heightweight,aes(x=weightLb,fill=sex))+geom_histogram()
p2+scale_color_manual(values=alpha(c("orange","yellow"),.4))+scale_fill_manual(values=alpha(c("orange","yellow"),.4))+labs(title="A histogram of the weight of school children",subtitle="By gender",x="Weight(Lb)",y="Count",fill="Gender")+theme_minimal()
## `stat_bin()` using `bins = 30`. Pick better value with `binwidth`.