Chapter 2 Introduction
2.1 Shiny Basic Skeleton
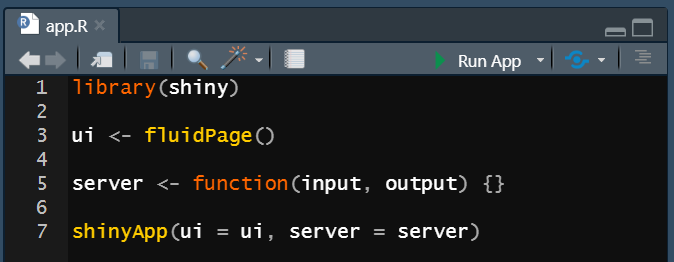
The most basic shiny app has this form:
library(shiny)

ui <- fluidPage()

server <- function(input, output) {}

shinyApp(ui = ui, server = server)
There are three main elements :
The ui (user interface) which encapsulates all the functions that structure the appearance of your app.
A server object which is really the heart of your applications. It contains the code that is necessary to display your UI contents.
Finally, the
shinyApp()function creates the Shiny application from the defined ui and server.
The code of a Shiny application can be contained in one R file which has to be called app.R or within two R files, one for the ui called ui.R and the other for the server called server.R. For the sake of simplicity, we’ll focus throughout this book on shiny apps written within one R file app.R.
2.1.1 Running a Shiny app
In order to preview your application, you can click on the triangle button next to Run App:
There is also a useful keyboard shortcut that I highly recommend: Ctrl + Shift + Enter on Windows or Command + Shift + Enter on Mac.
If you run the above shiny skeleton, R will render a blank page because our ui object is empty. Let us feed the beast !
2.2 Text elements within Shiny
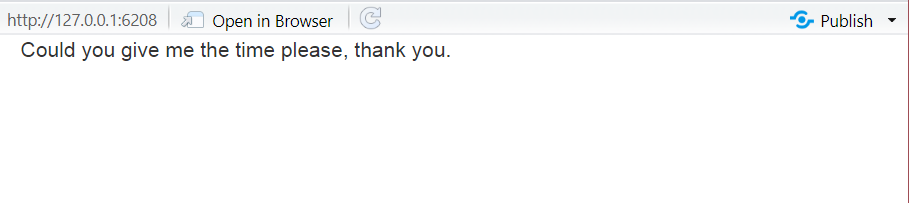
Let’s say we want to build a polite shiny app that asks us what time is it, politely:
library(shiny)

ui <- fluidPage("Could you give me the time please, thank you.")

server <- function(input, output) {}

shinyApp(ui = ui, server = server)
If you run the above code, R will render the following application:
 If you want to customize the text, Shiny allows you to work with HTML tags. A way to implement HTML tags is the Shiny
 tags$<name of the tag> function. Suppose that we want to create an impolite app that asks us in a strong manner.
library(shiny)

ui <- fluidPage(

tags$h1("Hey !"),
tags$h2("Sir !!!"),
tags$h3("Sir ! "),

tags$strong("What time is it ???")

)

server <- function(input, output) {}

shinyApp(ui = ui, server = server)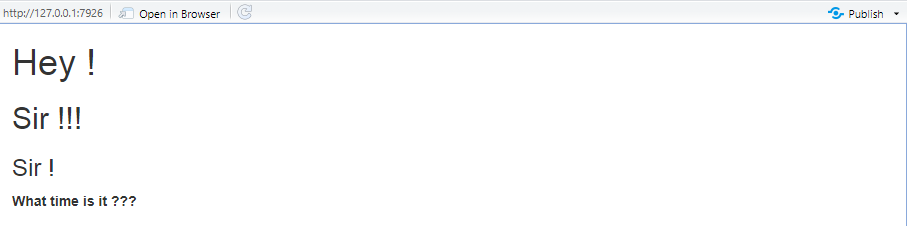
There are many other HTML tags that you can integrate within your app. For a complete list use : names(tags).
It’s also possible to customize the text color and style with CSS. There are many ways to do so but to keep it simple, let’s introduce some CSS commands within our shiny impolite app using the tags$style().
library(shiny)

ui <- fluidPage(


# our css part ###########################################

tags$style(

 "h1 {color: DarkRed; font-size : 200px;}

  h2 {color : red;}

  h3 {color : white;}

  strong {color : purple;}

  body{background-color : grey;}

 "
),

#########################################################


tags$h1("Hey !"),
tags$h2("Sir !!!"),
tags$h3("Sir ! "),

tags$strong("What time is it ???")

)

server <- function(input, output) {}

shinyApp(ui = ui, server = server)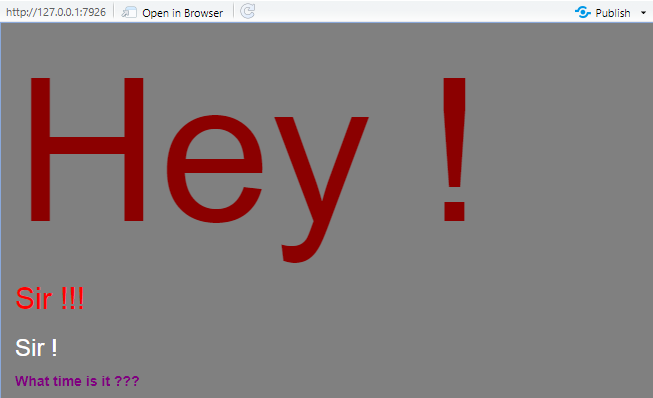
2.3 R code within Shiny
In the previous sections, we didn’t write any R function that is independent from the Shiny package. In order to write R code within our shiny app and fully exploit R power, we need to understand a two-step process:
Within the ui object we state our desire, what is the final output that we want to display. It can be a table, some text, a plot or any other R object.
Then, we use the server to construct and code those desired UI elements.
It’s a life philosophy. We all have dreams and wishes but in order to make them concrete, we need to roll up our sleeves. It’s exactly the same process in Shiny. You state your wishes in the ui and you make them concrete in the server.
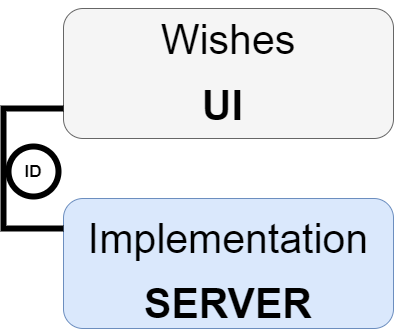
For human beings, we’re implicitly linking our desires to the hard work necessary to achieve them however in Shiny we’ll have to give a unique id to our desires (within the ui). Then in the server we’ll refer to corresponding id and work on it in order to make it concrete.
2.3.1 Dreaming within the ui
In order to establish some desires within the ui of our shiny app, we’ll have to work with a set of functions according to witch object we want to create. All these functions have the same structure <type of the object>Output(). For example, let’s say we want to display a table, we’ll use the function tableOutput(), now suppose we want a plot, we use plotOutput() and so on.
Tip: if you want to get a list of all the
*_Outputfunction, writeshiny::Outputand you’ll get a pop up listing all the related functions.
As an example, let’s work on on the mpg data frame. It is included in the ggplot2 package. Let’s say, we want to display the first 10 rows of the data frame.
library(shiny)


ui <- fluidPage(

tableOutput(outputId = "amazing_mpg")

)

server <- function(input, output) {}

shinyApp(ui = ui, server = server)
If we run the above code, Shiny will display an empty blank page, why ? because it’s just a wish yet, we need to make it concrete !
2.3.2 Make it real within the server
In the server, we have to grab our desired output. Remember that we’ve assigned a unique outputId as argument in the tableOutput() function : amazing_mpg. We’ll grab that id as follows :
server <- function(input, output) {

output$amazing_mpg

}
Now, it’s time to make it real. The functions that makes our ui objects concrete in Shiny all have the same structure: render<type of the object>. In the ui we’ve specified a tableOutput() as such we will use renderTable(). Indeed, each ui function has its corresponding server function:
server <- function(input, output) {


output$amazing_mpg <- renderTable(

  head(mpg, n = 10)

  )

}
Finally, we’ve our complete app (don’t forget to load the ggplot2 package):
library(shiny)
library(ggplot2)

ui <- fluidPage(

tableOutput(outputId = "amazing_mpg")

)

server <- function(input, output) {

output$amazing_mpg <- renderTable(

  head(mpg)

)


}

shinyApp(ui = ui, server = server)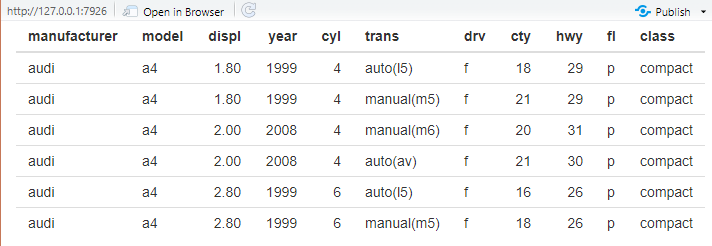
2.4 Application
Let’s focus on the relation between the hwy (highway miles per gallon) and the cty (city miles per gallon). We want to create a shiny app that displays a scatter plot between hwy and cty. We specify our wish in the ui with plotOutput(), give it a unique id, then make it concrete within the server with renderPlot():
library(shiny)
library(ggplot2)
ui <- fluidPage(
h1("My Amazing Plot"),
plotOutput(outputId = "amazing_plot")
)
server <- function(input, output) {
output$amazing_plot <- renderPlot(
ggplot(mpg, aes(hwy, cty)) +
geom_point()
)
}
shinyApp(ui = ui, server = server)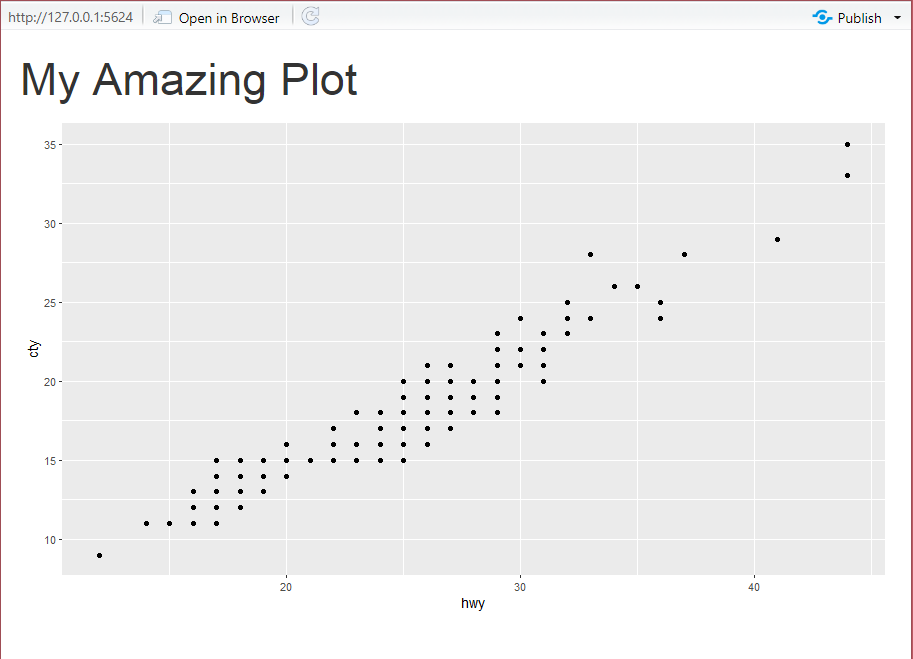 Did you observe that we didn’t use
 tags$h1() for the title. Instead, we just put h1() (same for br()). In shiny, many HTML commands are wrapped up directly within the package which alleviates a little bit the coding.
Now, let’s add some summary statics below the plot. To display R code results in Shiny we’ll have to specify our desire using verbatimTextOutput() and implement it with renderPrint()
library(shiny)
library(ggplot2)
library(magrittr) # for the %>% (pipe)
library(dplyr) # for data wrangling


ui <- fluidPage(


  h1("My Amazing Plot"),

  plotOutput(outputId = "amazing_plot"),

  br(), # making some space
  br(), # don't forget it the comma !

  h1("My Amazing Summary"),

  verbatimTextOutput(outputId = "amazing_summary")

)

server <- function(input, output) {


output$amazing_plot <- renderPlot(

  ggplot(mpg, aes(hwy, cty)) +
    geom_point()


)

output$amazing_summary <- renderPrint(

  mpg %>% select(hwy, cty) %>% summary()


  )

}

shinyApp(ui = ui, server = server)
Unlike the ui, inside the the server we don’t have to separate the components by a ,. Yep ! no need for a comma.
2.5 Exercice
In the above code chunk, replace
verbatimtextOutput()withtextOutput(), what do you observe ? In which case,textOutput()would be needed ?Try to add a comma between the components of the server. What happens ?