Chapter 4 My watchlist
4.1 Comprehensive financials4
Figure 4.1: Summarized statistics of my watchlist
Figure 4.2: Income statement, balance sheet, and cash flow data over the last 4 years
| Term | Meaning |
|---|---|
| Adjusted Graham formula | Defined here |
| BVPS | Book value per share |
| DCF10 | Discounted cash flow per share in 10 years as defined here |
| EPS | Earnings per share |
| High52 | 52-week high price |
| IC | Invested capital |
| Industry PER | Data from here |
| Low52 | 52-week low price |
| NOPAT | Net operating profit after taxes |
| Payback8 | 8-year payback time buy price of the whole company (Town & Town, 2018) |
| PBR | Price/book-value ratio |
| PEG | Price/earnings-to-growth ratio |
| PER | Price/earnings ratio |
| PSR | Price/sales ratio |
| ROA | Return on asset |
| ROE | Return on equity |
| ROIC | Return on invested capital |
| Sustainable growth rate | ROE \(\times\) retention ratio |
4.2 Key financials
Figure 4.3: Key financials of my watchlist

Figure 4.4: Scatterplot of key statistics
4.3 Big four numbers
Trends of big 4 numbers over the last 3 to 4 years (depending on data availability at Yahoo Finance) are shown below. All numbers are normalized to 100 (if positive) or -100 (if negative) as of the first year with available data for each company.
Figure 4.5: Total revenue
Figure 4.6: Net income
Figure 4.7: Operating cash flow
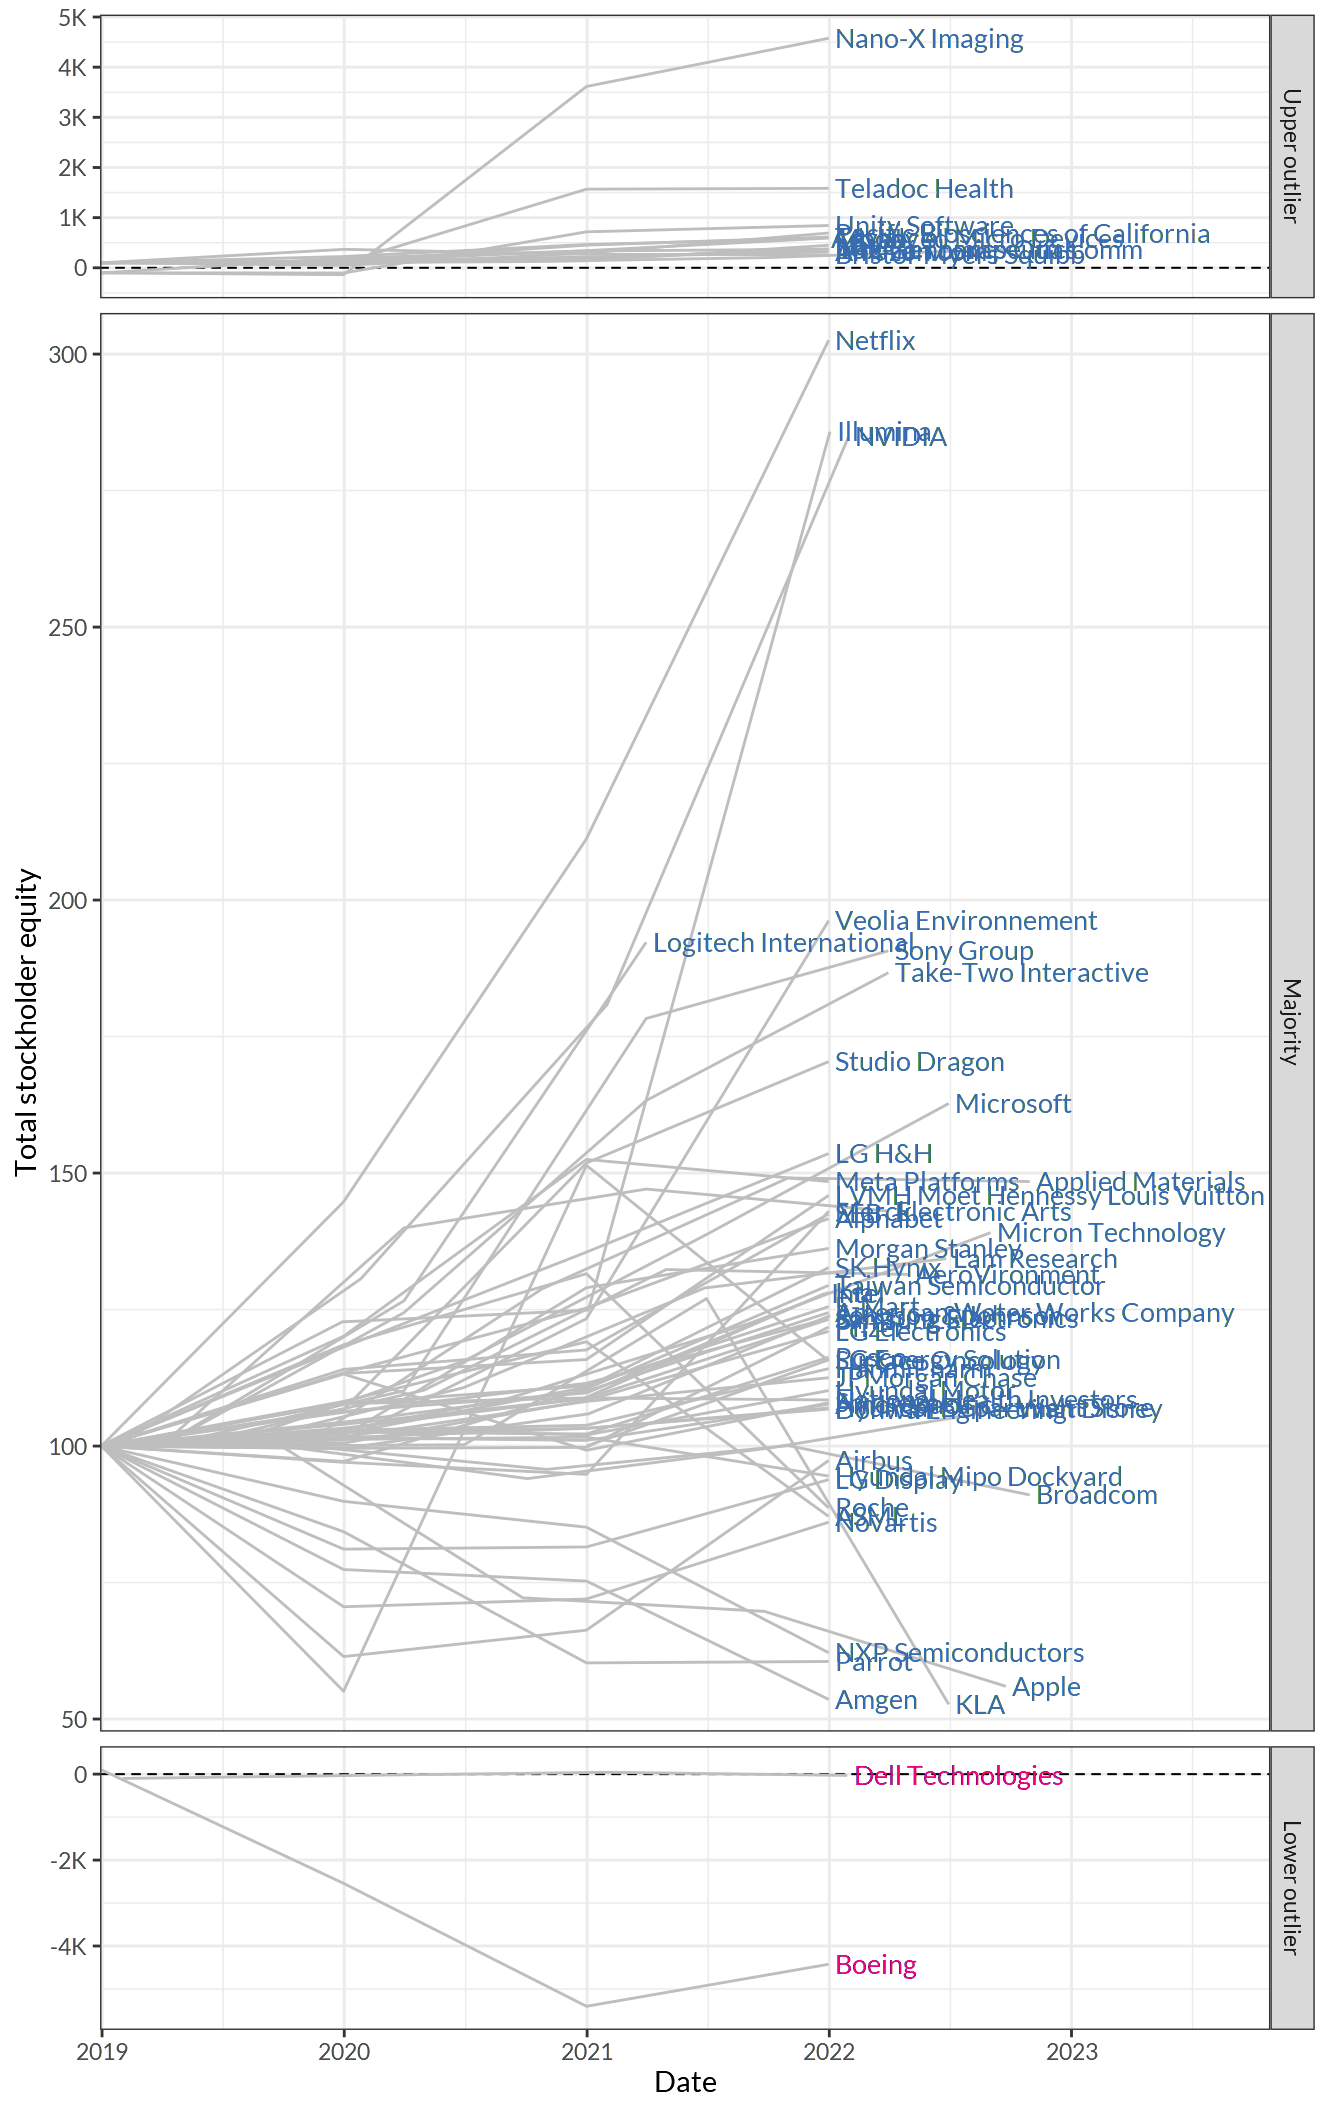
Figure 4.8: Shareholder’s equity
4.4 Investment decision5
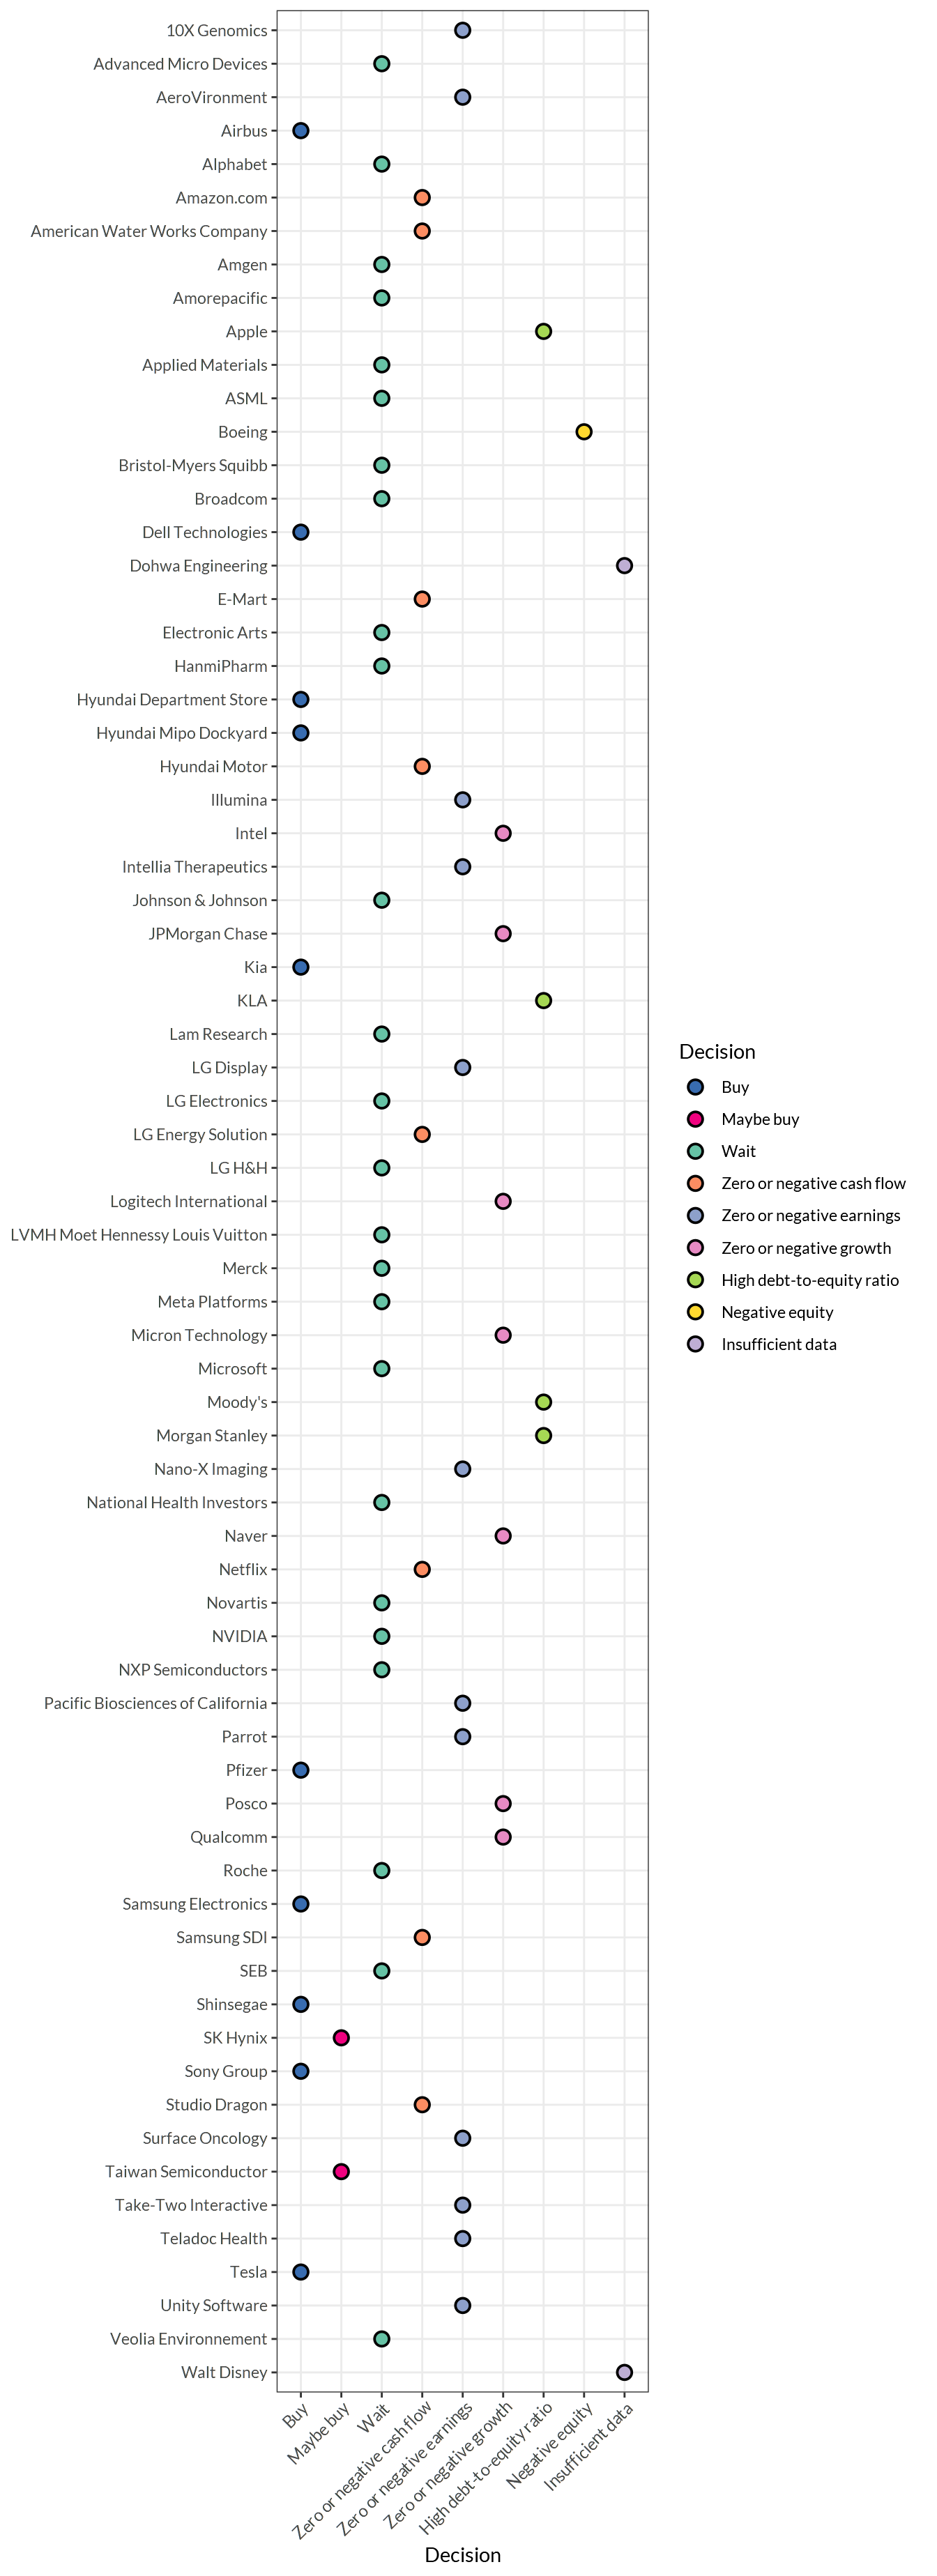
Figure 4.9: Investment decision made by a fundamental analysis-based algorithm for listed companies
References
Data are automatically retrieved from Google Finance and Yahoo Finance.↩︎
The decision is made by analyzing only numerical data, which do not represent the value of a business as a whole. For example, the value of an early-stage company with zero or negative earnings cannot be determined based on numbers but should be assessed based on its mission, technology, management, and culture as well as the state of the industry overall.↩︎