Chapter 7 Stock price trend
7.1 Normalized closing price6
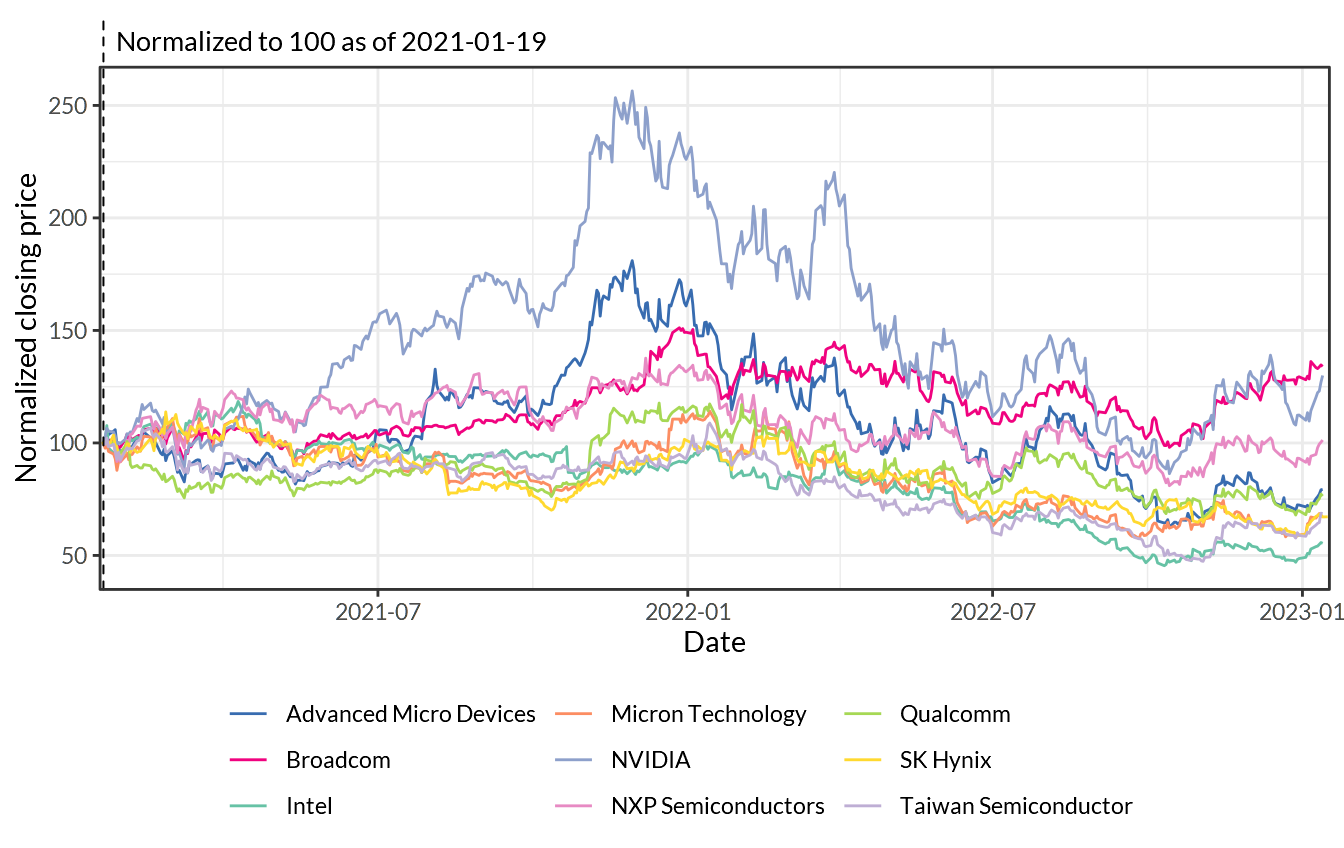
Figure 7.1: Semiconductor
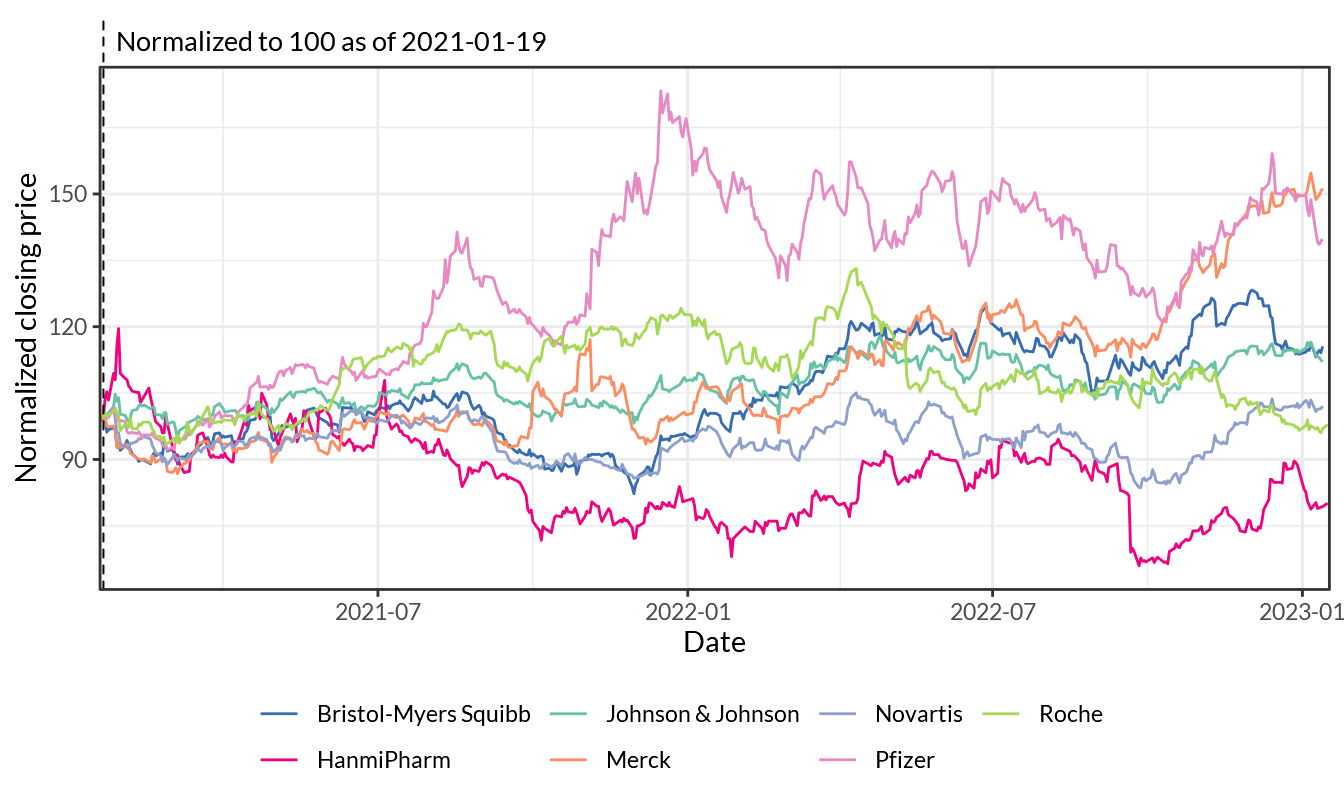
Figure 7.2: Drugs (Pharmaceutical)
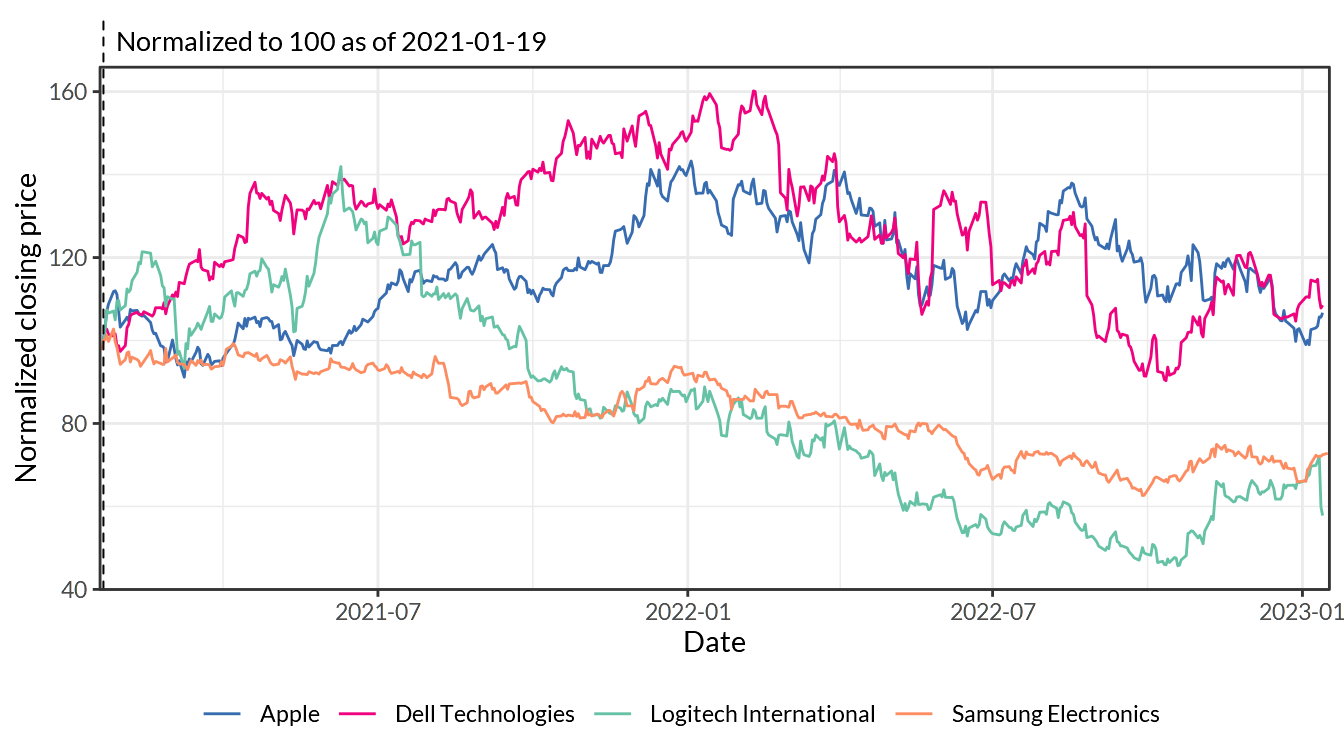
Figure 7.3: Computers/Peripherals
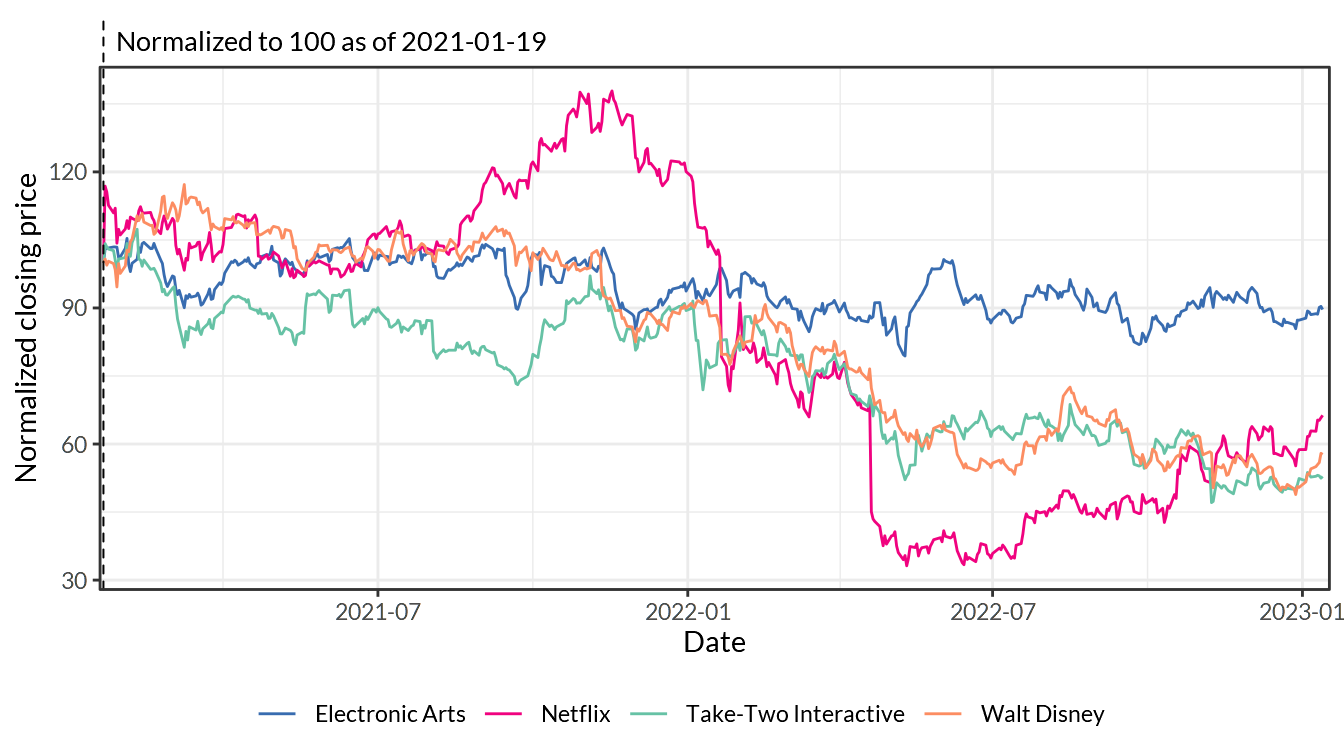
Figure 7.4: Entertainment
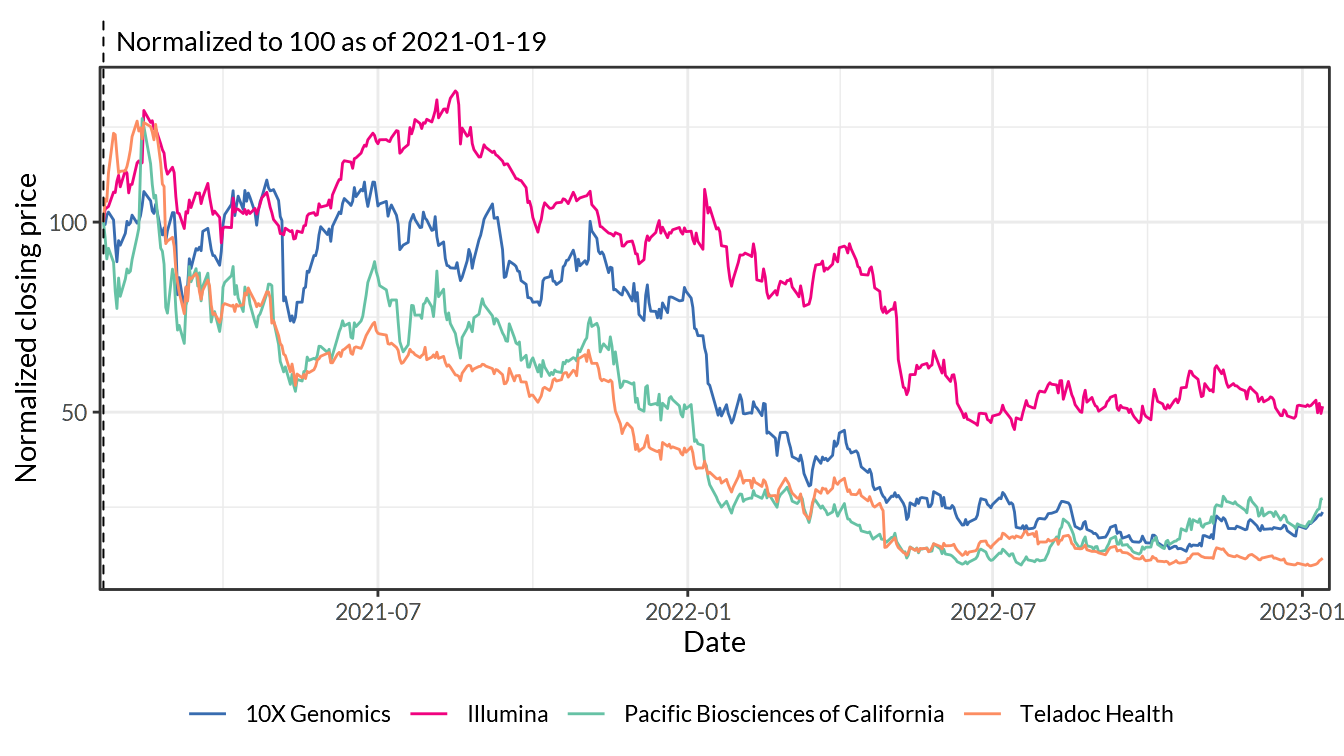
Figure 7.5: Heathcare Information and Technology
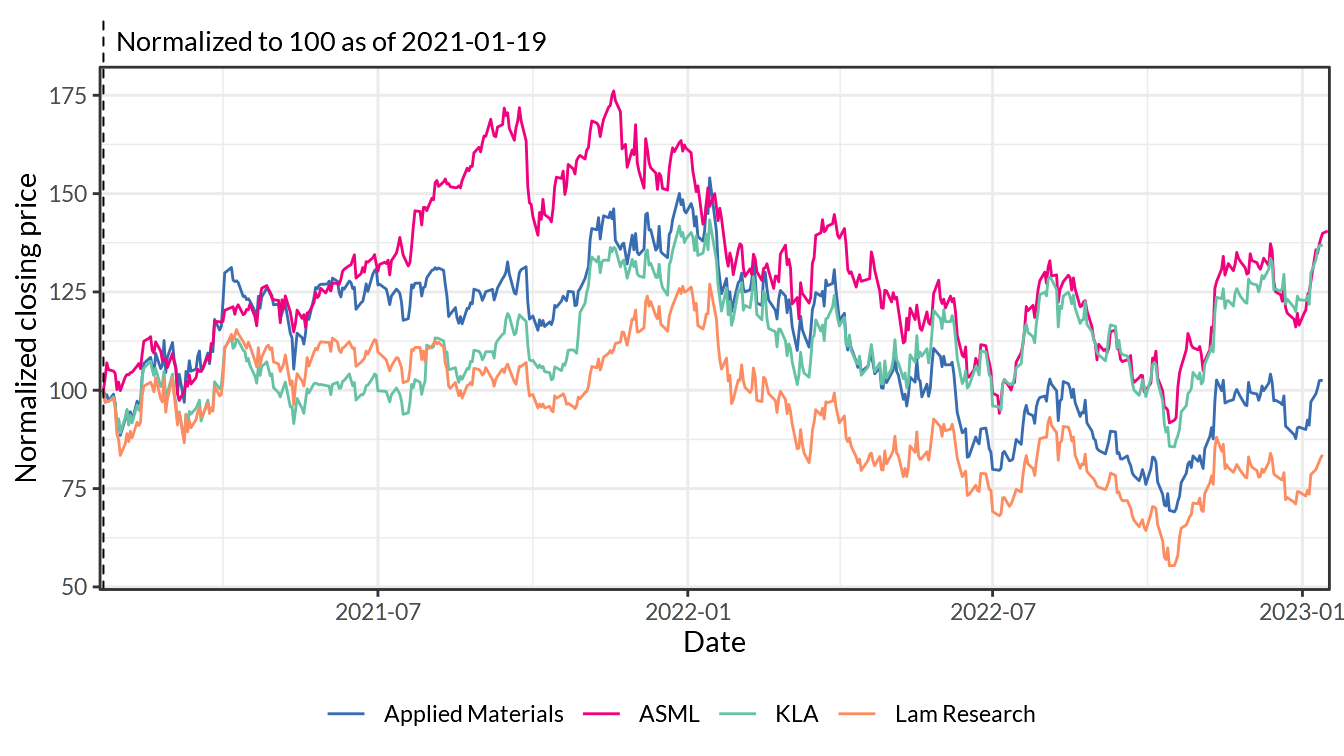
Figure 7.6: Semiconductor Equip
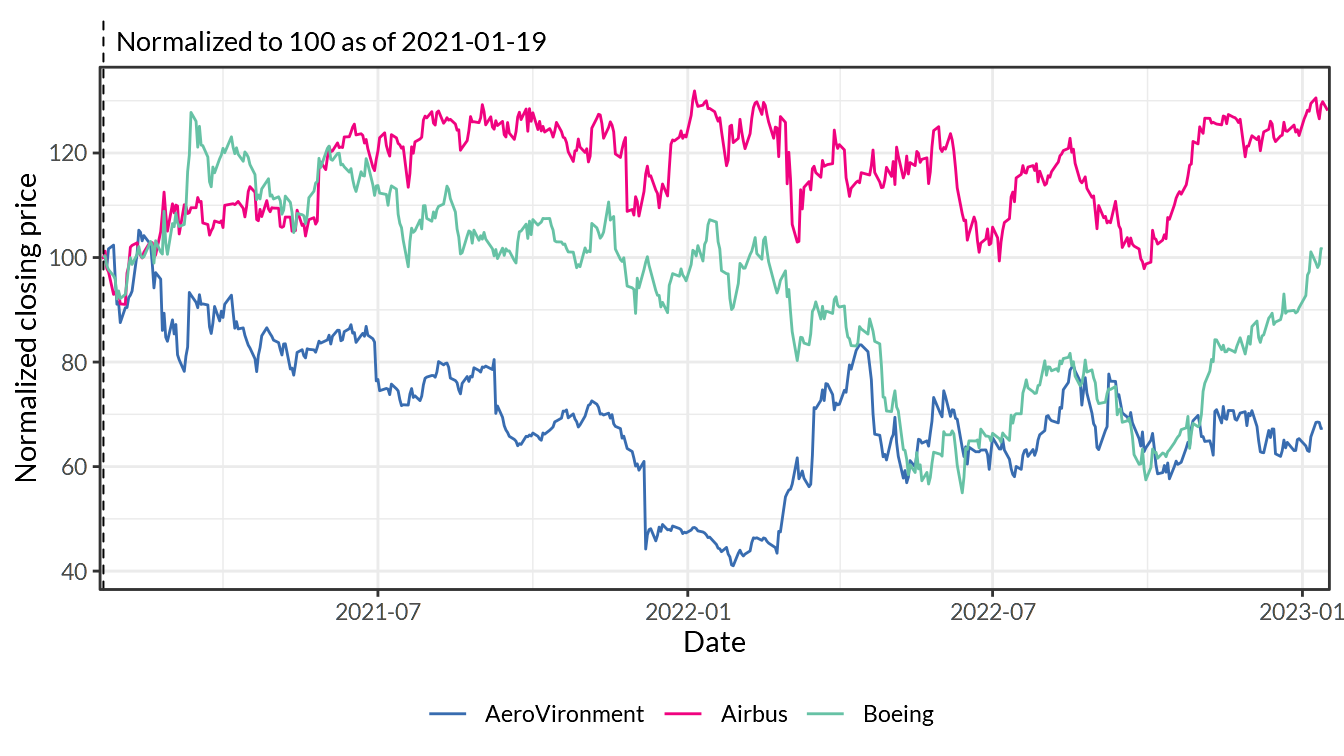
Figure 7.7: Aerospace/Defense
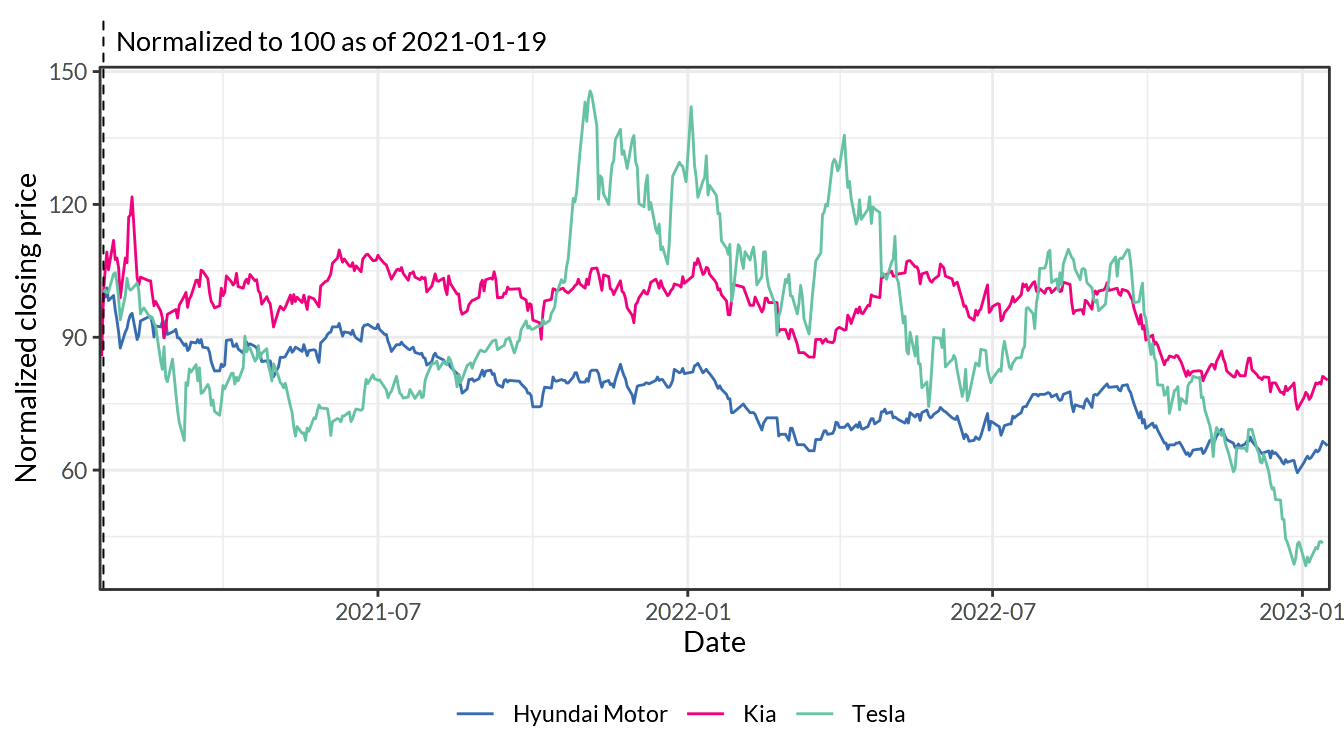
Figure 7.8: Auto & Truck
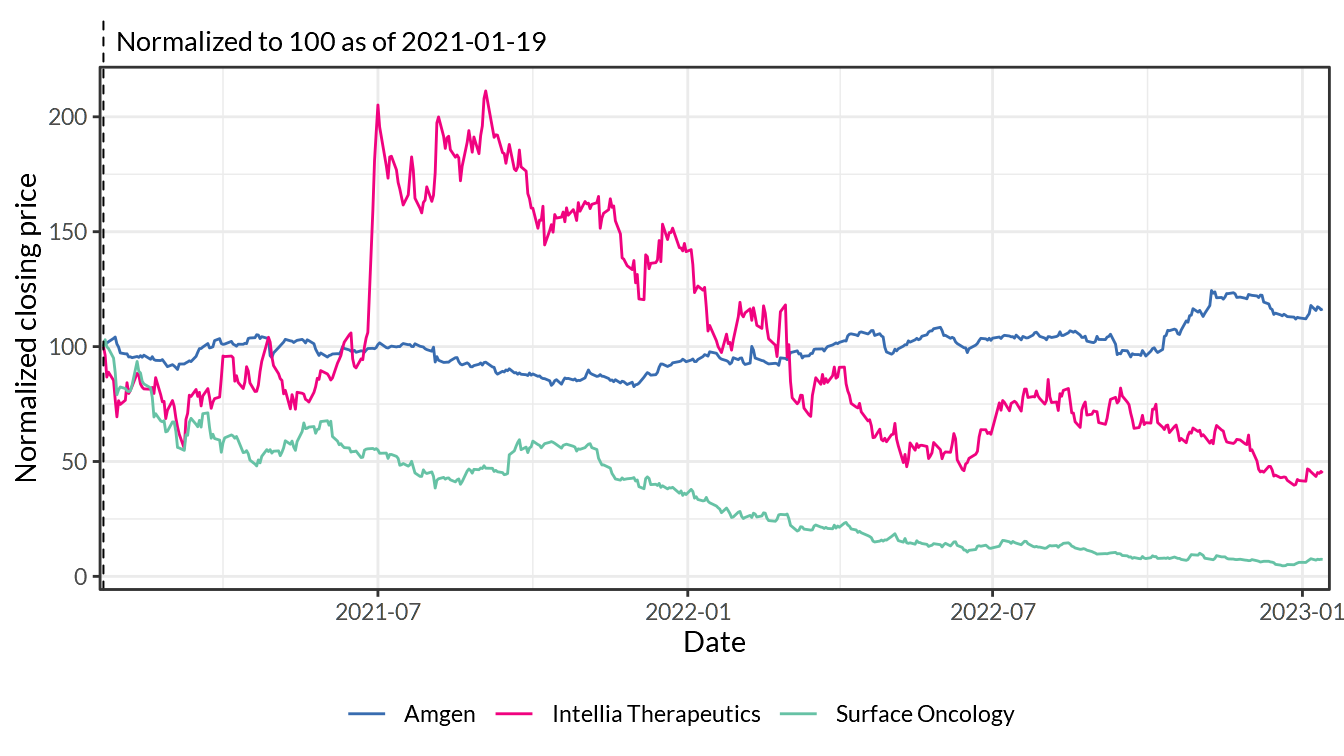
Figure 7.9: Drugs (Biotechnology)
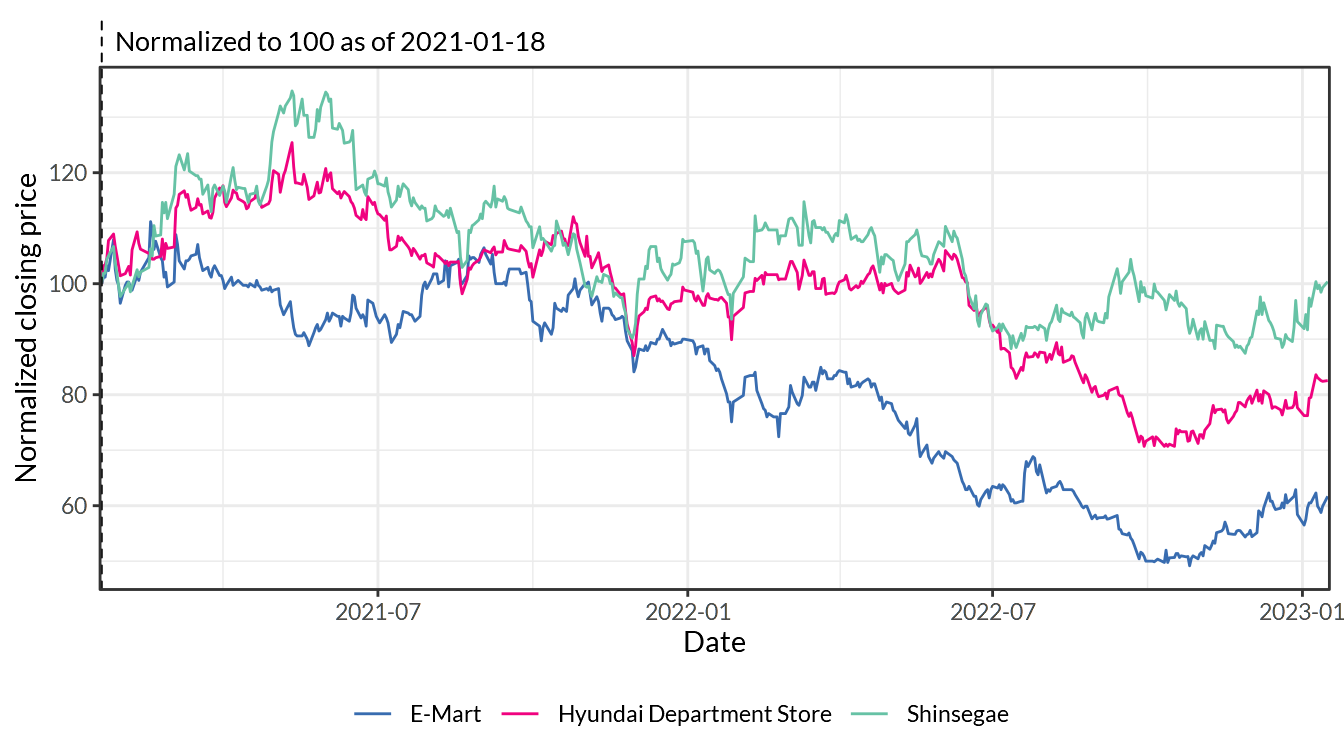
Figure 7.10: Retail (General)
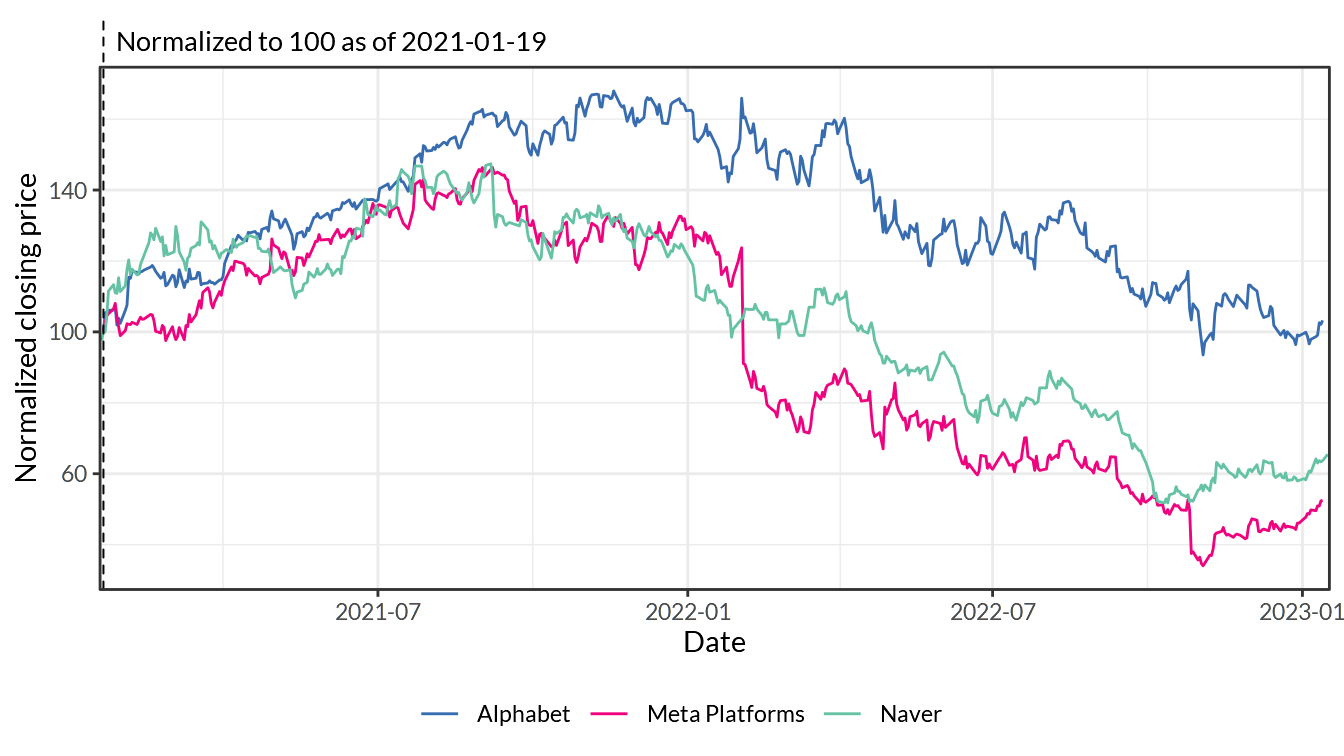
Figure 7.11: Software (Entertainment)
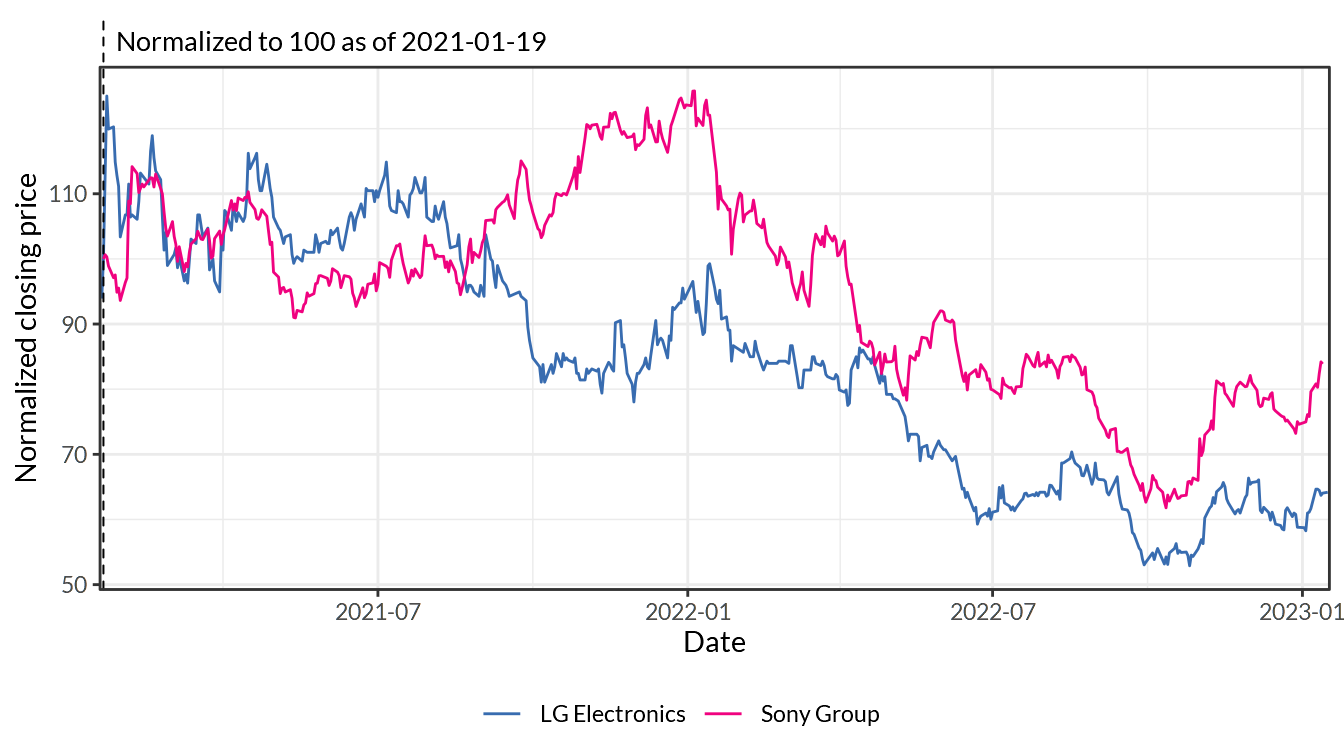
Figure 7.12: Electronics (Consumer & Office)
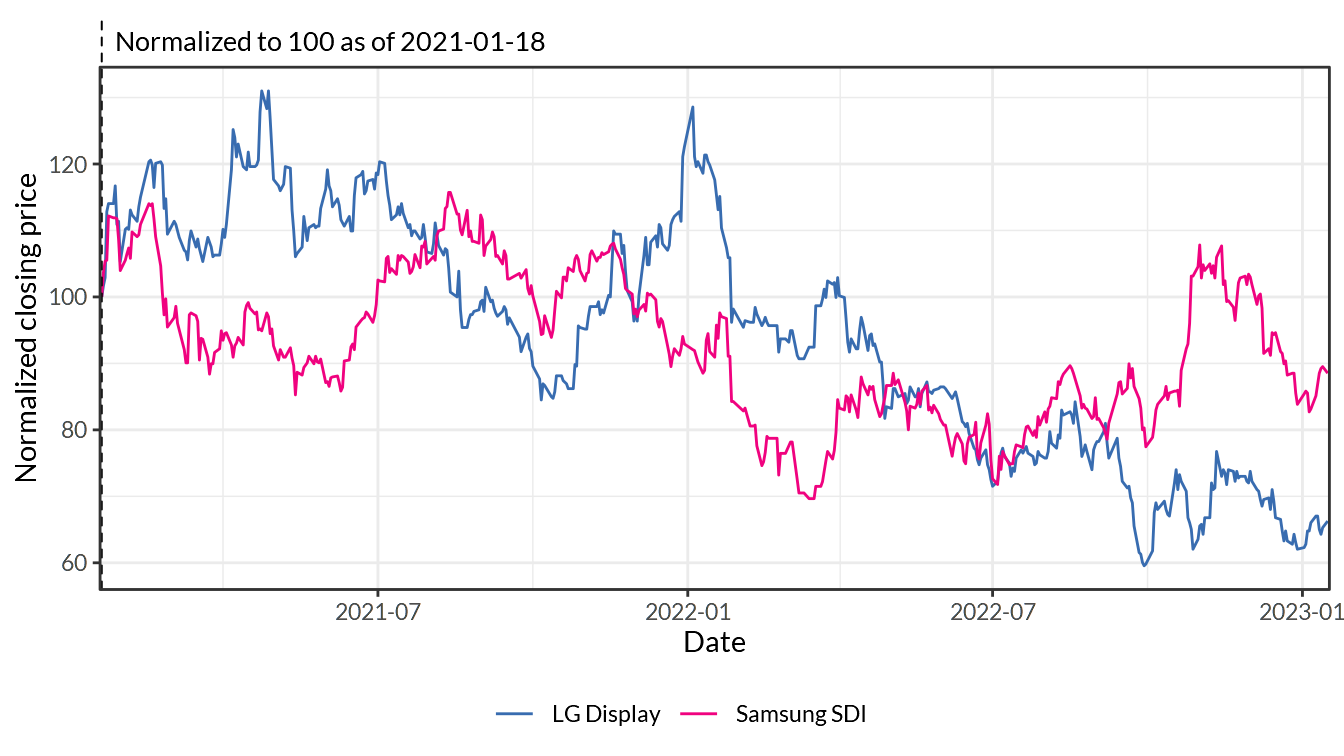
Figure 7.13: Electronics (General)
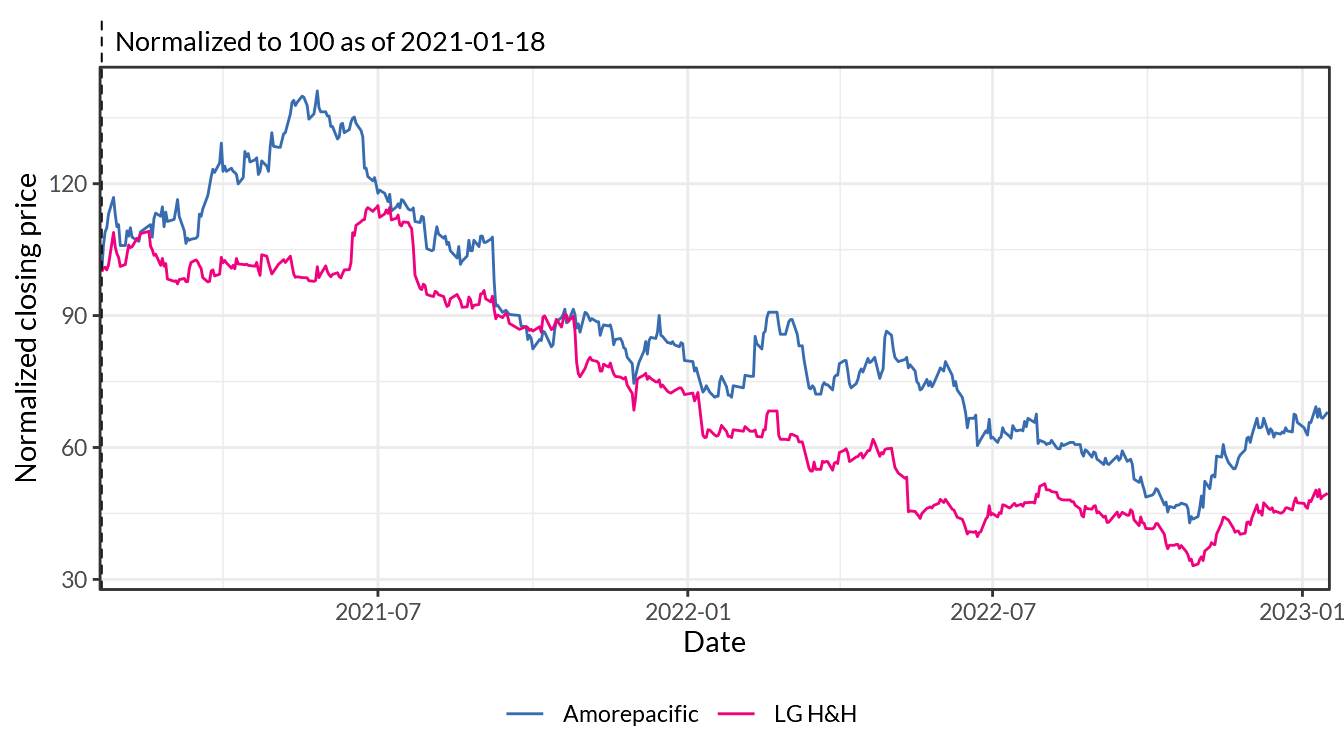
Figure 7.14: Household Products
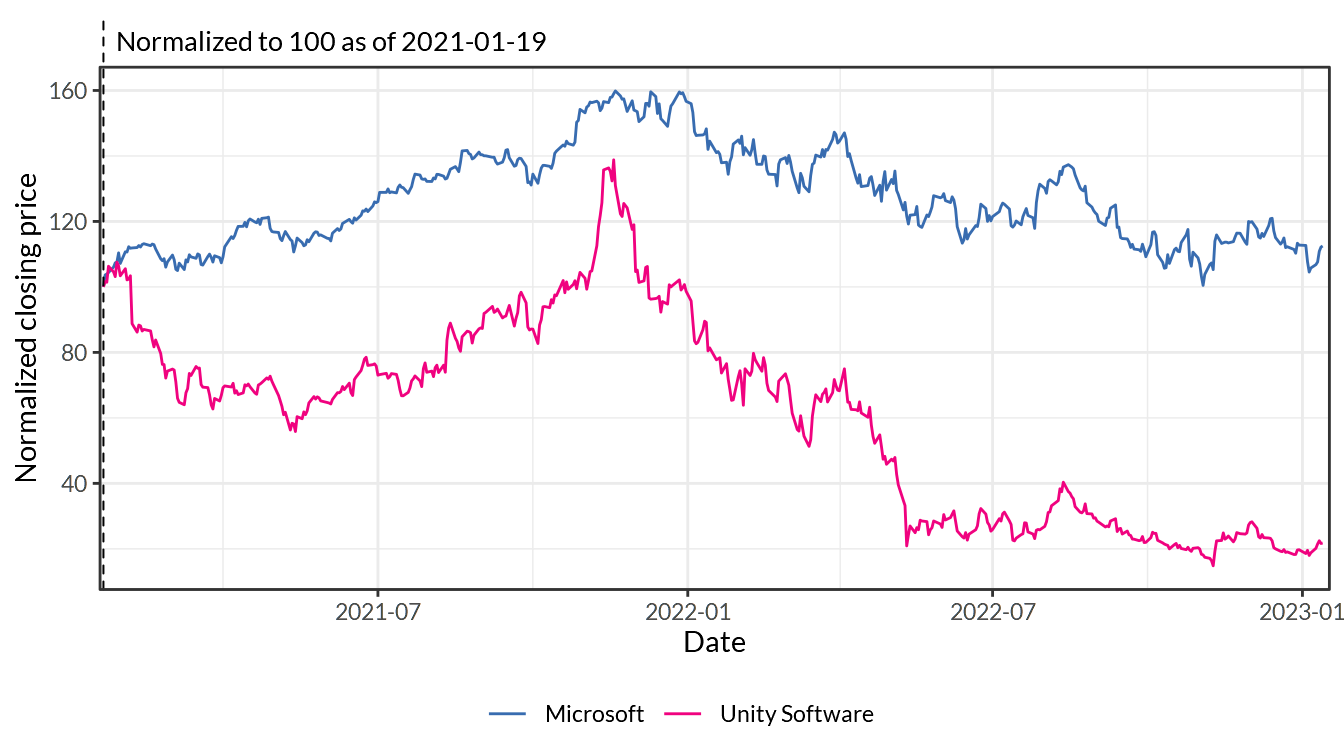
Figure 7.15: Software (System & Application)
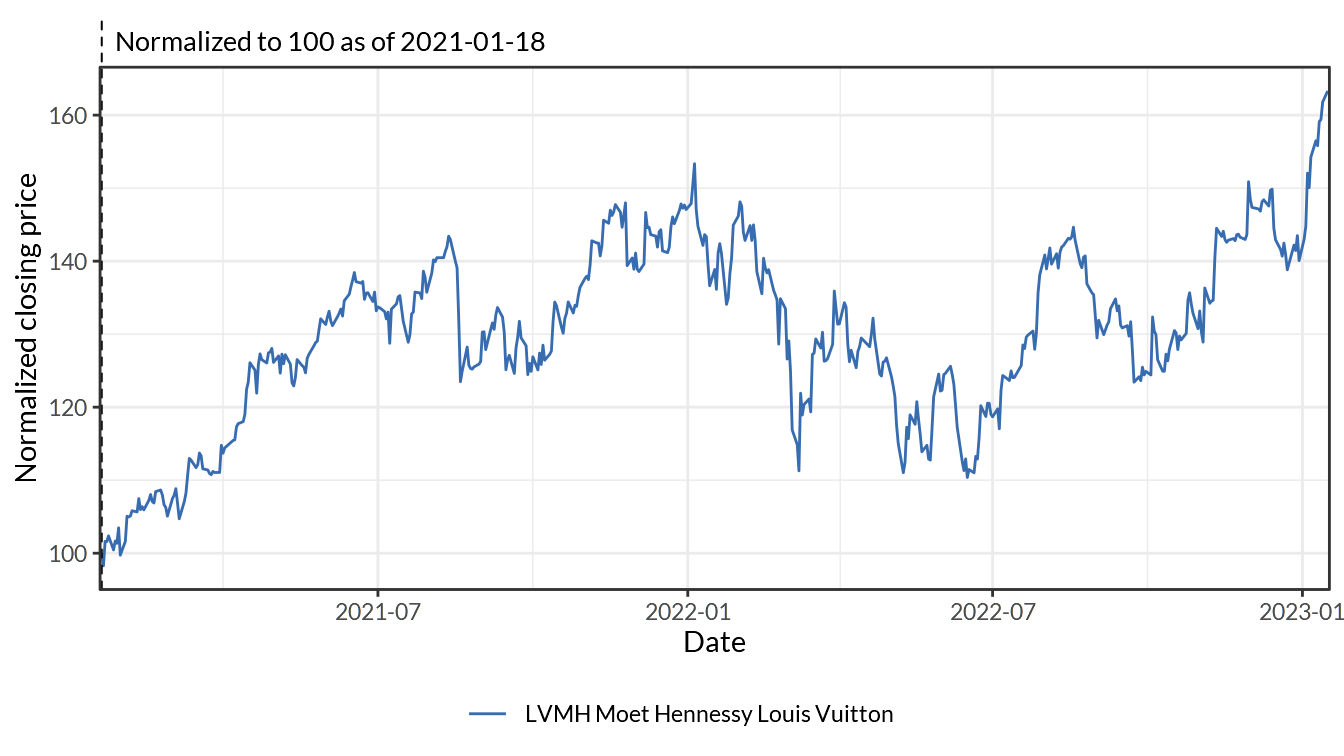
Figure 7.16: Apparel
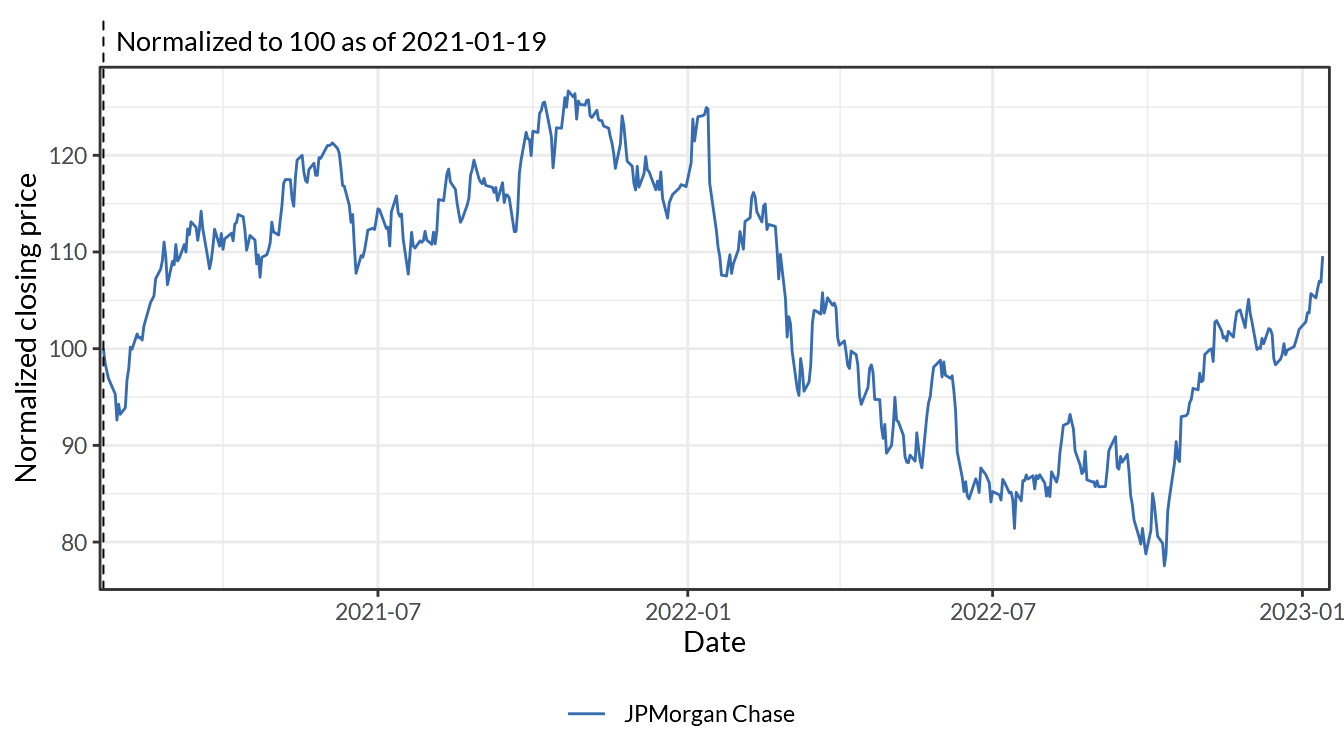
Figure 7.17: Bank (Money Center)
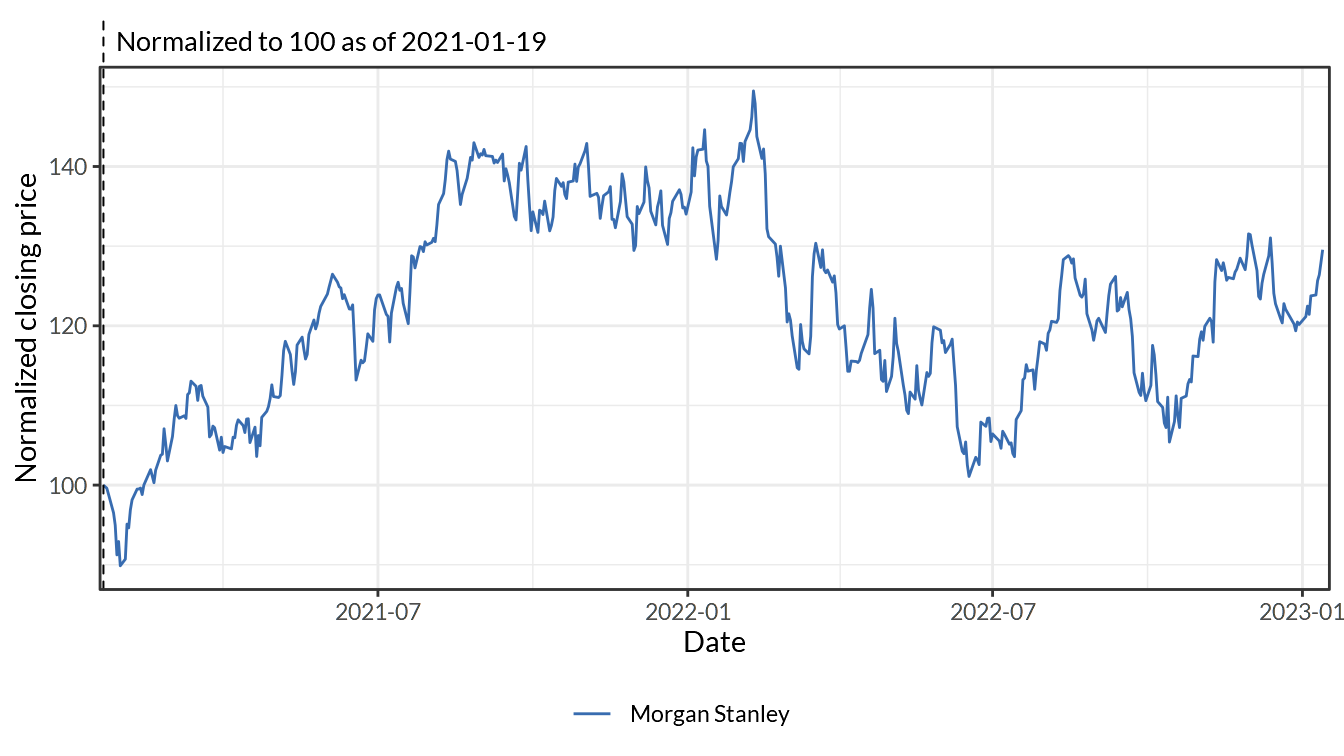
Figure 7.18: Brokerage & Investment Banking
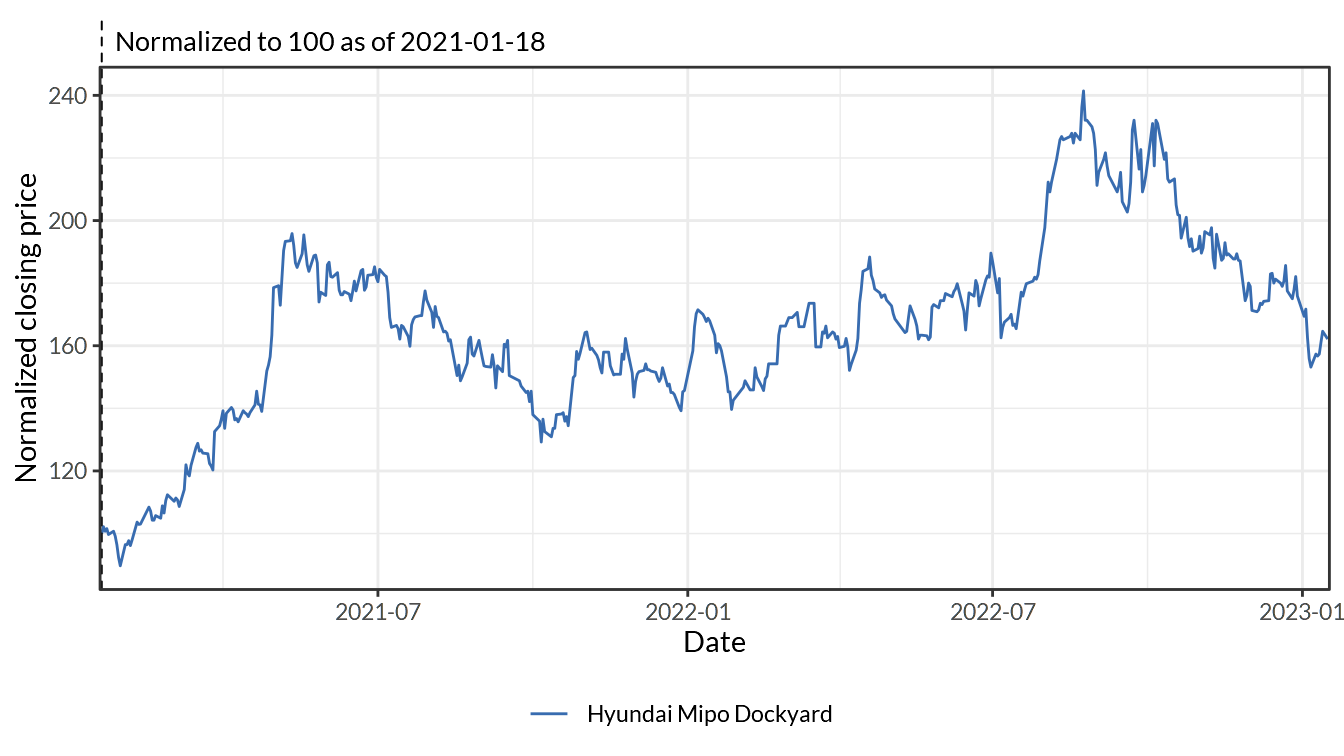
Figure 7.19: Construction Supplies
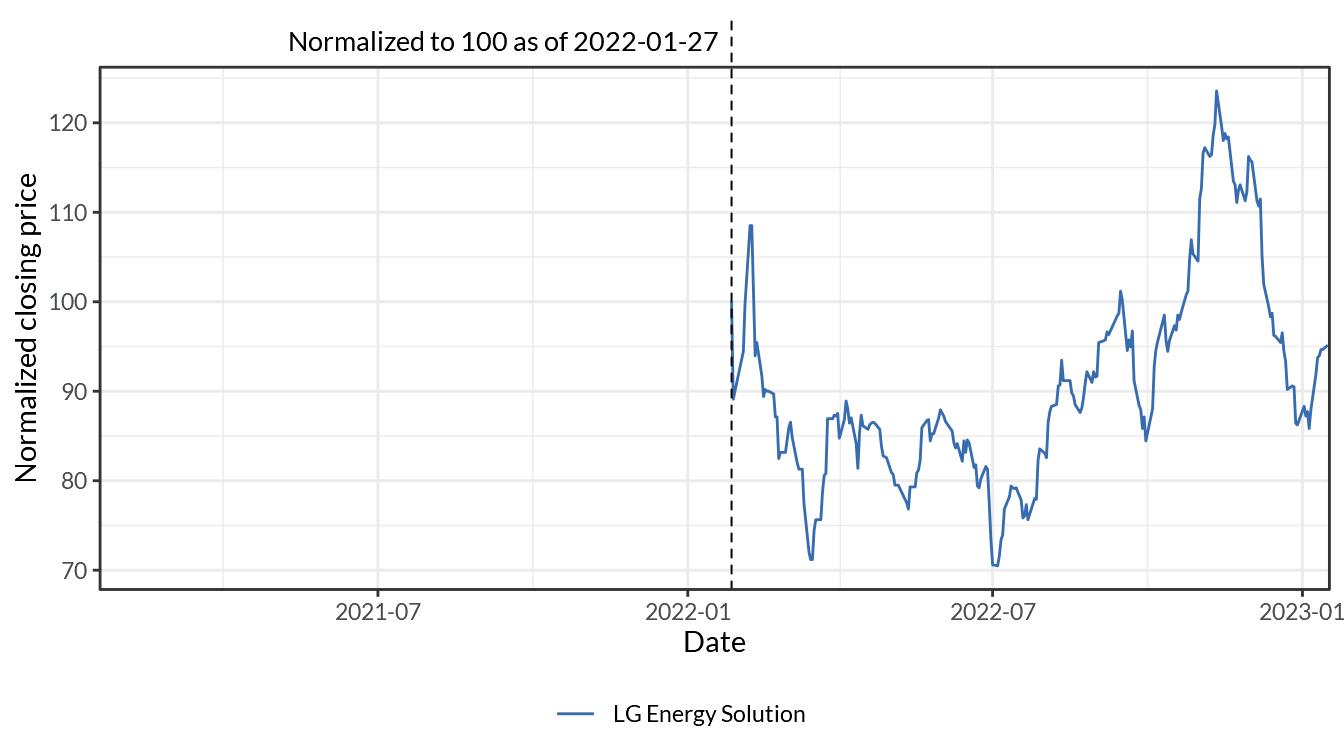
Figure 7.20: Electrical Equipment
7.2 Adjusted closing price

Figure 7.21: Adjusted stock prices of companies with names starting with numbers or letters A-L over the last 2 years. The blue shade at the bottom of each panel indicates trading volume per day (smoothed for visualization).

Figure 7.22: Adjusted stock prices of companies with names starting with letters M-Z over the last 2 years. The blue shade at the bottom of each panel indicates trading volume per day (smoothed for visualization).
7.3 Stock price correlation7
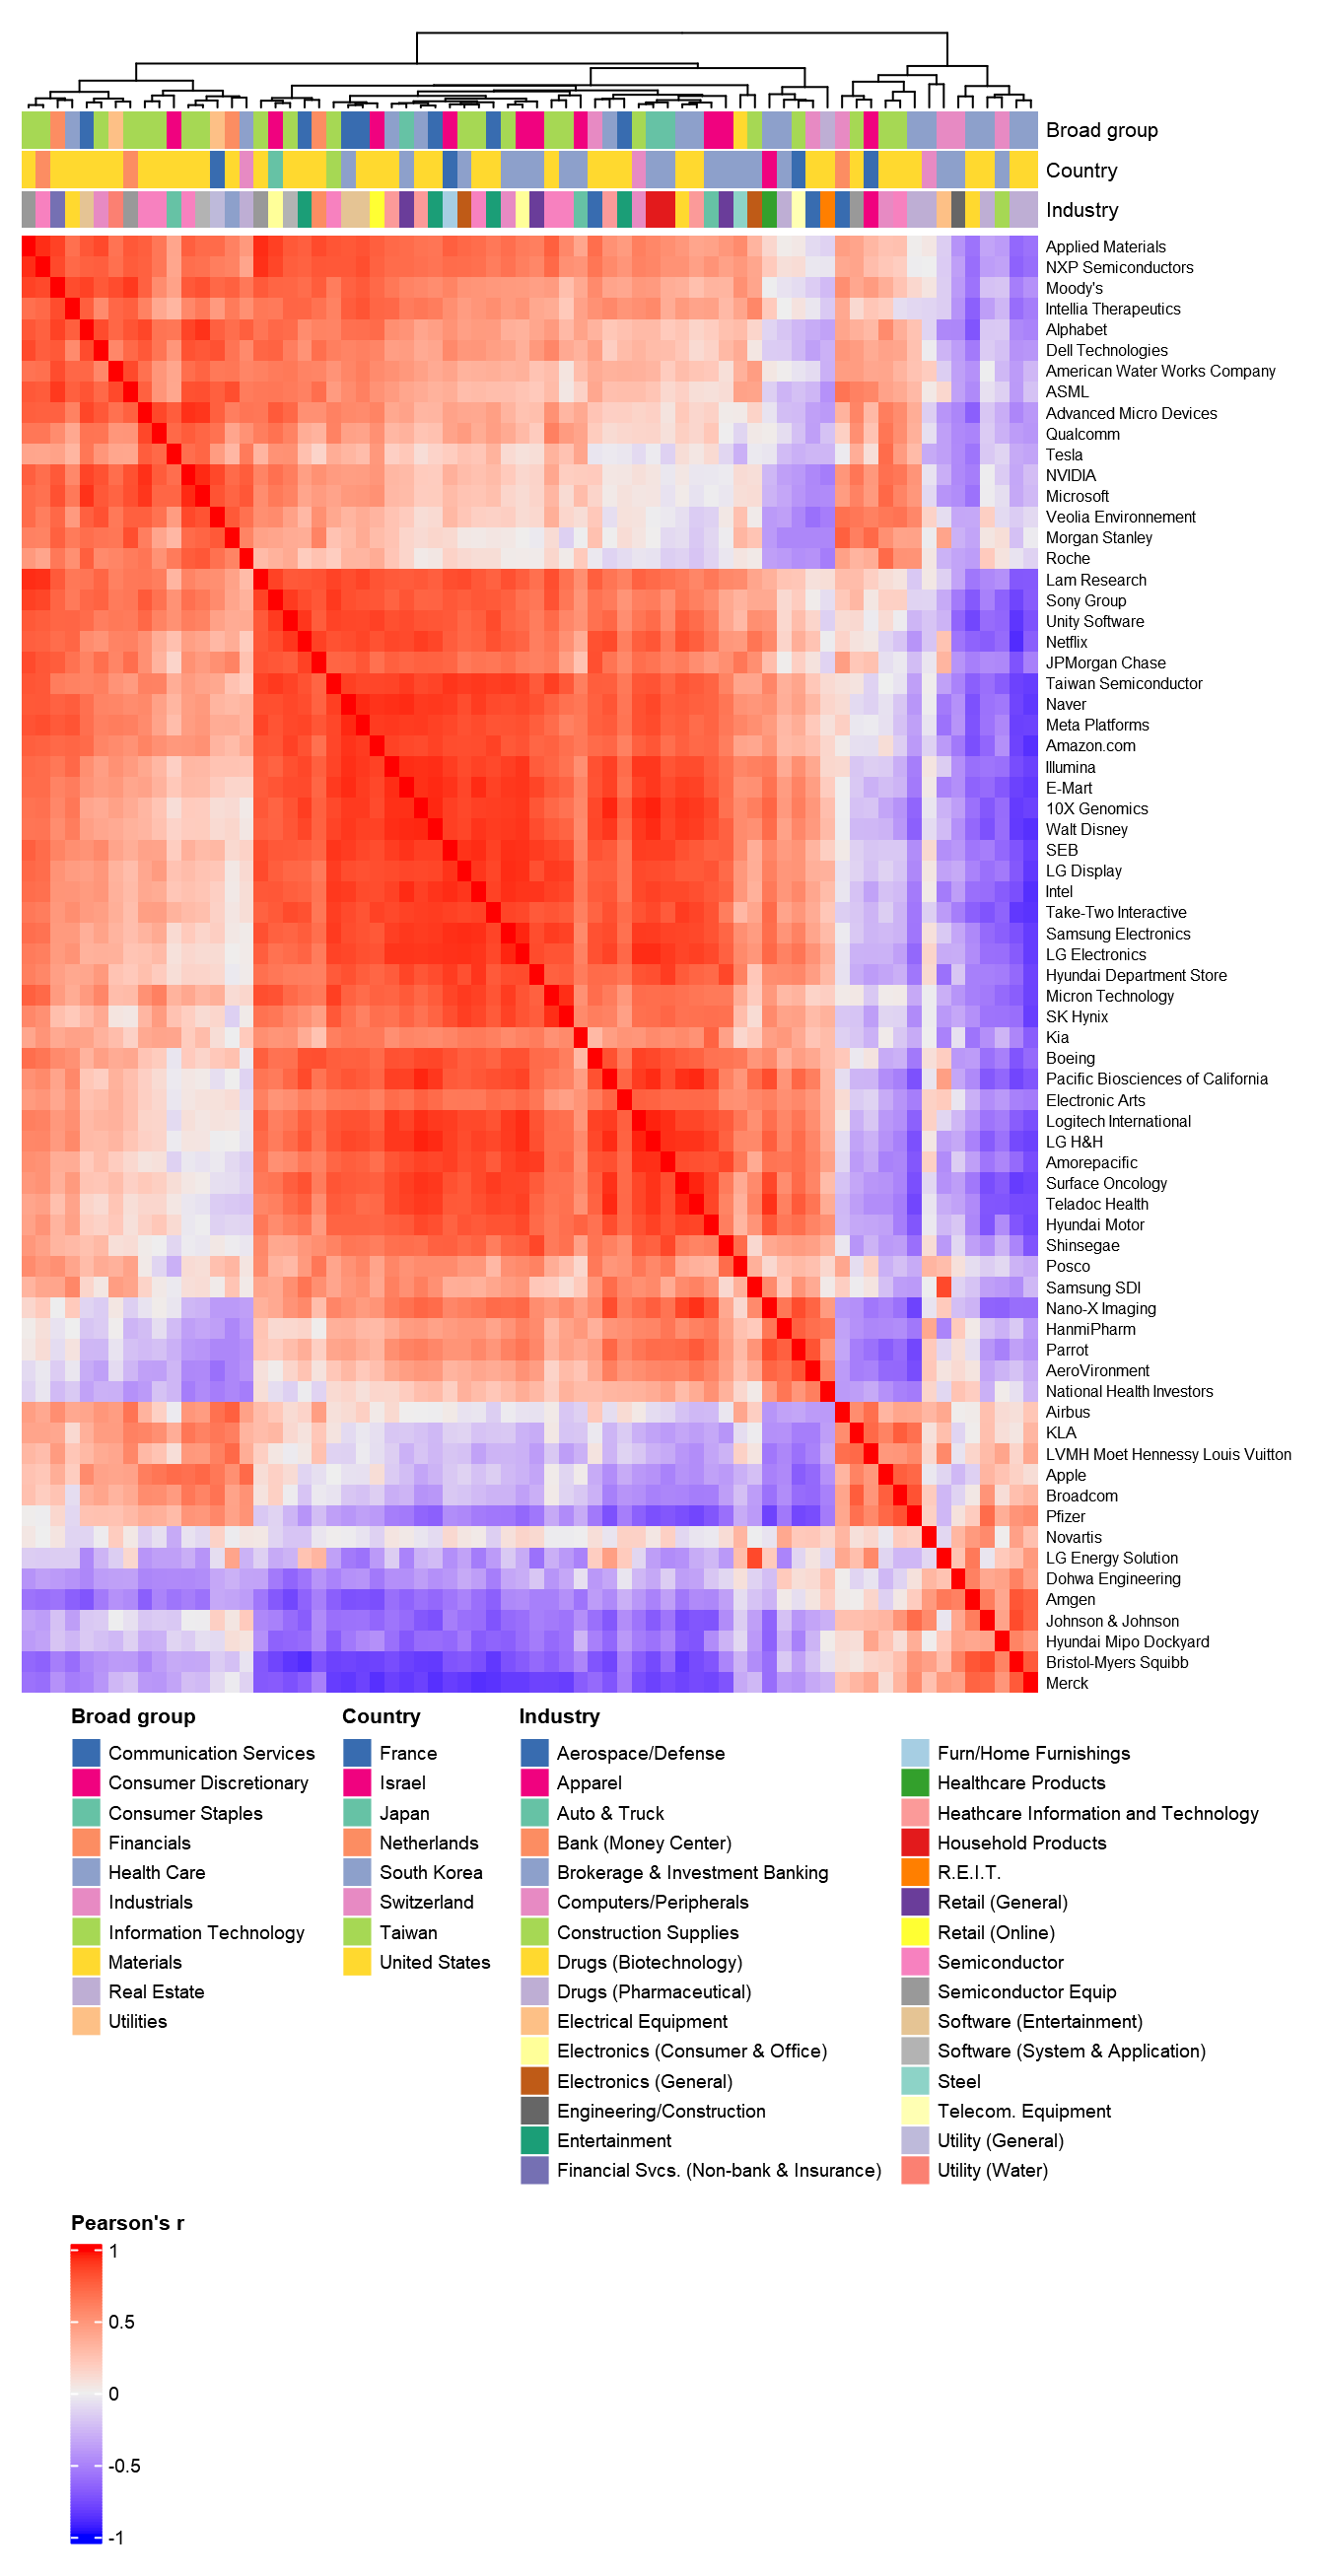
Figure 7.23: Pairwise correlation between adjusted closing prices for 2 years of my watchlist