3 Fig1
3.1 Prepare chromosome length information
suppressMessages(library(dplyr))
suppressMessages(library(ggplot2))
suppressMessages(library(ggcharts))
chr_info = read.table('data/hg19.chrom.sizes')
chr_final = data.frame(chr = paste0('chr',c(seq(1:22),'X')),length = 0)
t = merge(chr_final,chr_info,by.x='chr',by.y='V1')
chr_info = t[,c(1,3)]
chr_info$ratio = 0
3.2 NAD chromosome percentage
sub = read.table('data/NAD')
for(i in 1:23){
  if(i==23){i = 'X'}
  chr = paste0('chr',i)
  t = sub[sub$V1==chr,]
  t = sum(t$V3-t$V2)/chr_info[chr_info$chr==chr,2]
  chr_info[chr_info$chr==chr,3] = t
}
chr_info$ratio = round(as.numeric(chr_info$ratio),4)*100
chart <- chr_info %>%
  bar_chart(chr, ratio,bar_color = "darkorange")
chart +
  geom_text(aes(label = ratio, hjust = "left"))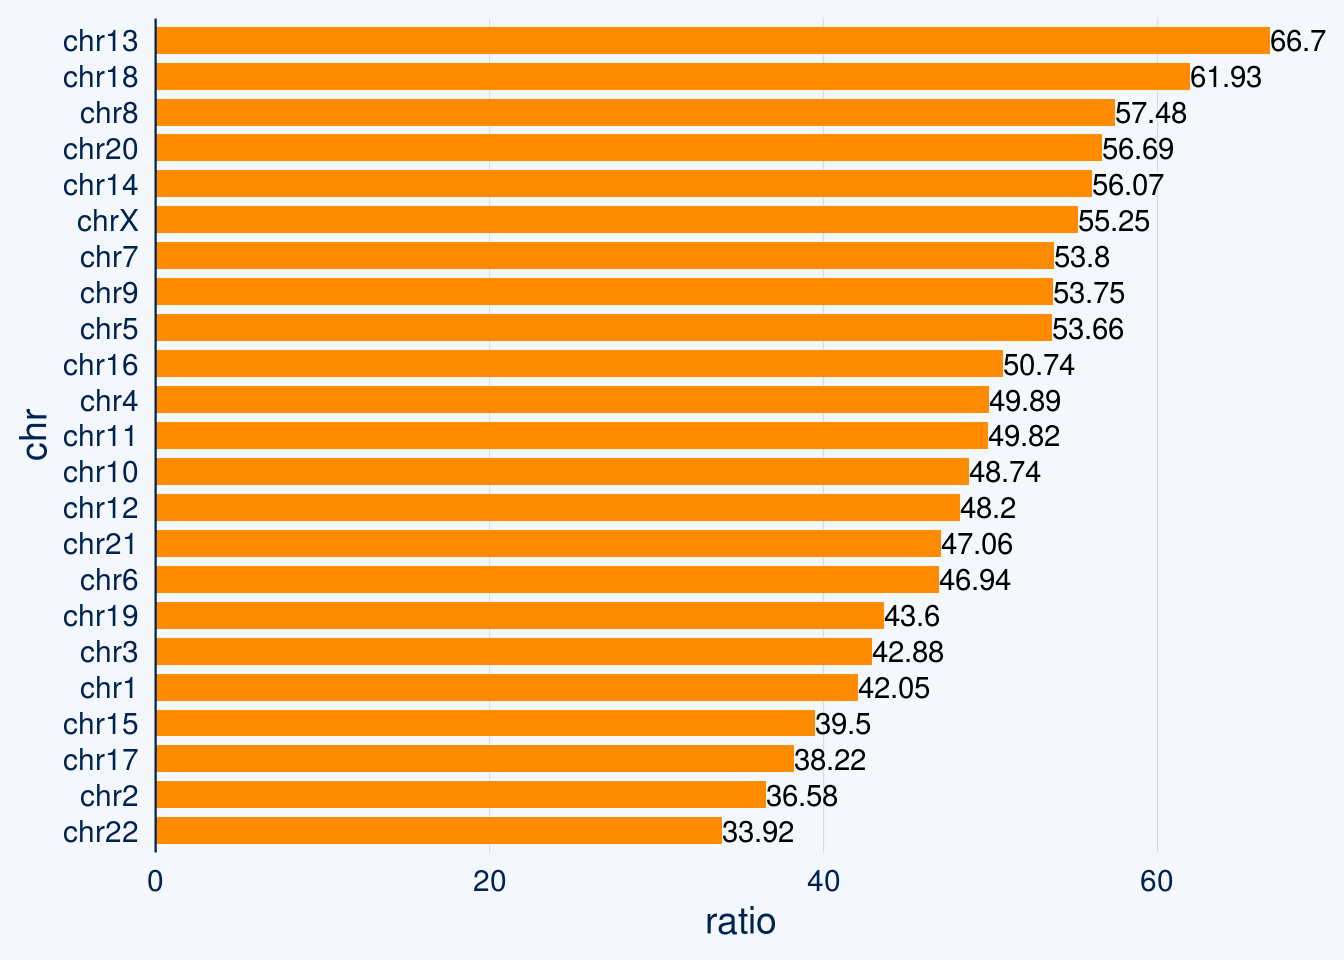
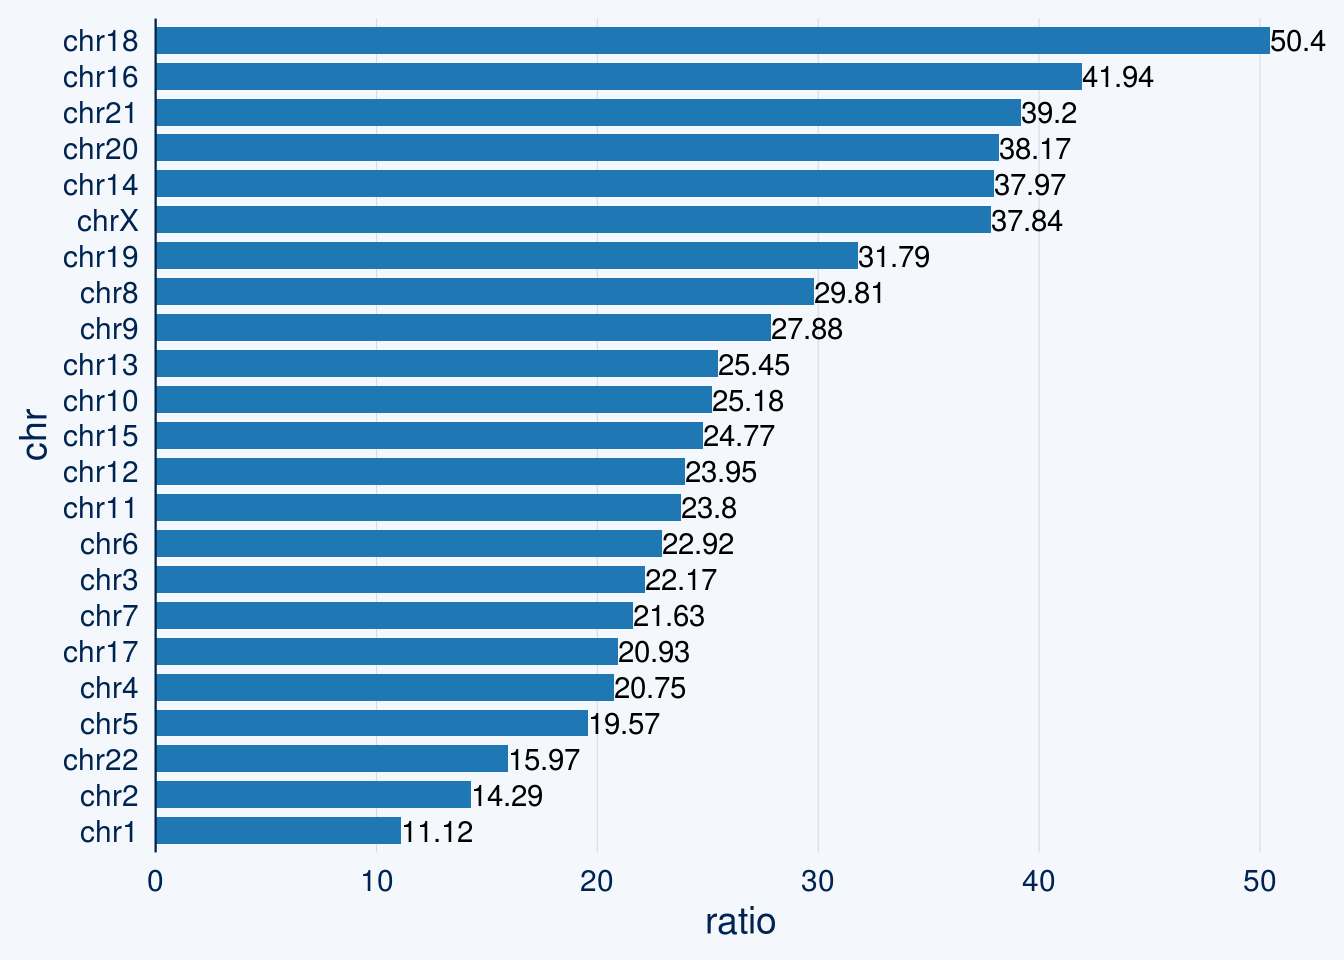
3.3 hNAD chromosome percentage
sub = read.table('data/hNAD')
for(i in 1:23){
  if(i==23){i = 'X'}
  chr = paste0('chr',i)
  t = sub[sub$V1==chr,]
  t = sum(t$V3-t$V2)/chr_info[chr_info$chr==chr,2]
  chr_info[chr_info$chr==chr,3] = t
}
chr_info$ratio = round(as.numeric(chr_info$ratio),4)*100
chart <- chr_info %>%
  bar_chart(chr, ratio)
chart +
  geom_text(aes(label = ratio, hjust = "left"))