6 Fig5
knitr::opts_chunk$set(warning=FALSE, message=FALSE)suppressMessages(library(ggplot2))
options(stringsAsFactors = F)
hic = read.table('data/hela-hic-rDNA')
nhic = read.table('data/hela-nhic-rDNA')
hic_actd = read.table('data/hela-hic-actd-rDNA')
nhic_actd = read.table('data/hela-nhic-actd-rDNA')6.1 Fig 5A
counts = data.frame(hic=dim(hic)[1]/303984633*4*10^8,hic_actd=dim(hic_actd)[1]/171680362*4*10^8,
                    nhic=dim(nhic)[1]/332710486*4*10^8,nhic_actd=dim(nhic_actd)[1]/333186514*4*10^8)
barplot(as.matrix(counts), main="",
        xlab="", col=c("#2BA809","#F97164"),
beside=T,ylim=c(0,3000000),ylab = 'Total interactions with rDNA') 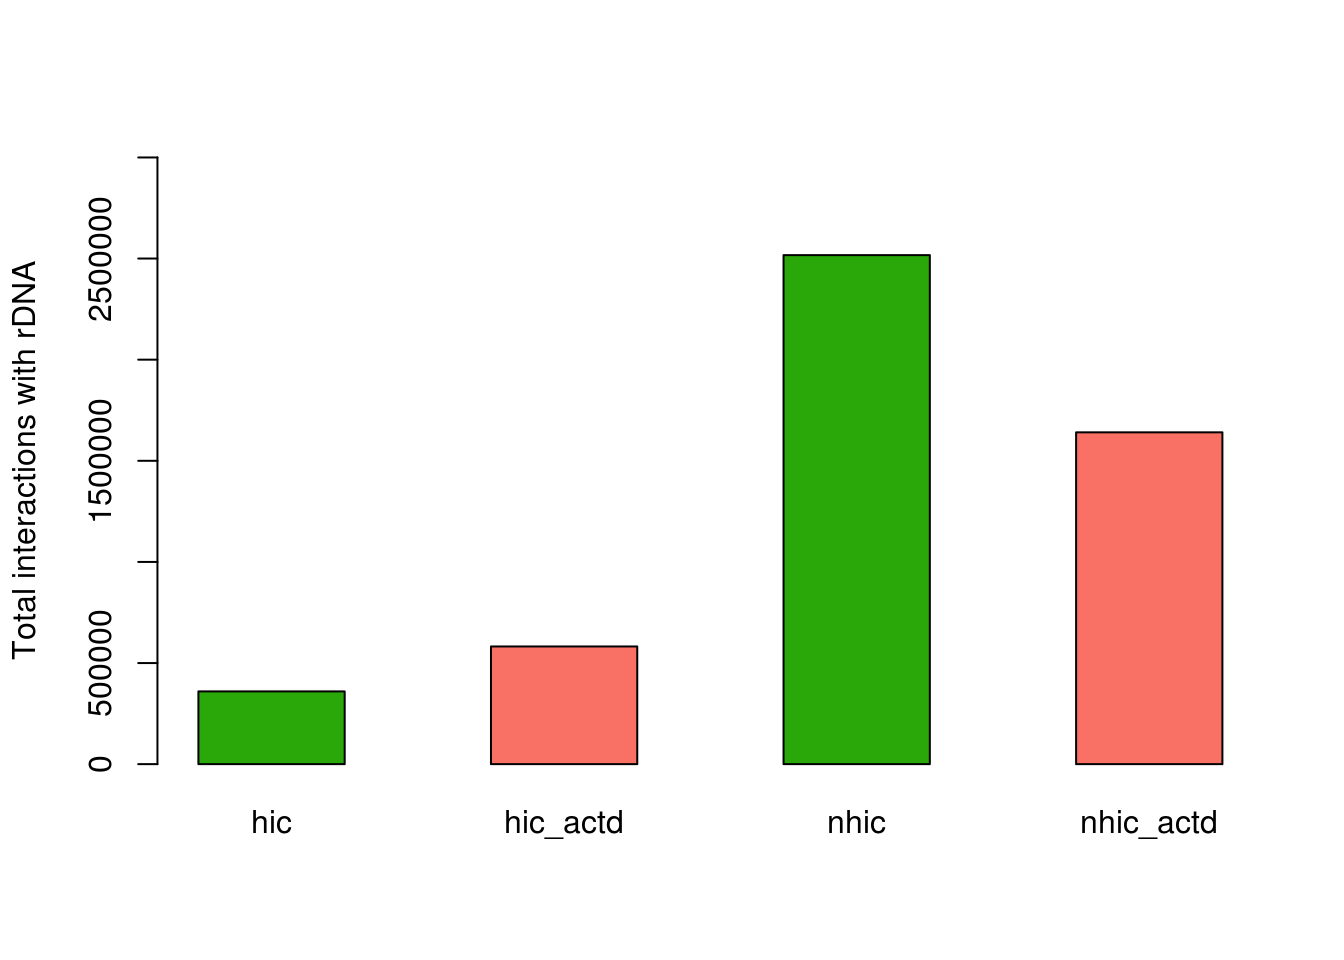
6.2 Fig 5B
counts = data.frame(hic=c(dim(hic[hic$V3==hic$V7,])[1],dim(hic[hic$V3!=hic$V7,])[1])/dim(hic)[1],hic_actd=c(dim(hic_actd[hic_actd$V3==hic_actd$V7,])[1],dim(hic_actd[hic_actd$V3!=hic_actd$V7,])[1])/dim(hic_actd)[1],nhic=c(dim(nhic[nhic$V3==nhic$V7,])[1],dim(nhic[nhic$V3!=nhic$V7,])[1])/dim(nhic)[1],nhic_actd=c(dim(nhic_actd[nhic_actd$V3==nhic_actd$V7,])[1],dim(nhic_actd[nhic_actd$V3!=nhic_actd$V7,])[1])/dim(nhic_actd)[1])
barplot(as.matrix(counts), main="",
        xlab="", col=c("#0F7CF4","#CC5C54"),
beside=F,ylab = 'Proportion of cis/trans interactions with rDNA') 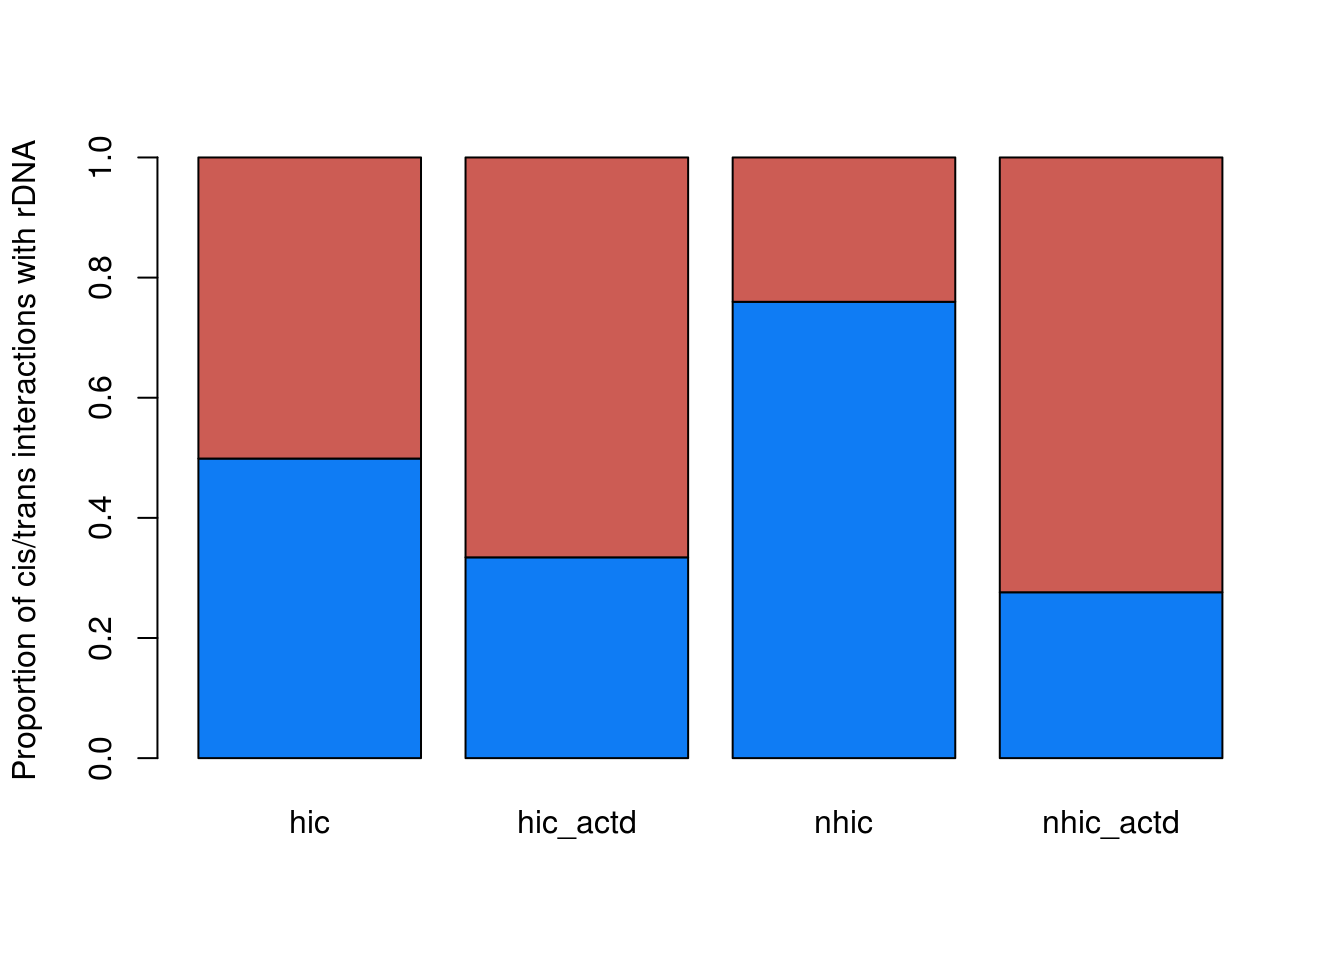
6.3 Fig 5C
hela_rDNA_hotspot = read.table('data/nhic')
hela_rDNA_hotspot.ActD = read.table('data/nhic_actd')
hotspot.matrix = matrix(rep(0,46),nrow = 2,ncol = 23)
chr_info = read.table('chr_info')
for(chrom_index in c(1:22)){
        chrom_name = paste0('chr',chrom_index)
        chrom.hotspot.table = hela_rDNA_hotspot[hela_rDNA_hotspot$V1==chrom_name,]
        chrom.hotspot.ActD.table = hela_rDNA_hotspot.ActD[hela_rDNA_hotspot.ActD$V1==chrom_name,]
        hotspot.matrix[1,chrom_index] = sum(chrom.hotspot.table[,3] - chrom.hotspot.table[,2]) / chr_info[chr_info$V1==chrom_name,2]
        hotspot.matrix[2,chrom_index] = sum(chrom.hotspot.ActD.table[,3] - chrom.hotspot.ActD.table[,2]) / chr_info[chr_info$V1==chrom_name,2]
}
par(mar=c(3,3,2,1),family="Arial",font=1)
barplot(hotspot.matrix,beside = T,col=c("#42B256","#CC5C55"),border = F,space = c(0,0.8),width = 5,xaxt="n",yaxt="n",ylim=c(0,0.001))
axis(side = 2,at=seq(0,0.001,0.0005),labels = F,cex.axis=2,lwd=1,tck=-0.05)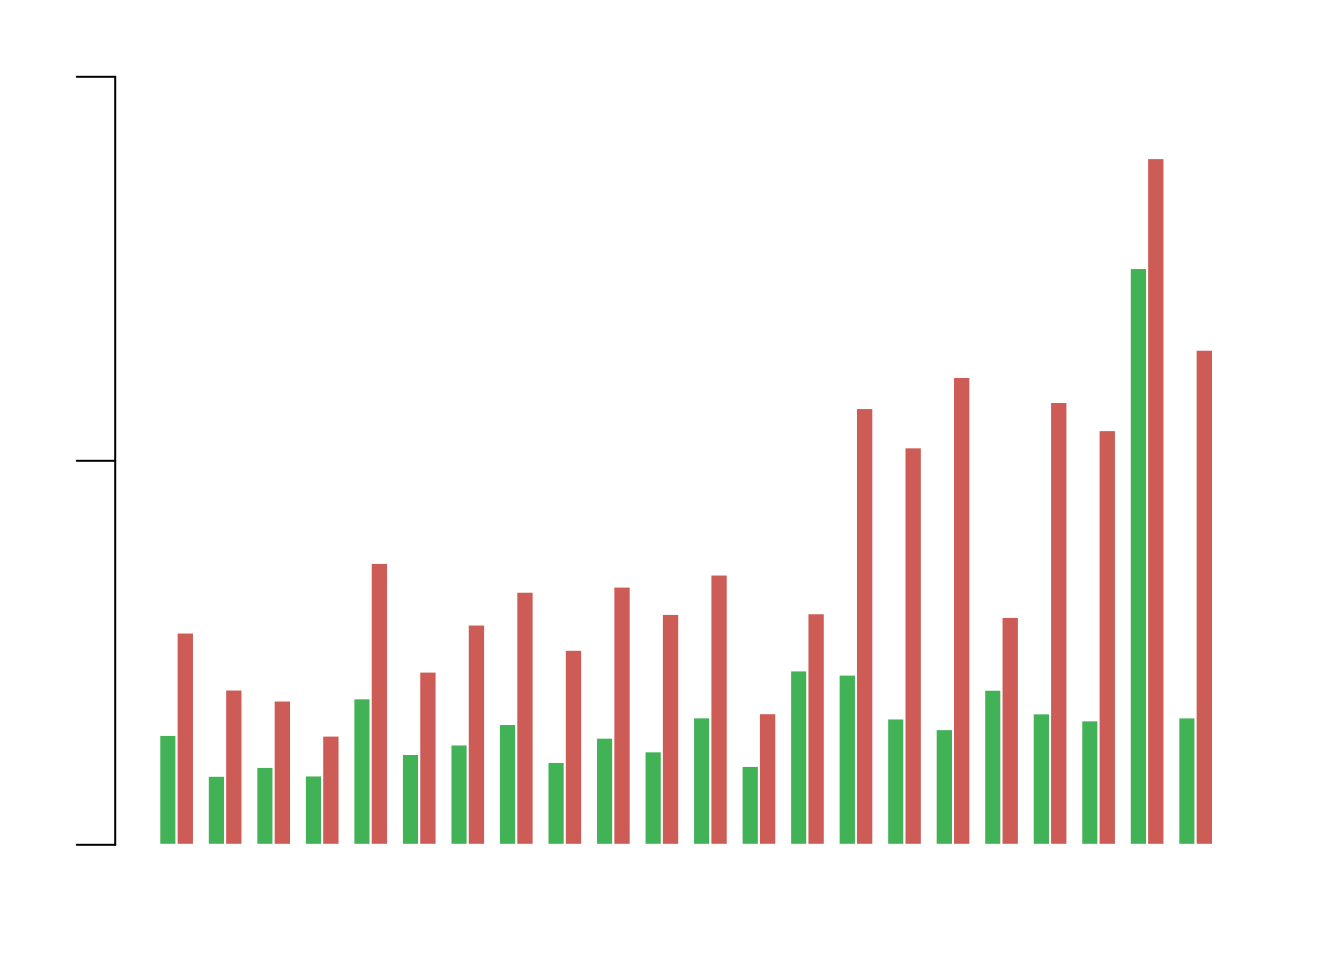
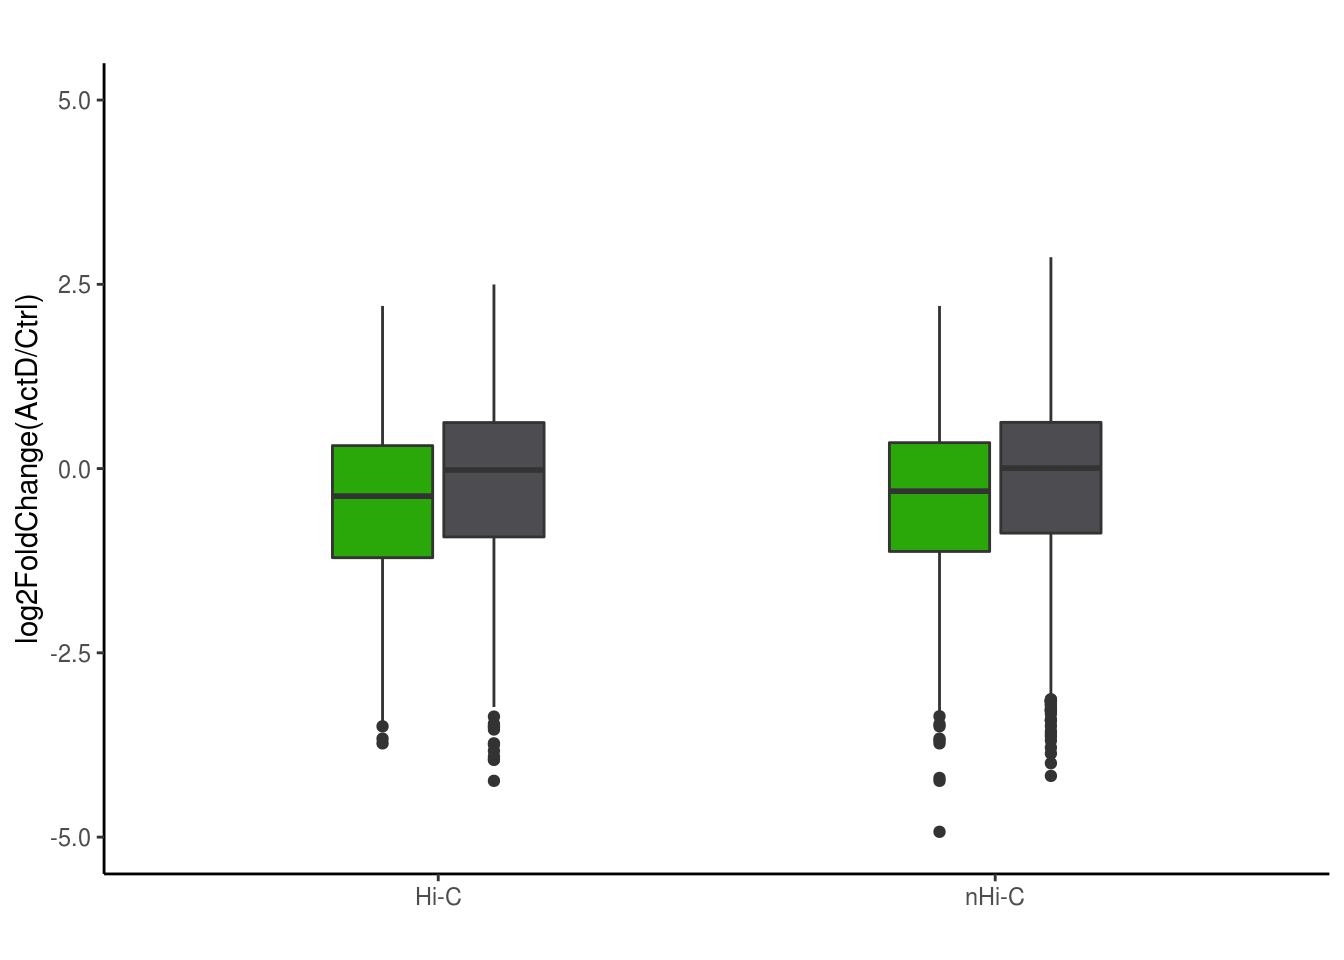
6.4 Fig 5D
t = read.table('data/hic_gene_count')
t = t[t$V5>10,]
row.names(t) = paste0(t$V1,':',t$V2,'-',t$V3,'-',t$V4)
t$id = row.names(t)
tt = read.table('data/nhic_gene_count')
tt = tt[tt$V5>20,]
row.names(tt) = paste0(tt$V1,':',tt$V2,'-',tt$V3,'-',tt$V4)
tt$id = row.names(tt)
DEG2 = read.table('DEG2',row.names = 1,header = T)
df = data.frame(log2FC = c(DEG2[unique(t$V4),2],DEG2[sample(1:12963,1205),2],DEG2[unique(tt$V4),2],DEG2[sample(1:12963,1782),2]),group = c(rep('Hi-C',1205), rep('Hic ActD',1205),rep('nhic',1782),rep('nhic_actd',1782)),dose = c(rep('Hi-C',1205*2),rep('nHi-C',1782*2)))
library(ggplot2)
bp <- ggplot(df, aes(x=dose, y=log2FC, fill=group)) +
        geom_boxplot(width=0.4)+
        scale_fill_manual(values=c("#2BA809", "#4D4D51","#2BA809", "#4D4D51"))+
        labs(title="",x="", y = "log2FoldChange(ActD/Ctrl)")+ylim(-5,5)
bp + theme_classic()+theme(legend.position = 'none')