25.7 Example: B12 deficiency

A study in New Zealand (Gammon et al. 2012) examined B12 deficiencies in ‘predominantly overweight/obese women of South Asian origin living in Auckland,’ some of whom were on a vegetarian diet and some of whom were on a non-vegetarian diet. One RQ was:
What is the odds ratio of these women being B12 deficient, comparing vegetarians to non-vegetarians?
The parameter is the population OR, comparing the odds of being B12 deficient, for vegetarians to non-vegetarians.
The data appear in Table 25.5. From the jamovi output (Fig. 25.9) or SPSS output (Fig. 25.10), the OR (and 95% CI) is \(3.15\) (\(1.08\) to \(9.24\)). The numerical summary table (Table 25.6) and graphical summary (Fig. 25.8). can hence be constructed.
| B12 deficient | Not B12 deficient | Total | |
|---|---|---|---|
| Vegetarians | 8 | 26 | 34 |
| Non-vegetarians | 8 | 82 | 90 |
| Total | 16 | 108 | 124 |
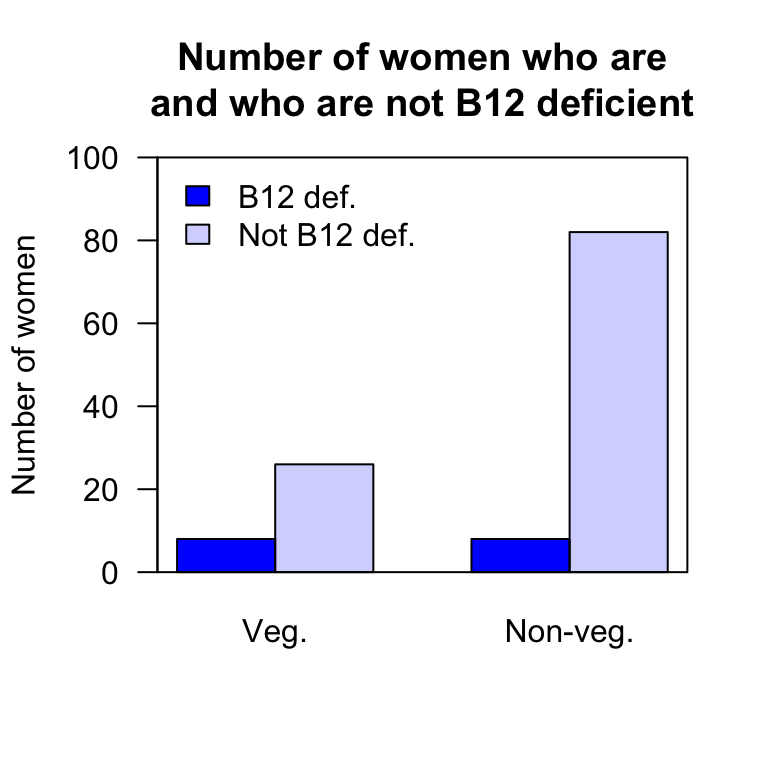
FIGURE 25.8: A side-by-side barchart comparing the number of women B12 deficient
| Odds B12 deficient | Percentage B12 deficient | Sample size | |
|---|---|---|---|
| Vegetarians: | 0.3077 | 23.5% | 34 |
| Non-vegetarians: | 0.0976 | 8.9% | 90 |
| Odds ratio: | 3.15 |
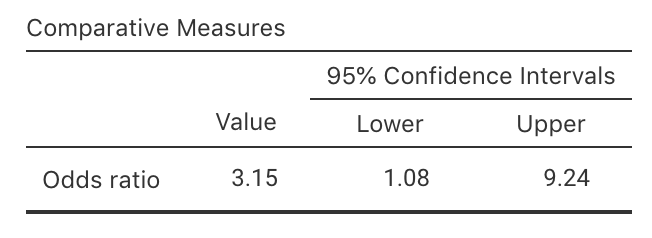
FIGURE 25.9: jamovi output for the B12 data
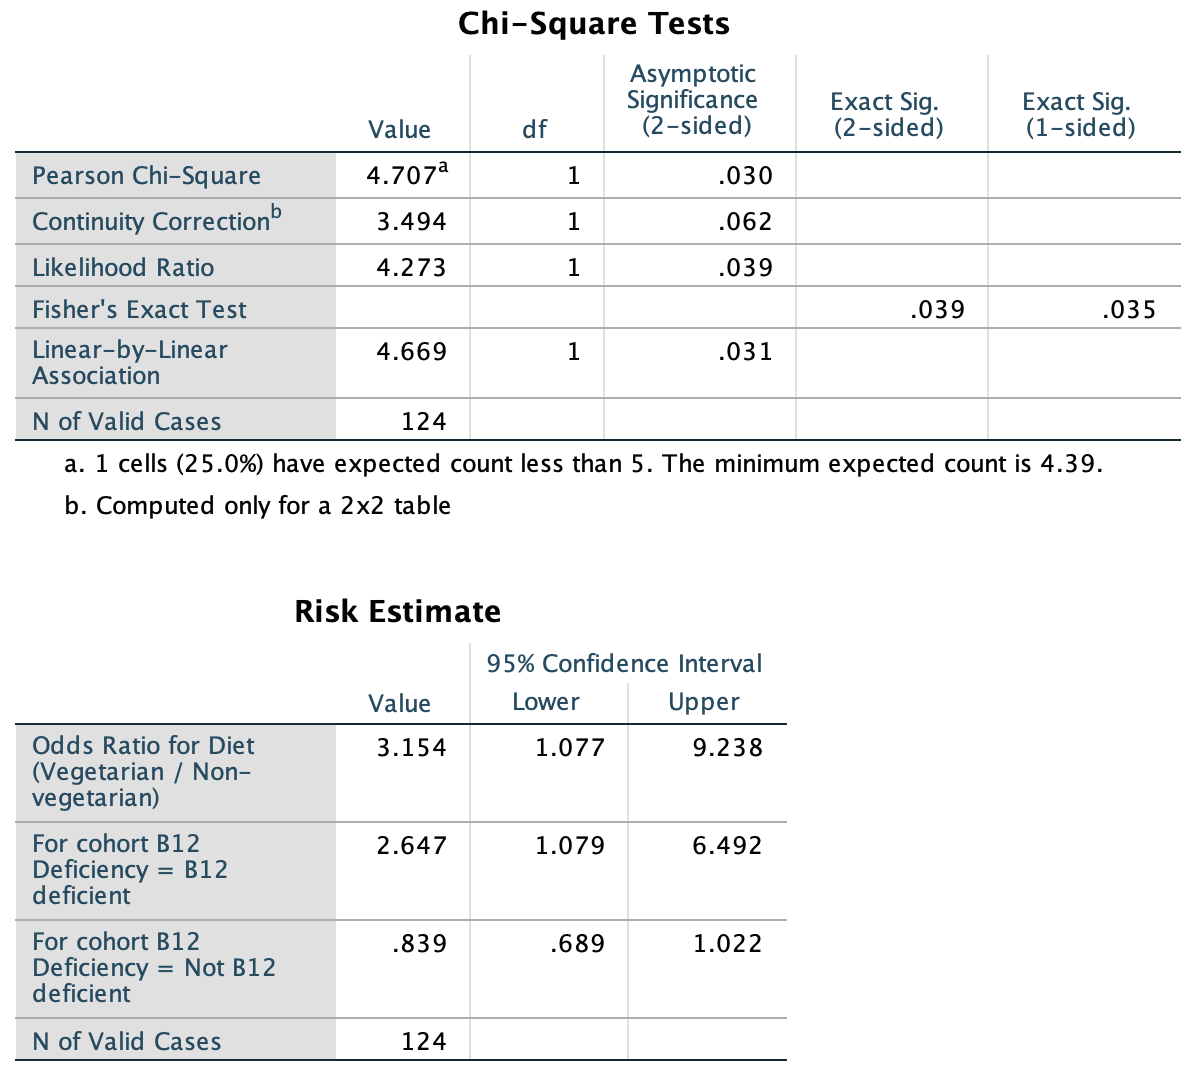
FIGURE 25.10: SPSS output for the B12 data
To check if these results statistically valid, notice that the text under the first table of SPSS output (Fig. 25.10) says:
1 cells (25.0%) have expected count less than 5. The minimum expected count is 4.39.
This a warning that one expected count is less than 5. Nonetheless, only one cell has an expected count less than five, and only just under 5, so we shouldn’t be too concerned about statistical validity (but it should be noted).
We write:
Based on the sample, a 95% CI for the OR of being B12 deficient is from 1.08 to 9.24 (comparing vegetarians to non-vegetarians).