2.8 Interactive documents
R Markdown documents can also generate interactive content. There are two types of interactive R Markdown documents: you can use the HTML Widgets framework, or the Shiny framework (or both). They will be described in more detail in Chapter 16 and Chapter 19, respectively.
2.8.1 HTML widgets
The HTML Widgets framework is implemented in the R package htmlwidgets (Vaidyanathan et al. 2023), interfacing JavaScript libraries that create interactive applications, such as interactive graphics and tables. Several widget packages have been developed based on this framework, such as DT (Xie, Cheng, and Tan 2023), leaflet (Cheng, Schloerke, et al. 2023), and dygraphs (Vanderkam et al. 2018). Visit https://www.htmlwidgets.org to know more about widget packages as well as how to develop a widget package by yourself.
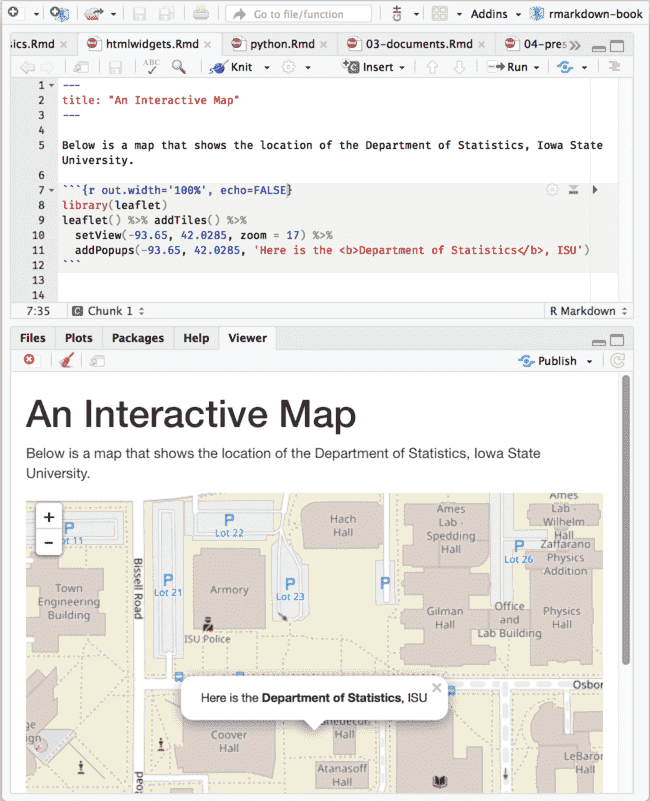
Figure 2.7 shows an interactive map created via the leaflet package, and the source document is below:
---
title: "An Interactive Map"
---

Below is a map that shows the location of the
Department of Statistics, Iowa State University.

```{r out.width='100%', echo=FALSE}
library(leaflet)
leaflet() %>% addTiles() %>%
  setView(-93.65, 42.0285, zoom = 17) %>%
  addPopups(
    -93.65, 42.0285,
    'Here is the <b>Department of Statistics</b>, ISU'
  )
```
FIGURE 2.7: An R Markdown document with a leaflet map widget.
Although HTML widgets are based on JavaScript, the syntax to create them in R is often pure R syntax.
If you include an HTML widget in a non-HTML output format, such as a PDF, knitr will try to embed a screenshot of the widget if you have installed the R package webshot (Chang 2023) and the PhantomJS package (via webshot::install_phantomjs()).
2.8.2 Shiny documents
The shiny package (Chang et al. 2023) builds interactive web apps powered by R. To call Shiny code from an R Markdown document, add runtime: shiny to the YAML metadata, like in this document:
---
title: "A Shiny Document"
output: html_document
runtime: shiny
---

A standard R plot can be made interactive by wrapping
it in the Shiny `renderPlot()` function. The `selectInput()`
function creates the input widget to drive the plot.

```{r eruptions, echo=FALSE}
selectInput(
  'breaks', label = 'Number of bins:',
  choices = c(10, 20, 35, 50), selected = 20
)

renderPlot({
  par(mar = c(4, 4, .1, .5))
  hist(
    faithful$eruptions, as.numeric(input$breaks),
    col = 'gray', border = 'white',
    xlab = 'Duration (minutes)', main = ''
  )
})
```
Figure 2.8 shows the output, where you can see a dropdown menu that allows you to choose the number of bins in the histogram.

FIGURE 2.8: An R Markdown document with a Shiny widget.
You may use Shiny to run any R code that you like in response to user actions. Since web browsers cannot execute R code, Shiny interactions occur on the server side and rely on a live R session. By comparison, HTML widgets do not require a live R session to support them, because the interactivity comes from the client side (via JavaScript in the web browser).
You can learn more about Shiny at https://shiny.rstudio.com.
HTML widgets and Shiny elements rely on HTML and JavaScript. They will work in any R Markdown format that is viewed in a web browser, such as HTML documents, dashboards, and HTML5 presentations.