4 Within-city variations
Based on results from previous analysis, retrieve tuned green-up threshold and leaf-flower lag. Calculate predicted pollen emission time from green-up time and tuned parameters.
Visualize variations in leaf and pollen phenology within and across taxa in Detroit 2018.
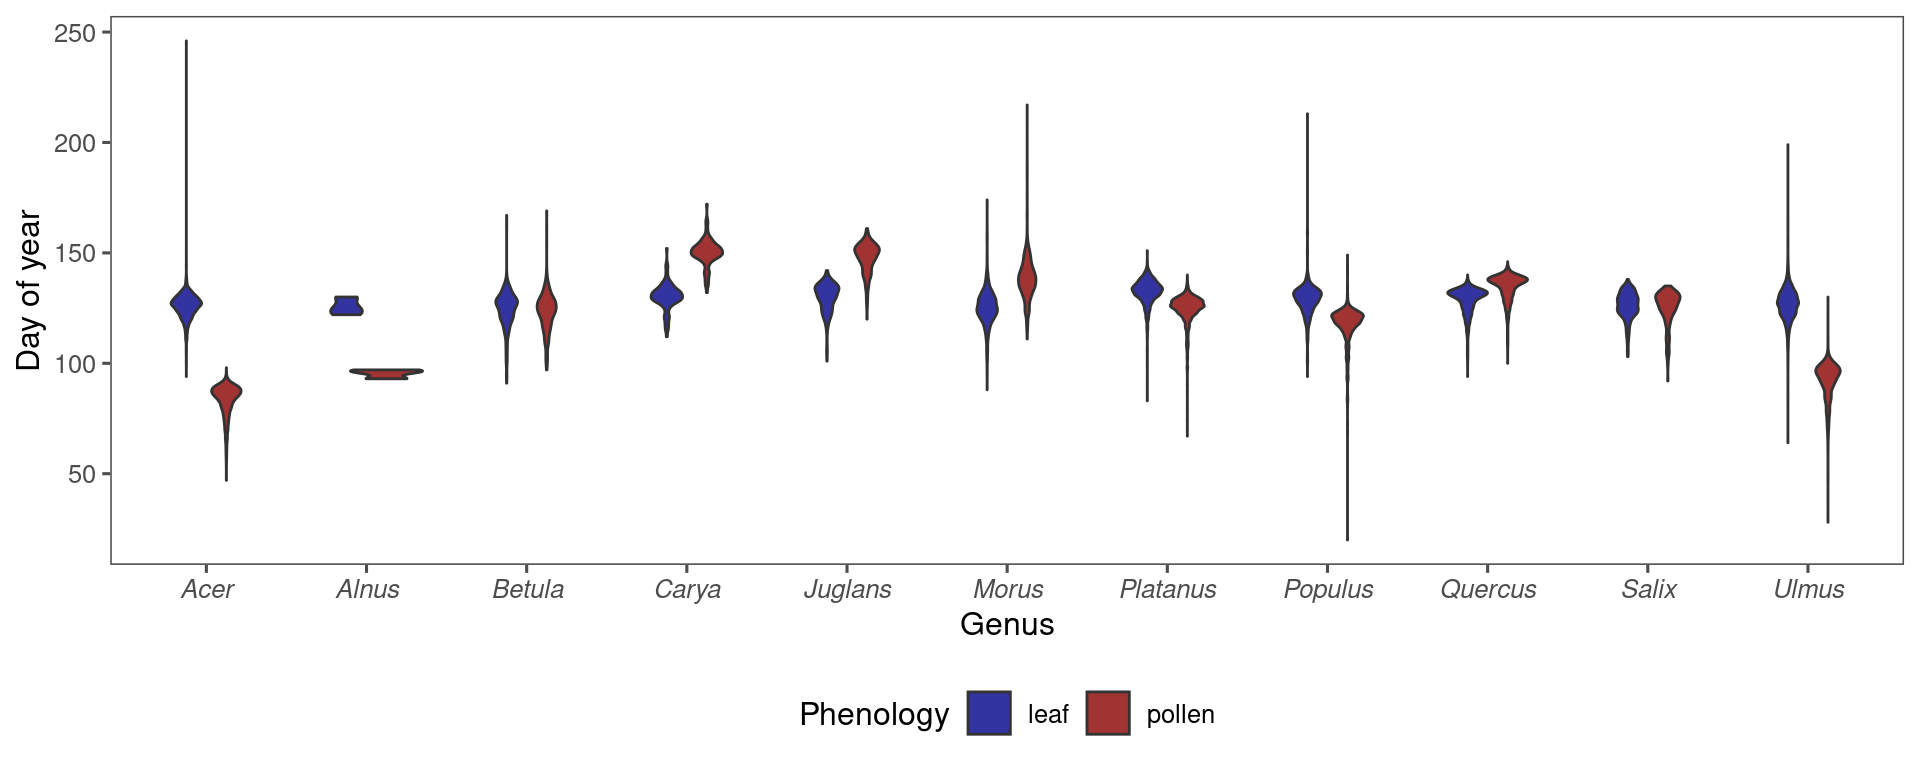
Figure 4.1: Distributions of PlanetScope-derived tree-level spring 50% green-up time (representing leaf phenology) and peak pollen emission time (representing pollen phenology) in Detroit in the spring of 2018. Colors indicate different genera.
Visualize spatial variation of pollen phenology in Detroit 2018.
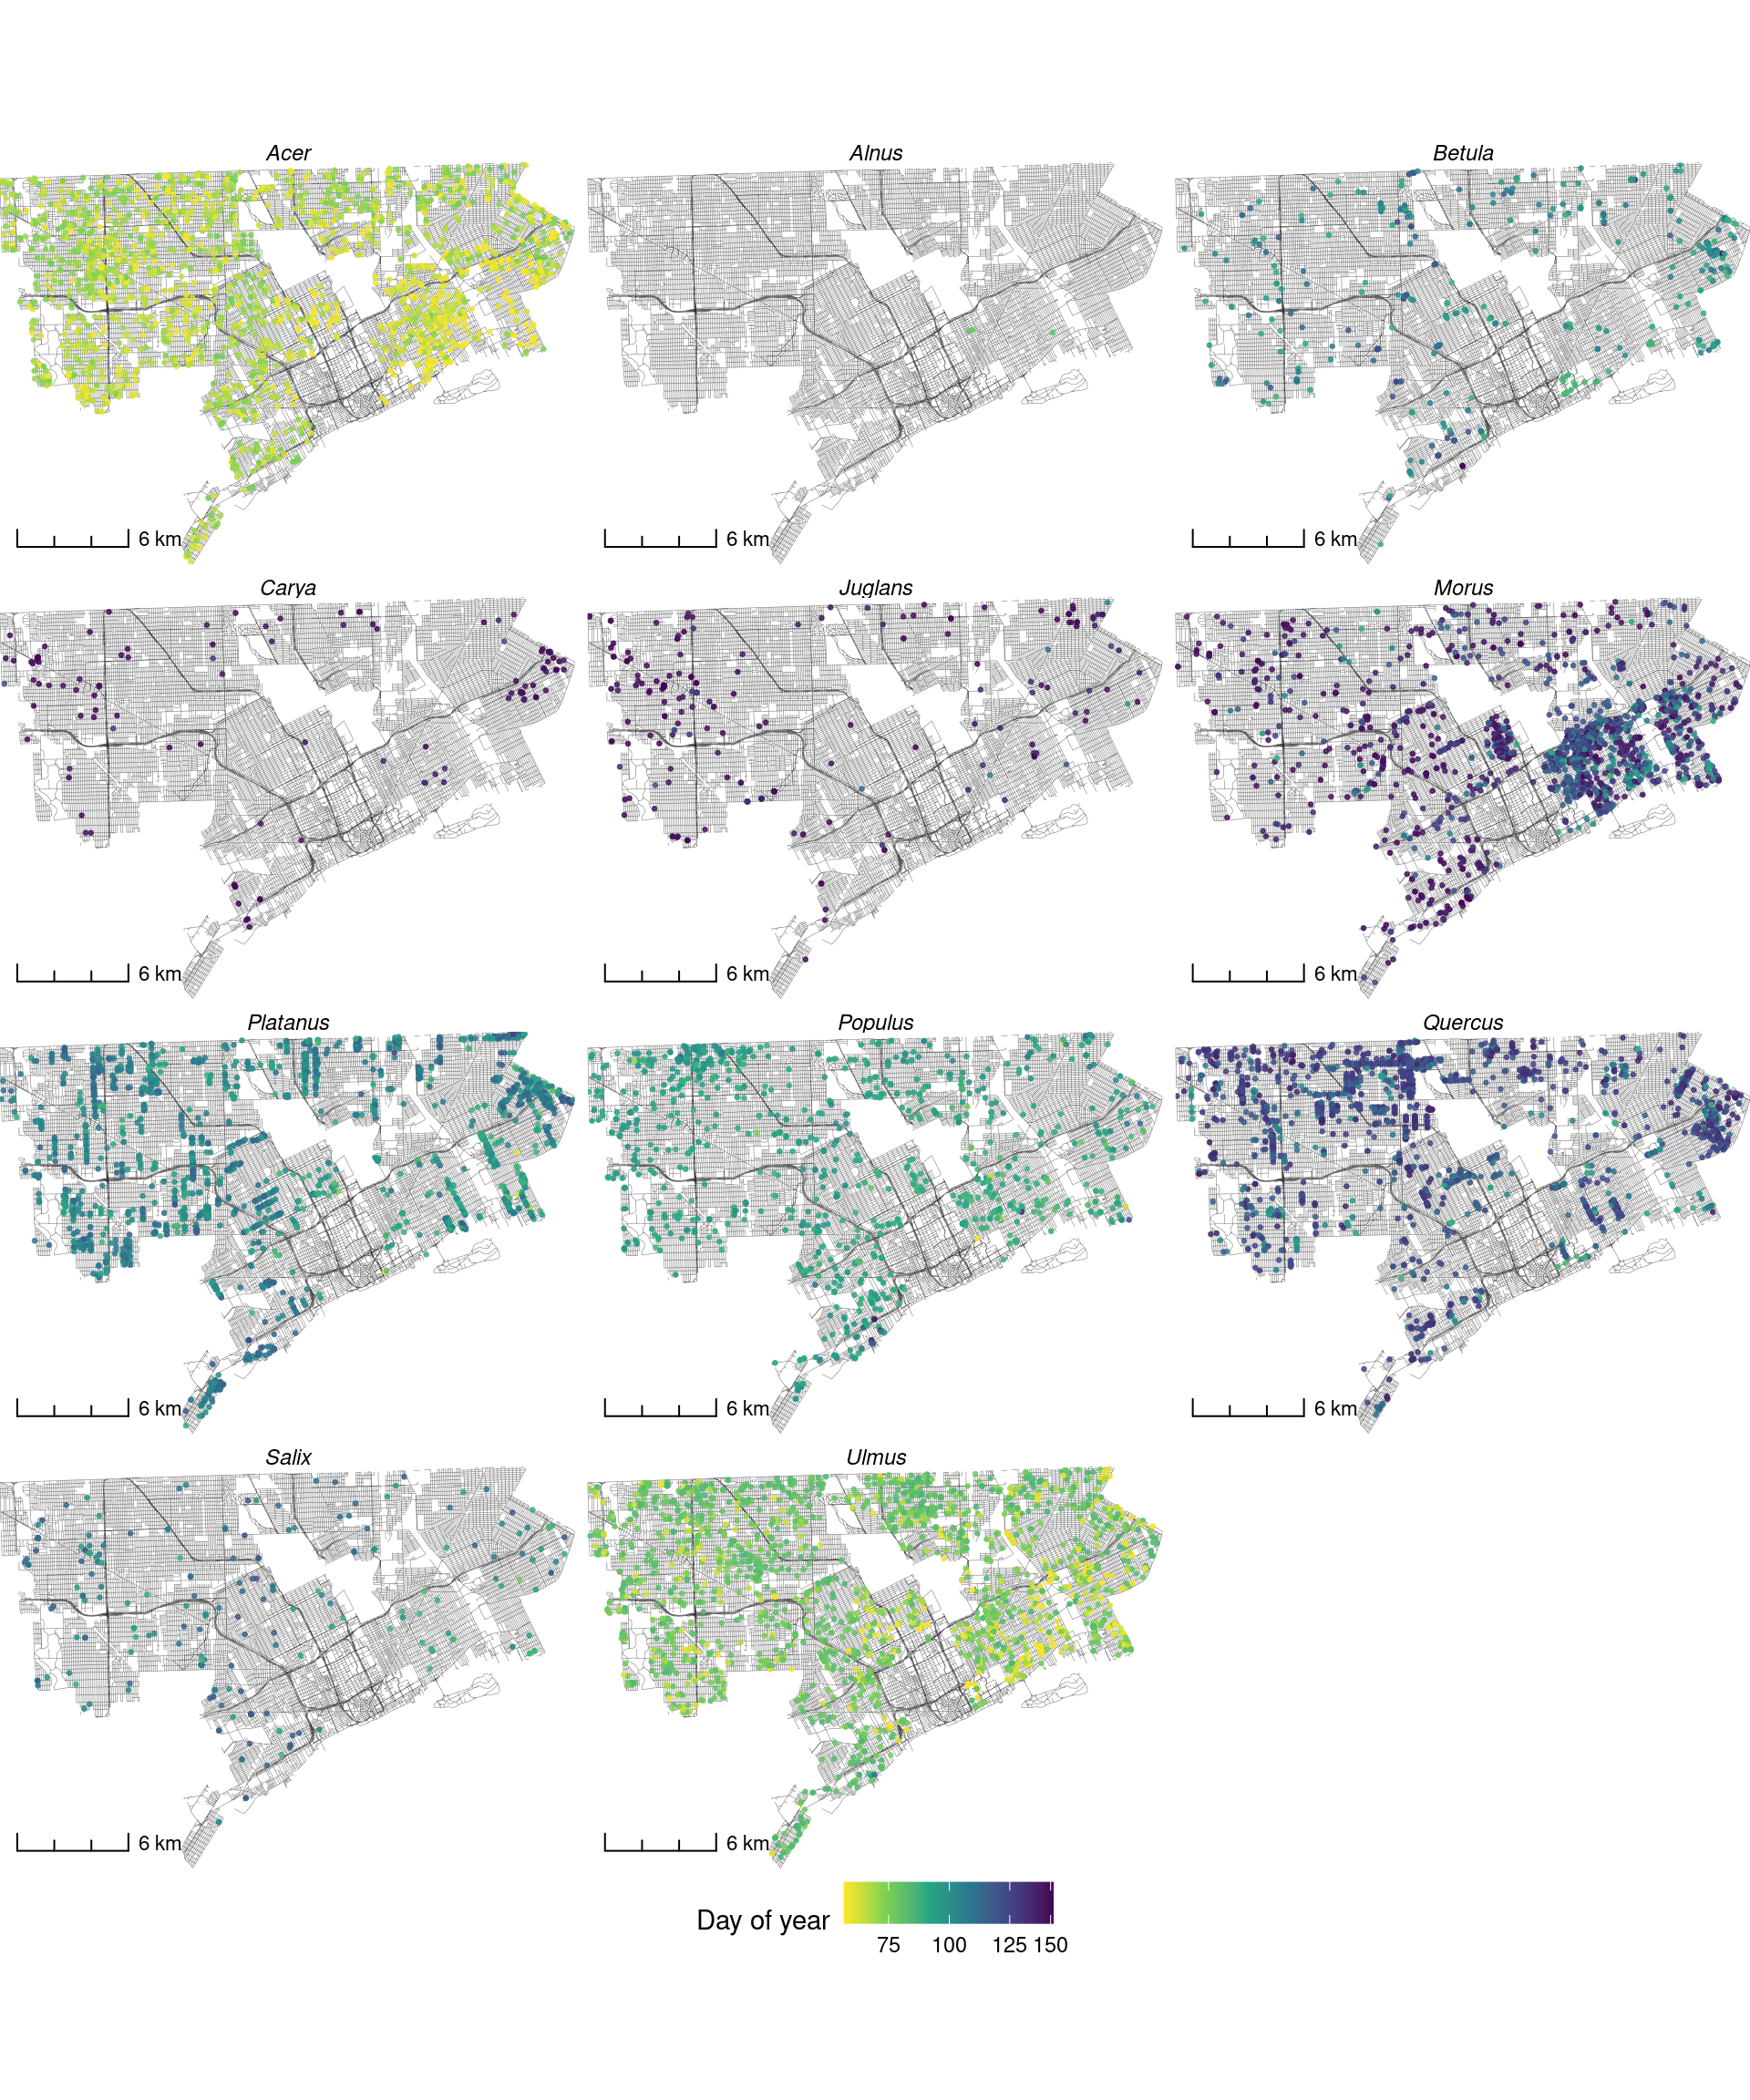
Figure 4.2: Maps of PlanetScope-derived pollen emission time in Detroit street trees in the spring of 2018, one for each genera. A brighter color indicates an earlier estimated pollen emission time from an individual tree, showing spatial heterogeneity in pollen phenology within each city and genus.