Cost Summary
## Warning: package 'scales' was built under R version 4.3.3
| Dredge_Scallop |
29 |
599579 |
451753 |
| Gillnet |
10 |
119434 |
112268 |
| Handgear |
59 |
68241 |
30327 |
| Longline |
4 |
231125 |
214448 |
| Pot/Trap |
161 |
245764 |
174661 |
| Seine |
3 |
637865 |
436876 |
| Trawl |
29 |
504983 |
358071 |
| Dogfish |
3 |
63940 |
49381 |
| Fluke, BSB, Scup |
23 |
149243 |
85939 |
| Groundfish |
7 |
597651 |
555304 |
| Herring |
4 |
596946 |
491938 |
| Highly Migratory Species |
34 |
109658 |
59160 |
| Lobster |
153 |
248121 |
177961 |
| Monkfish |
3 |
141591 |
152922 |
| Other |
17 |
227303 |
116530 |
| Scallop |
28 |
615621 |
523855 |
| Squid, Mackerel, Butterfish |
9 |
595536 |
327253 |
| Striped Bass |
12 |
20582 |
15712 |
| Dredge_Scallop-Scallop |
28 |
615621 |
523855 |
| Gillnet-Monkfish |
3 |
141591 |
152922 |
| Gillnet-Other |
7 |
109937 |
108006 |
| Handgear-Fluke, BSB, Scup |
8 |
38340 |
25672 |
| Handgear-Highly Migratory Species |
31 |
91558 |
40733 |
| Handgear-Other |
10 |
71469 |
46960 |
| Handgear-Striped Bass |
10 |
16649 |
13530 |
| Longline-Highly Migratory Species |
3 |
296689 |
247766 |
| Pot/Trap-Fluke, BSB, Scup |
6 |
79618 |
86039 |
| Pot/Trap-Lobster |
151 |
249435 |
177961 |
| Pot/Trap-Other |
4 |
356436 |
146950 |
| Trawl-Fluke, BSB, Scup |
9 |
294239 |
321032 |
| Trawl-Groundfish |
5 |
778262 |
595534 |
| Trawl-Other |
7 |
393869 |
195462 |
| Trawl-Squid, Mackerel, Butterfish |
8 |
668494 |
490242 |
## Warning: package 'ggplot2' was built under R version 4.3.3
| Dredge_Scallop |
29 |
0.17 |
0.20 |
0.09 |
0.47 |
0.07 |
| Gillnet |
10 |
0.19 |
0.07 |
0.35 |
0.30 |
0.10 |
| Handgear |
59 |
0.46 |
0.18 |
0.16 |
0.13 |
0.07 |
| Longline |
4 |
0.41 |
0.18 |
0.17 |
0.17 |
0.08 |
| Pot/Trap |
161 |
0.23 |
0.10 |
0.28 |
0.30 |
0.08 |
| Seine |
3 |
0.14 |
0.08 |
0.02 |
0.73 |
0.04 |
| Trawl |
29 |
0.24 |
0.13 |
0.16 |
0.41 |
0.06 |

| Dogfish |
3 |
0.20 |
0.08 |
0.36 |
0.25 |
0.10 |
| Fluke, BSB, Scup |
23 |
0.29 |
0.11 |
0.21 |
0.32 |
0.07 |
| Groundfish |
7 |
0.21 |
0.08 |
0.22 |
0.41 |
0.08 |
| Herring |
4 |
0.21 |
0.29 |
0.09 |
0.34 |
0.07 |
| Highly Migratory Species |
34 |
0.45 |
0.17 |
0.15 |
0.17 |
0.07 |
| Lobster |
153 |
0.23 |
0.10 |
0.28 |
0.30 |
0.09 |
| Monkfish |
3 |
0.16 |
0.05 |
0.50 |
0.21 |
0.08 |
| Other |
17 |
0.20 |
0.08 |
0.18 |
0.48 |
0.05 |
| Scallop |
28 |
0.17 |
0.20 |
0.09 |
0.47 |
0.07 |
| Squid, Mackerel, Butterfish |
9 |
0.28 |
0.12 |
0.13 |
0.41 |
0.05 |
| Striped Bass |
12 |
0.28 |
0.27 |
0.23 |
0.08 |
0.13 |
| Dredge_Scallop-Scallop |
28 |
0.17 |
0.20 |
0.09 |
0.47 |
0.07 |
| Gillnet-Monkfish |
3 |
0.16 |
0.05 |
0.50 |
0.21 |
0.08 |
| Gillnet-Other |
7 |
0.20 |
0.08 |
0.26 |
0.35 |
0.11 |
| Handgear-Fluke, BSB, Scup |
8 |
0.41 |
0.21 |
0.31 |
0.02 |
0.06 |
| Handgear-Highly Migratory Species |
31 |
0.47 |
0.16 |
0.14 |
0.16 |
0.06 |
| Handgear-Other |
10 |
0.47 |
0.18 |
0.17 |
0.09 |
0.09 |
| Handgear-Striped Bass |
10 |
0.30 |
0.33 |
0.19 |
0.03 |
0.14 |
| Longline-Highly Migratory Species |
3 |
0.41 |
0.19 |
0.15 |
0.17 |
0.08 |
| Pot/Trap-Fluke, BSB, Scup |
6 |
0.37 |
0.19 |
0.24 |
0.14 |
0.06 |
| Pot/Trap-Lobster |
151 |
0.23 |
0.10 |
0.28 |
0.30 |
0.09 |
| Pot/Trap-Other |
4 |
0.23 |
0.10 |
0.30 |
0.33 |
0.04 |
| Trawl-Fluke, BSB, Scup |
9 |
0.26 |
0.08 |
0.20 |
0.39 |
0.07 |
| Trawl-Groundfish |
5 |
0.21 |
0.07 |
0.23 |
0.41 |
0.08 |
| Trawl-Other |
7 |
0.18 |
0.26 |
0.10 |
0.40 |
0.06 |
| Trawl-Squid, Mackerel, Butterfish |
8 |
0.28 |
0.12 |
0.13 |
0.42 |
0.05 |
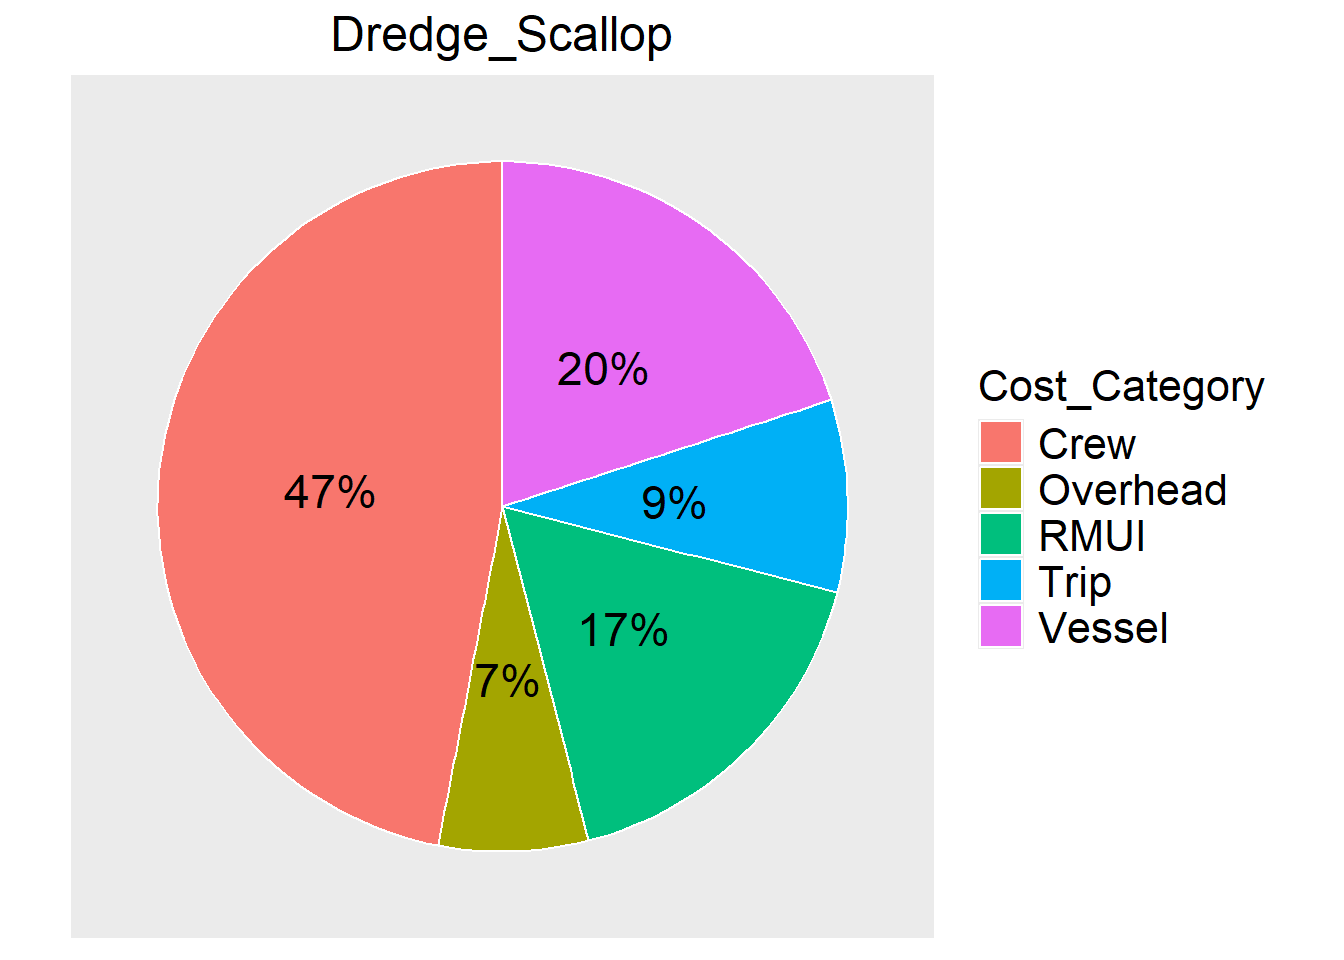
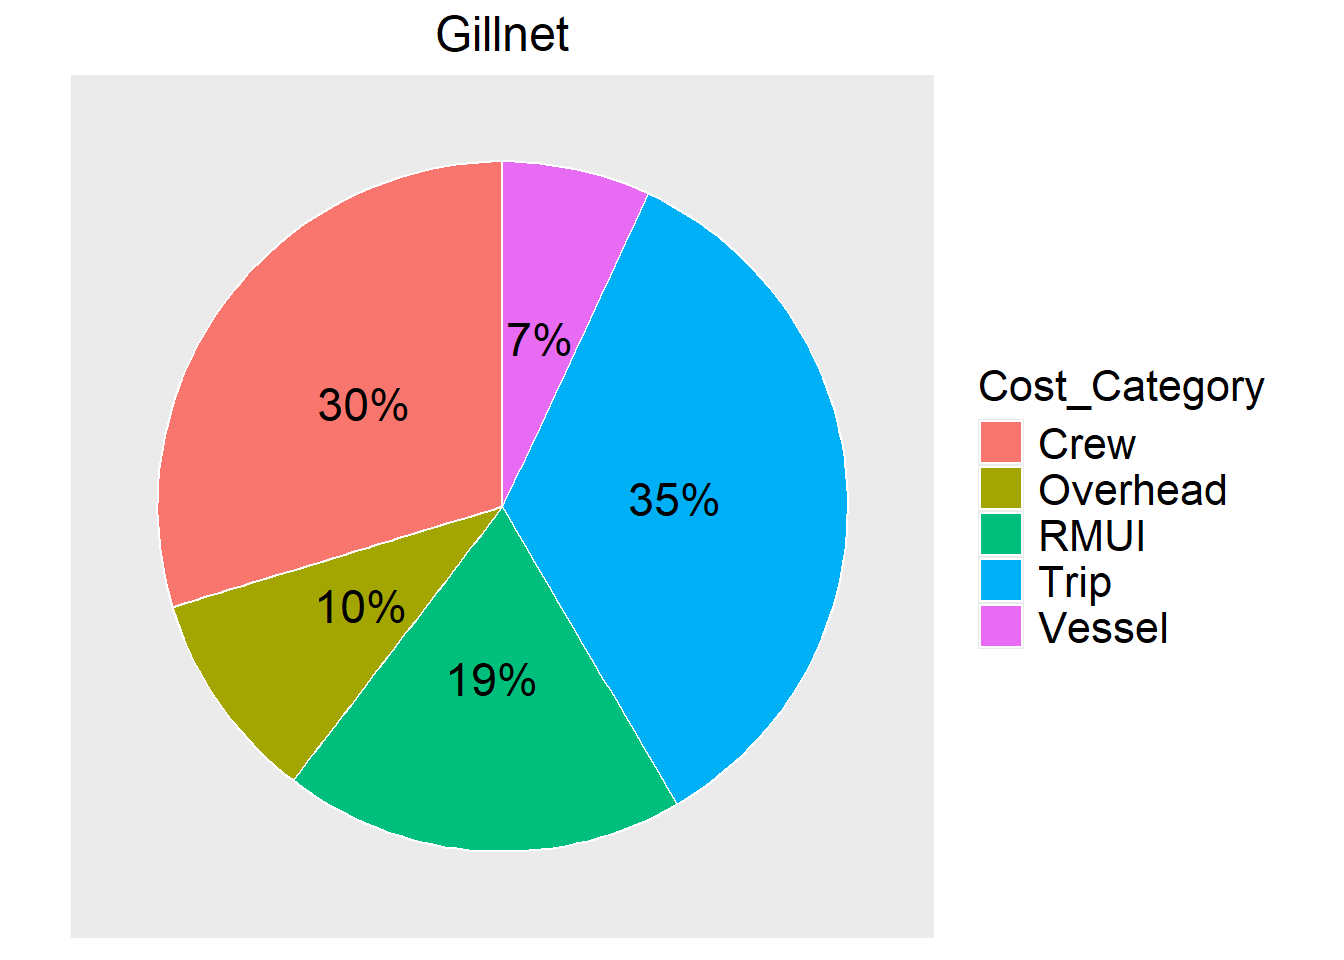
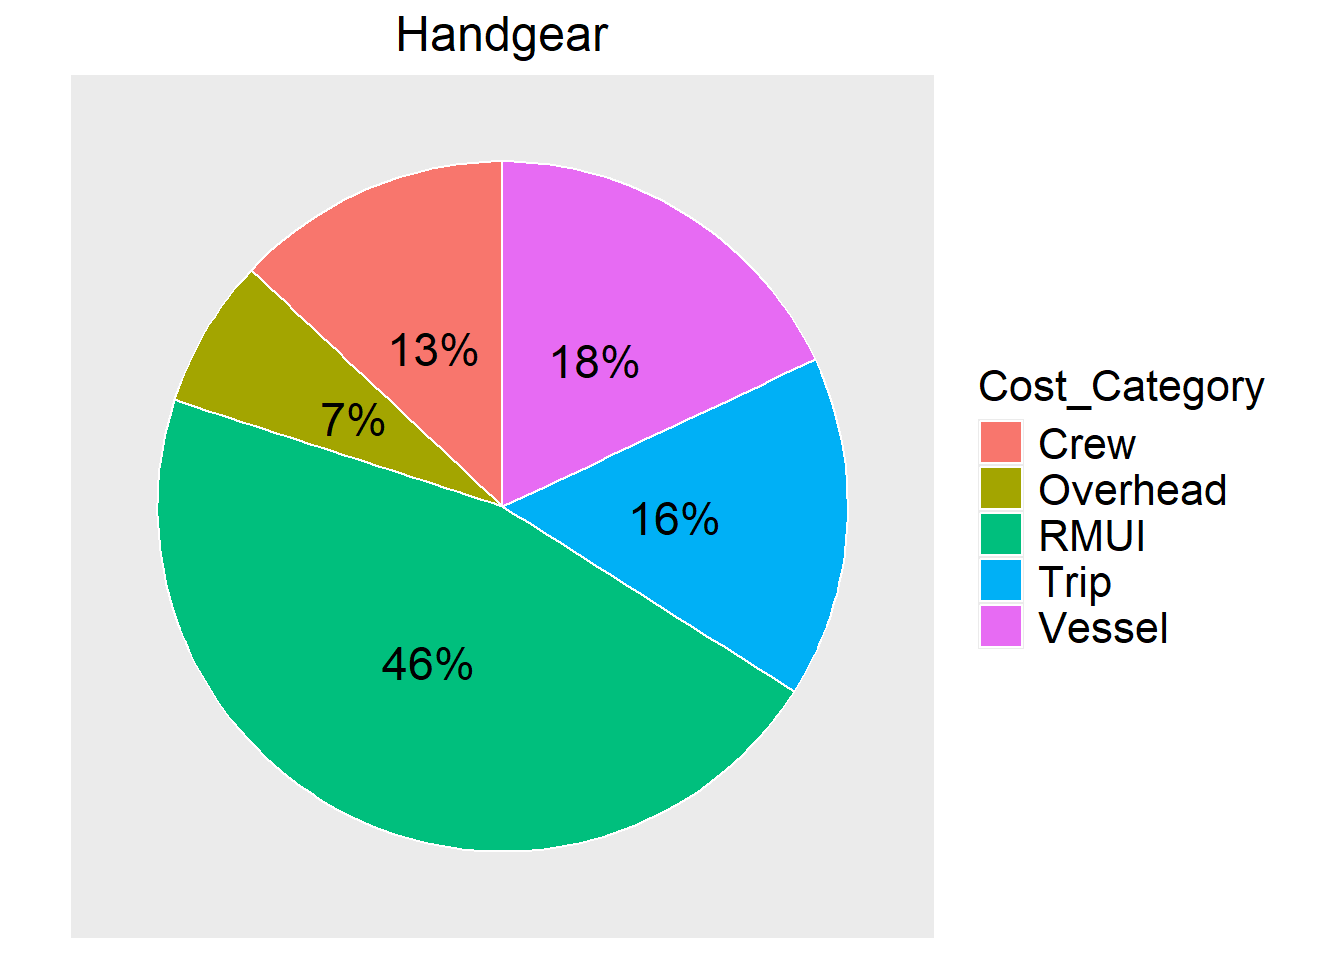
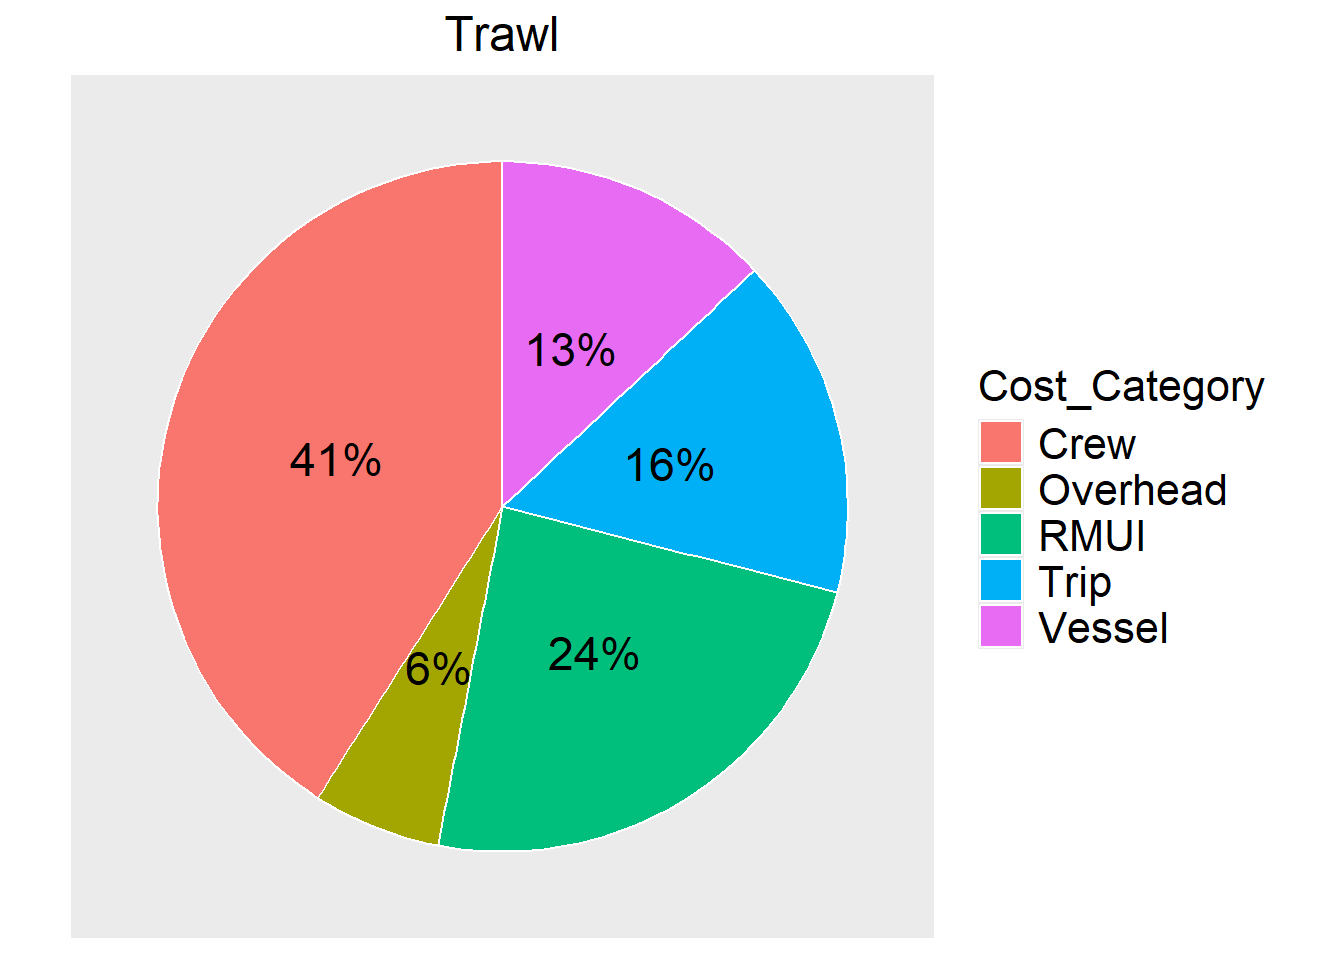
By primary gear, the order of costs from highest to lowest follows the same order as with revenue- scallop dredge, trawl, pot/trap, gillnet, handgear. scallop dredge and trawl again have mean and median values more than twice of those for other gear types. These highest cost gear types are crew-intensive with crew expenses accounting for nearly 50% of total costs among scallop dredge and trawl vessels. Pot/trap and gillnet vessels have the highest share of trip expenses. For pot/trap vessels, this may be explained in part by the cost of bait. For handgear vessels, the lowest cost gear group, repair/maintenance is the largest share of costs. Overhead costs as a share of total are similar across primary gear groups, ranging from 7-10%.
By FMP, a number of fisheries have similar mean costs. Scallop vessels have the highest mean costs, though groundfish herring, and squid, mackerel, butterfish all have mean values within 5% of scallop vessels. A variety of primary species/fisheries are covered in the “Other” group including barracuda, bay scallop, cancer crab, eastern oyster, horseshoe crab, cutlassfish, king mackerel, menhaden, ribbonfish, shrimp, tautog, and whelk. The squid, mackerel, butterfish and scallop fisheries are the most crew-intensive, with crew expenses totaling 52% and 46% of total costs, respectively. The lobster fishery has relatively higher trip expenses than other FMPs, with 26% of total costs in this category.
When primary gear and FMP are combined, trawl-groundfish has the highest mean costs, while scallop dredge-scallop has the highest median costs. Within primary gear types, a considerable difference in costs is found across fisheries. For example, mean and median values for lobster pot/trap vessels are greater than those values for fluke, black sea bass, and scup pot/trap vessels. The top cost contributors are generally similar within a gear group and across fisheries. For example, all trawl fisheries have relatively high crew expenses. All handgear fisheries have relatively high repair/maintenance costs. Pot/trap fisheries have relatively high trip expenses, possibly due to the cost of bait.