7 Operating Profit
| primary_comm_gear_2022 | observations | mean_op | med_op |
|---|---|---|---|
| Dredge_Scallop | 29 | 528494 | 496487 |
| Gillnet | 10 | 40318 | 22337 |
| Handgear | 59 | 6837 | 2536 |
| Longline | 4 | 131331 | 135674 |
| Pot/Trap | 161 | 84157 | 58766 |
| Seine | 3 | 656754 | 274049 |
| Trawl | 29 | 367073 | 265336 |
| primary_comm_fmp_2022 | observations | mean_op | med_op |
|---|---|---|---|
| Dogfish | 3 | -1882 | 18446 |
| Fluke, BSB, Scup | 23 | 134987 | 12567 |
| Groundfish | 7 | 438165 | 203192 |
| Herring | 4 | 306647 | 355763 |
| Highly Migratory Species | 34 | 23052 | 968 |
| Lobster | 153 | 80473 | 61430 |
| Monkfish | 3 | -4947 | -12870 |
| Other | 17 | 139069 | 2592 |
| Scallop | 28 | 550482 | 525741 |
| Squid, Mackerel, Butterfish | 9 | 471288 | 321619 |
| Striped Bass | 12 | 10618 | 4353 |
| primary_gear_fmp_2022 | observations | mean_op | med_op |
|---|---|---|---|
| Dredge_Scallop-Scallop | 28 | 550482 | 525741 |
| Gillnet-Monkfish | 3 | -4947 | -12870 |
| Gillnet-Other | 7 | 59718 | 26404 |
| Handgear-Fluke, BSB, Scup | 8 | 9299 | 8169 |
| Handgear-Highly Migratory Species | 31 | 8932 | 636 |
| Handgear-Other | 10 | 2183 | 4375 |
| Handgear-Striped Bass | 10 | 3027 | 1615 |
| Longline-Highly Migratory Species | 3 | 168960 | 252903 |
| Pot/Trap-Fluke, BSB, Scup | 6 | 90529 | 37125 |
| Pot/Trap-Lobster | 151 | 79960 | 58823 |
| Pot/Trap-Other | 4 | 233043 | 62355 |
| Trawl-Fluke, BSB, Scup | 9 | 276347 | 91373 |
| Trawl-Groundfish | 5 | 578955 | 270521 |
| Trawl-Other | 7 | 146971 | 61430 |
| Trawl-Squid, Mackerel, Butterfish | 8 | 529303 | 322467 |
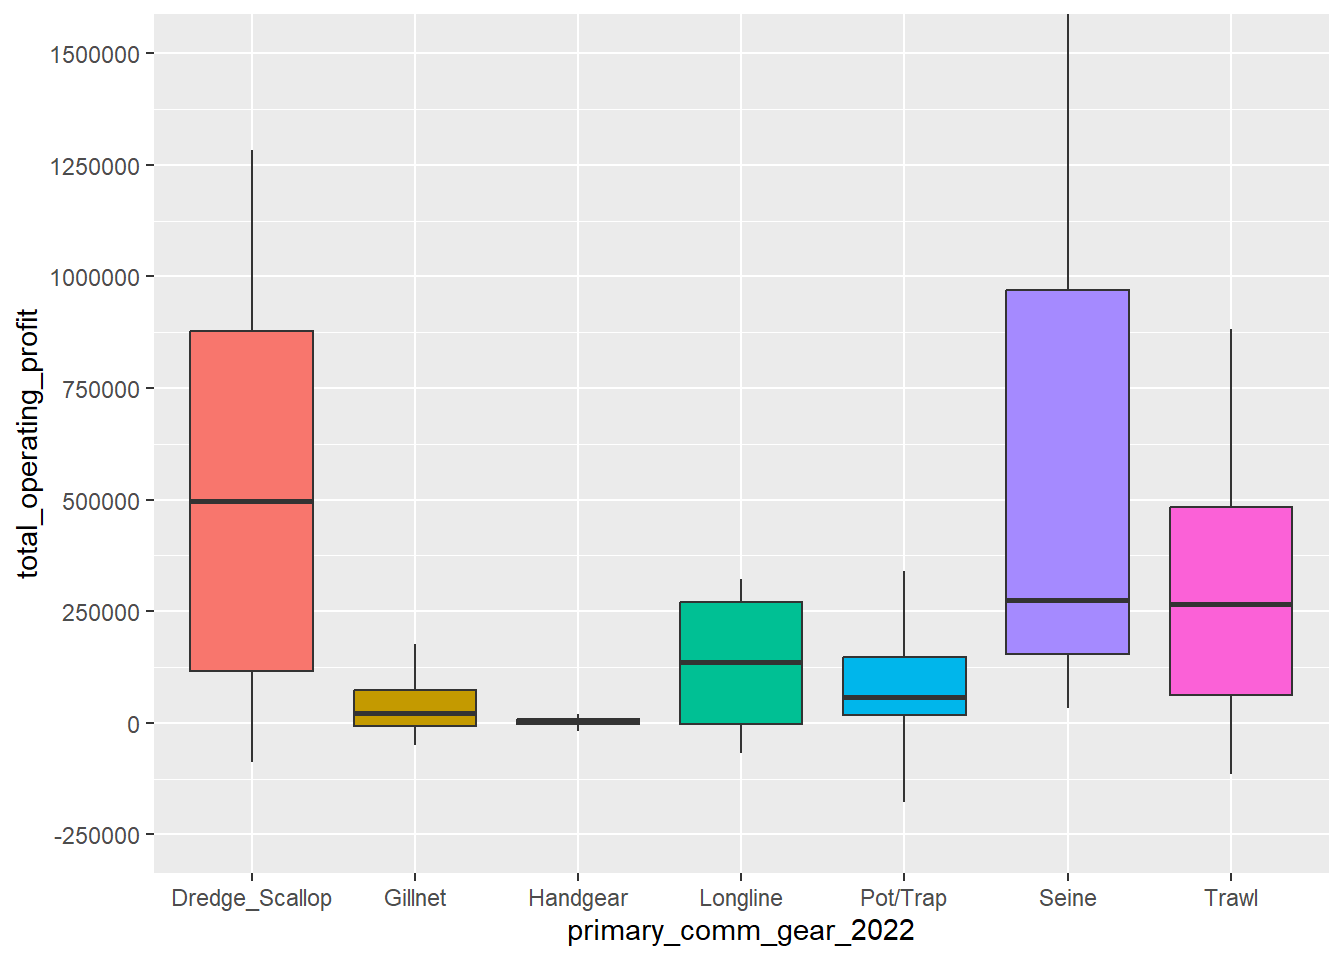
By primary gear, scallop dredge has considerably higher mean and median operating profit than other gear groups. Trawl has the second highest mean and median values, followed by pot/trap, gillnet, and handgear. For gillnet and trawl gear, mean values greatly exceed median values, indicating skewness in the distribution to the right. For pot/trap and scallop dredge, the difference between mean and median values is not as large. The boxplots emphasize the range of operating profit by gear group with the box extending past $750K for scallop dredge and ~$500k for trawl. Pot/trap and gillnet extend considerably less and handgear is close to $0.
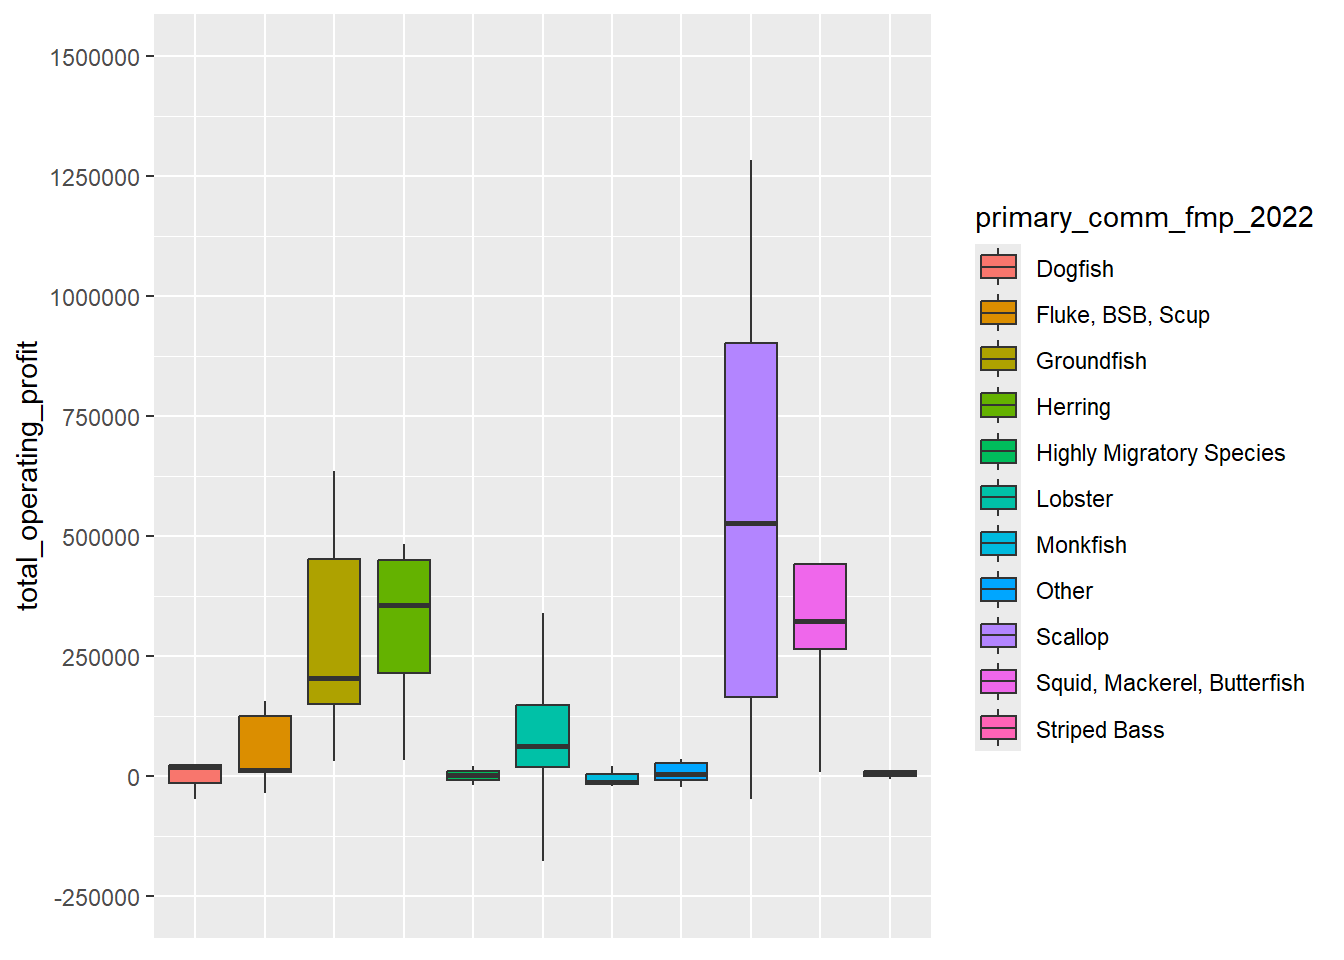
By FMP, scallop has higher mean and median operating profit than other fisheries. Squid, mackerel, butterfish has the second highest mean values, while herring has the second highest median values. Groundfish has the third highest mean values. For squid, mackerel, butterfish, groundfish, and summer flounder, black sea bass, scup, mean values greatly exceed median values, indicating skewness in the distribution to the right. For lobster and scallop, the difference between mean and median values is not as large. The boxplots emphasize the range of operating profit by gear group with the box extending past $750K for scallop dredge and close to $500k for groundfish, herring, and squid, mackerel, butterfish. Lobster extends to ~100k and other fisheries are close to $0.
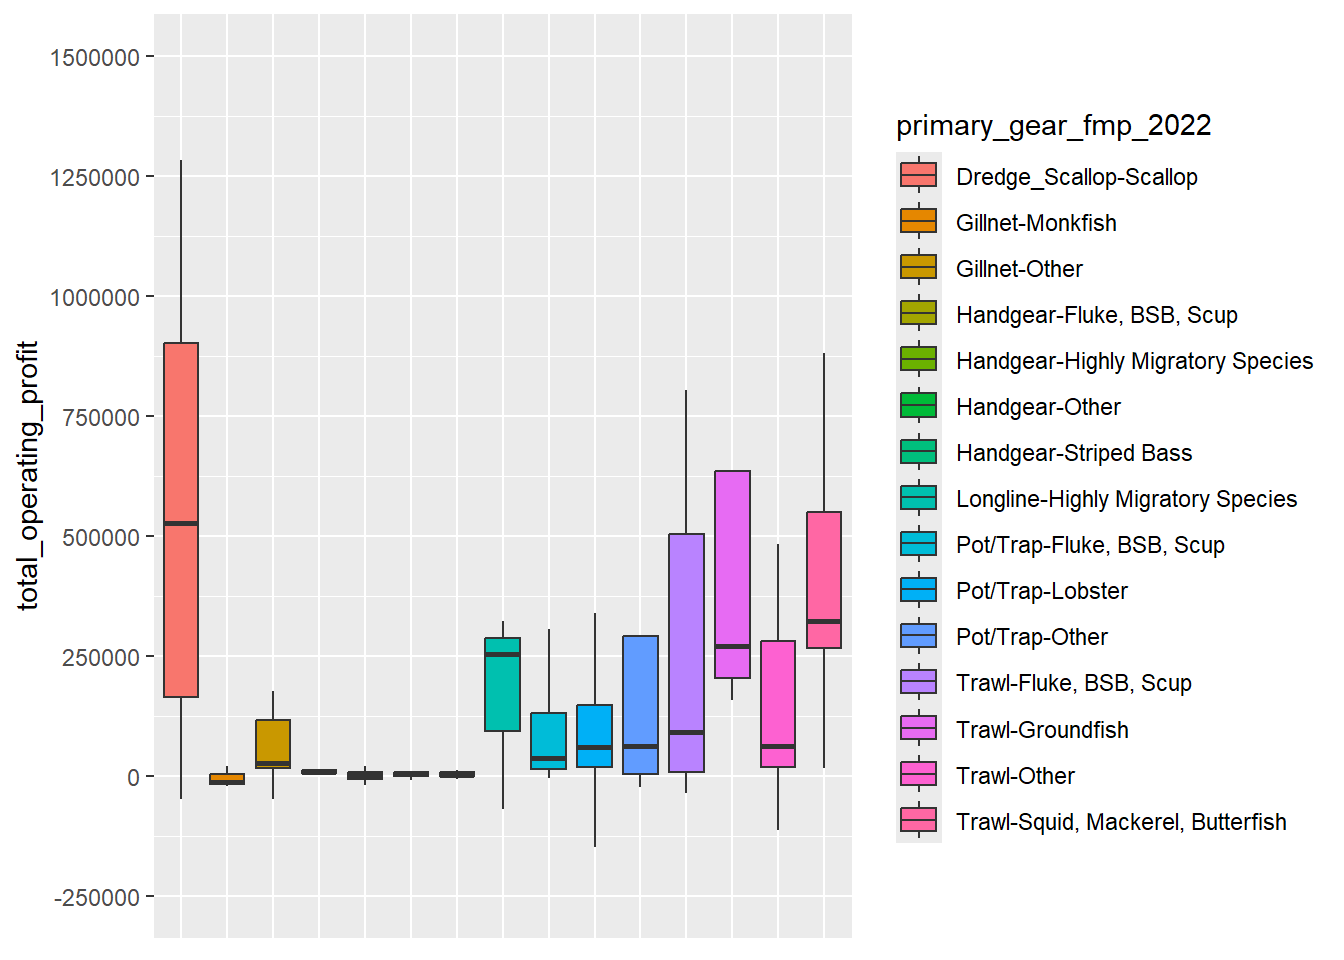
When primary gear and FMP are combined, trawl-groundfish has the highest mean operating profit, while scallop dredge-scallop has the highest median value. Within primary gear types, a considerable difference in operating profit is found across fisheries. For example, the mean value for squid trawl vessels is roughly twice that for fluke, black sea bass, and scup trawl vessels. Within the pot/trap gear group, summer flounder, black sea bass, scup vessels have a higher median value than for lobster but a lower median value.