1.3 Tree Diagrams
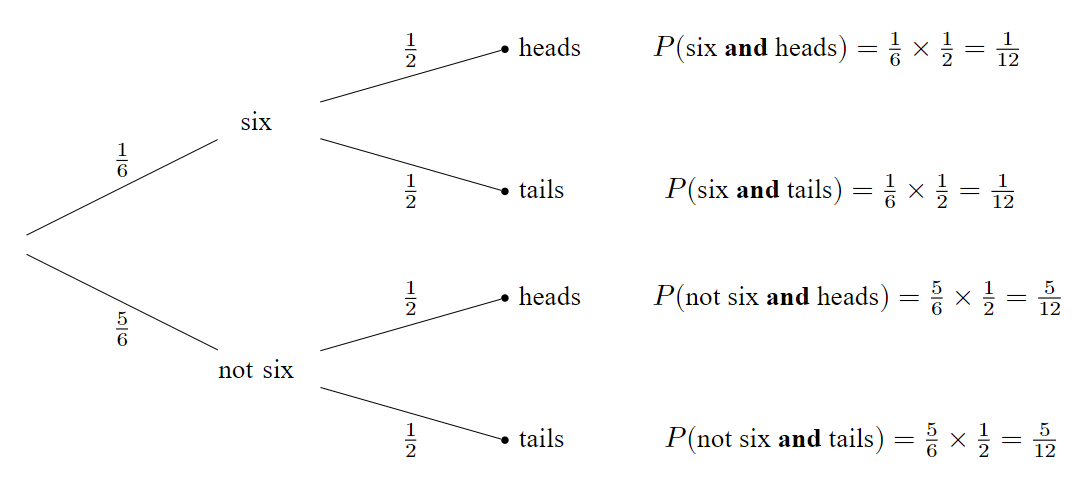
Tree diagrams can be created to map out the possible results of a random experiment, and they are especially useful when considering two or more events. For example, suppose a game involves rolling a fair, cubical die hoping for it to land on a 6, and tossing a fair coin:
Note:
- Every branch is clearly labeled with a probability.
- Each node is clearly described, such as “six”.
- Instead of not six you could instead write \(\overline{\text{six}}\).
- Sibling branches add to 1, as do all of the final and probabilities.
- Multiplying along branches gives the final probabilities.
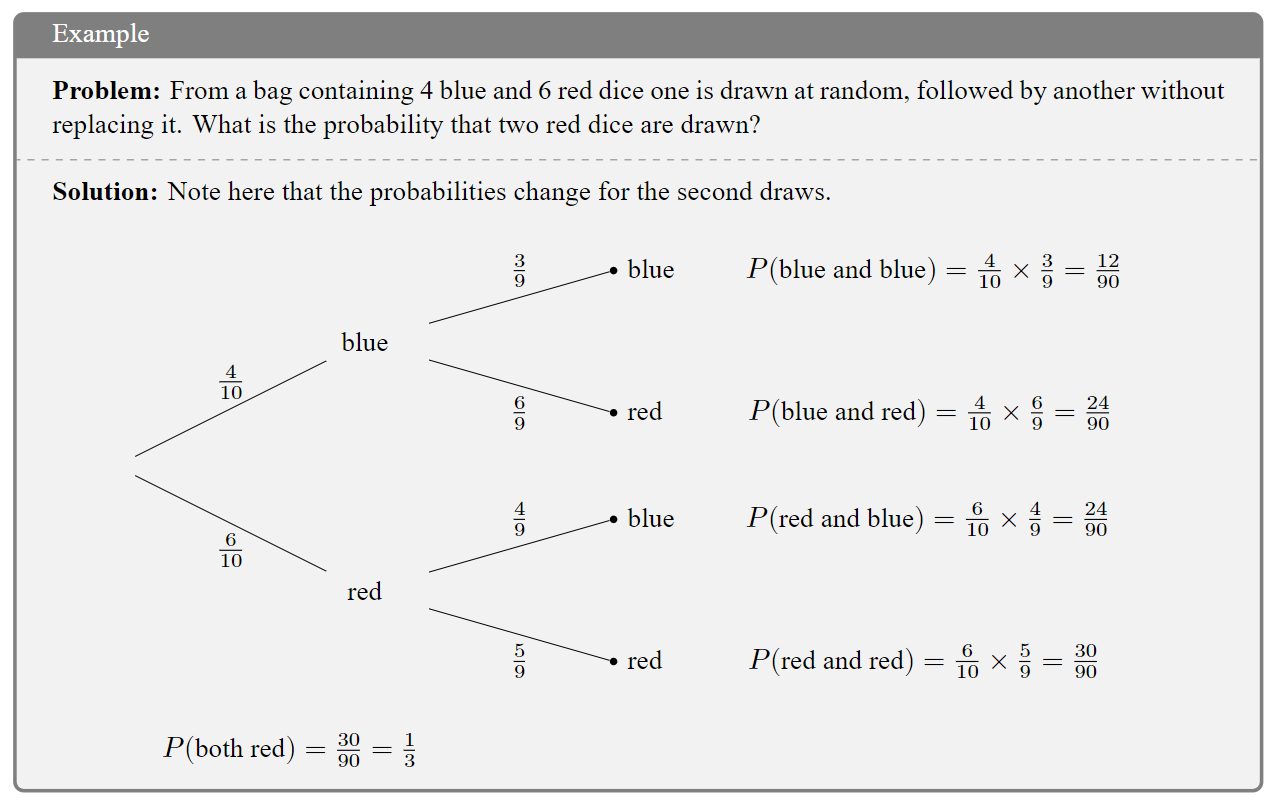
Note that in the tree diagram above the probability of obtaining heads or tails on the toss of a coin does not change depending on whether the roll of a die gives a six or not. In the example on the next page the probabilities on the second stage of the tree diagram do change depending on the result of the first stage. Pages 15 and 17 discuss this in more detail.