Chapter 5 Maps
Step by step instructions on how to make a map in ArcGIS.
5.1 Base Map
5.1.1 Polar Bear Populations in the Arctic
Find the basemap and working shapefiles for the map you want.
Download the basemap, basemap reference (labels), and the shapefiles.
Open them in ArcMap by clicking on Add Data.
If you want to change the colors of the map, right click on the layer and go to the Symbology tab. You can also double click on the color box.

Base Map
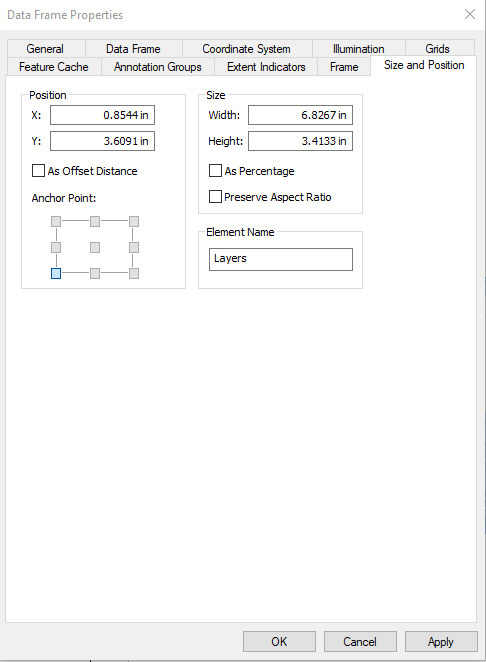
Set the coordinate system to WGS 1984 Web Mercator (auxiliary sphere) and set the size of the map to be equirectangular (6.8 x 3.4 in) in Data Frame Properties (right click on Layers in the table of contents and click Properties).

5.2 Adding a Legend
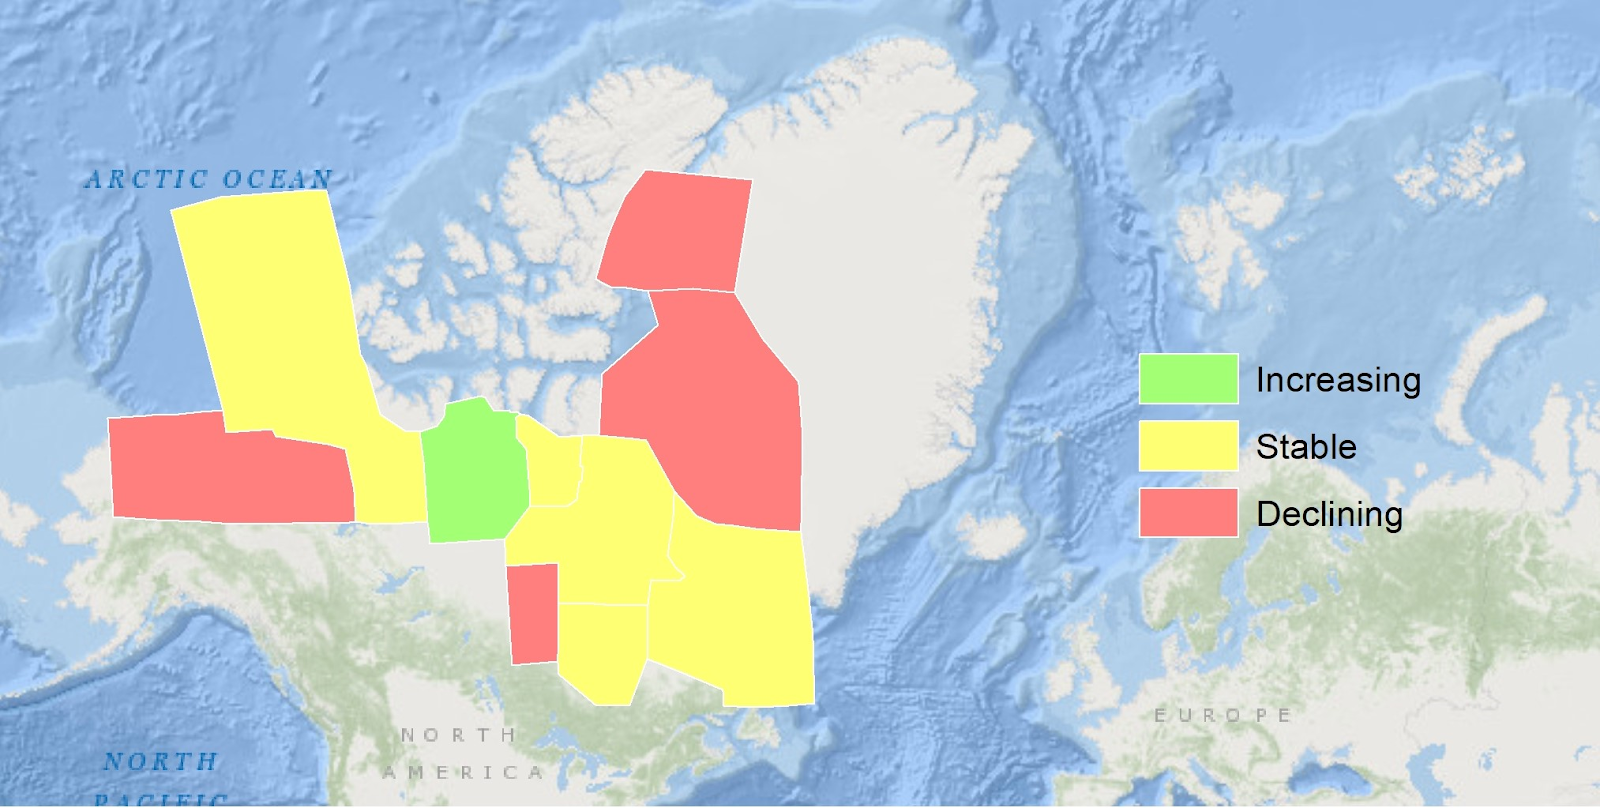
Go to Layout View. Click Insert -> Legend and edit as necessary.
Legend
5.3 Cropping/Zooming into a Map
5.3.1 Arctic Towns
If you want to display a useful map, but focus on a specific region, you will need:
- Shapefile with desired data
- Basemap containing desired region
- Geographic lines shapefile
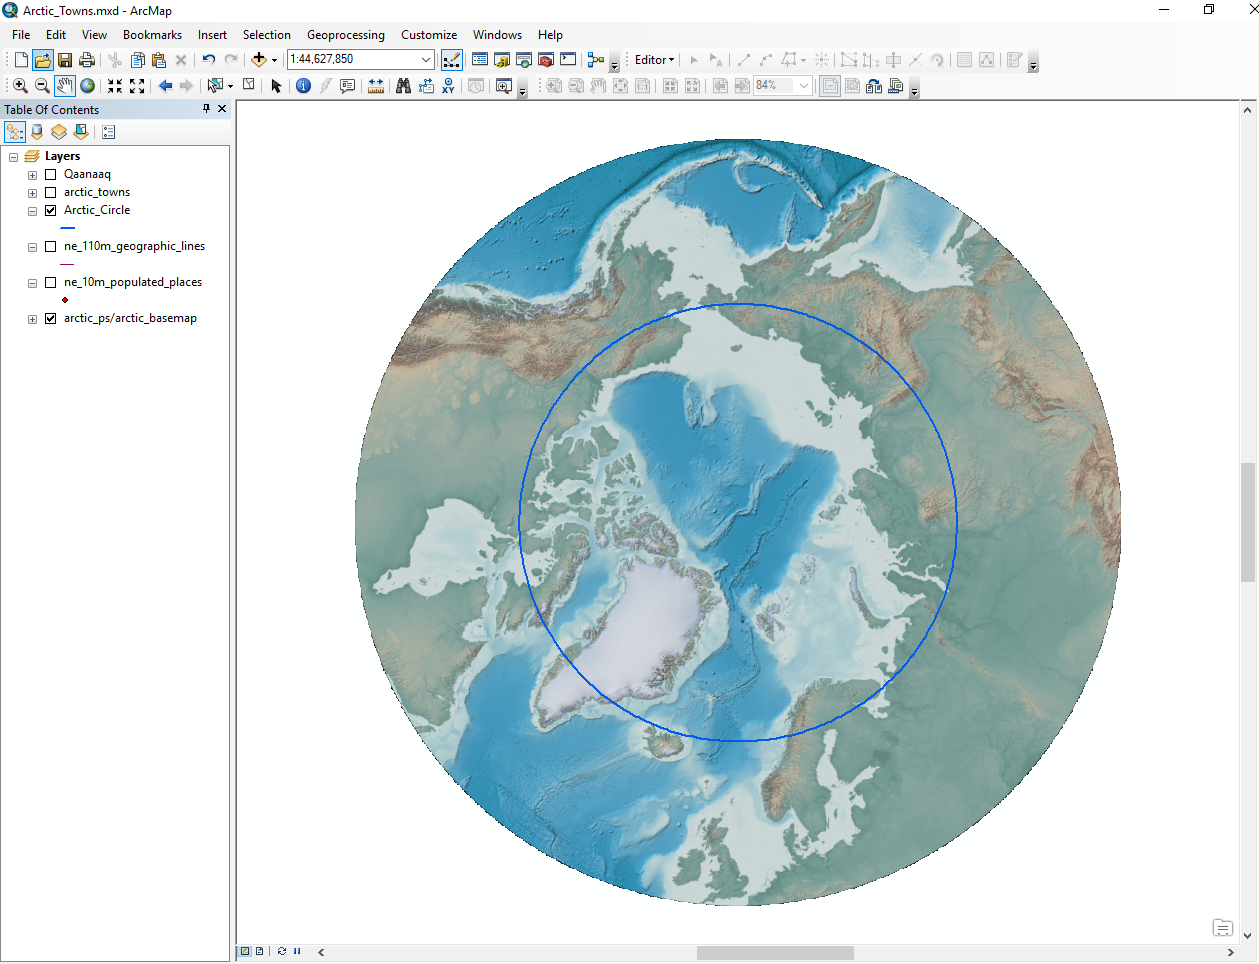
Select only the desired region from the geographic lines shapefile and make a new layer:
- Right click on the layer
- Open Attribute Table, select the desired region
- Close the attribute table
- Right click on the layer again and go to Selection -> Create Layer From Selected Features.
Here, we zoomed into the Arctic Circle.
Arctic Circle
Including data specific for the desired region:
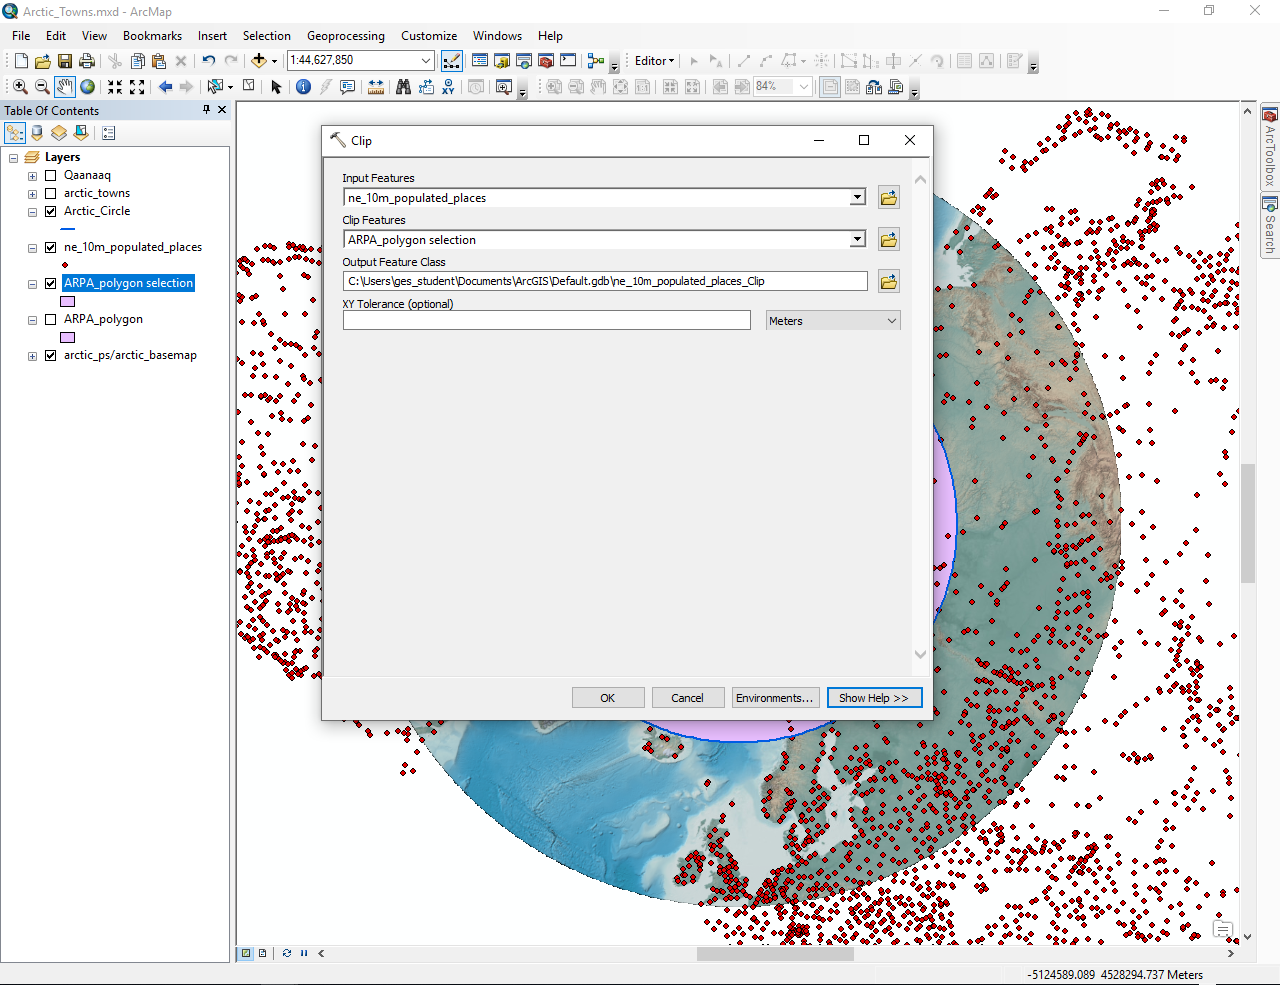
- Find a shapefile of desired area polygon
- Edit the polygon in ArcMap to make it a perfect circle using the Editor toolbar (Customize -> Toolbars -> Editor)
- Use the Clip function (ArcToolbox -> Analysis Tools -> Extract -> Clip) to exclude unecessary data
Extract Data
Our map was about population sizes in the Arctic, so we changed the symbol size to show relative populations of the towns:
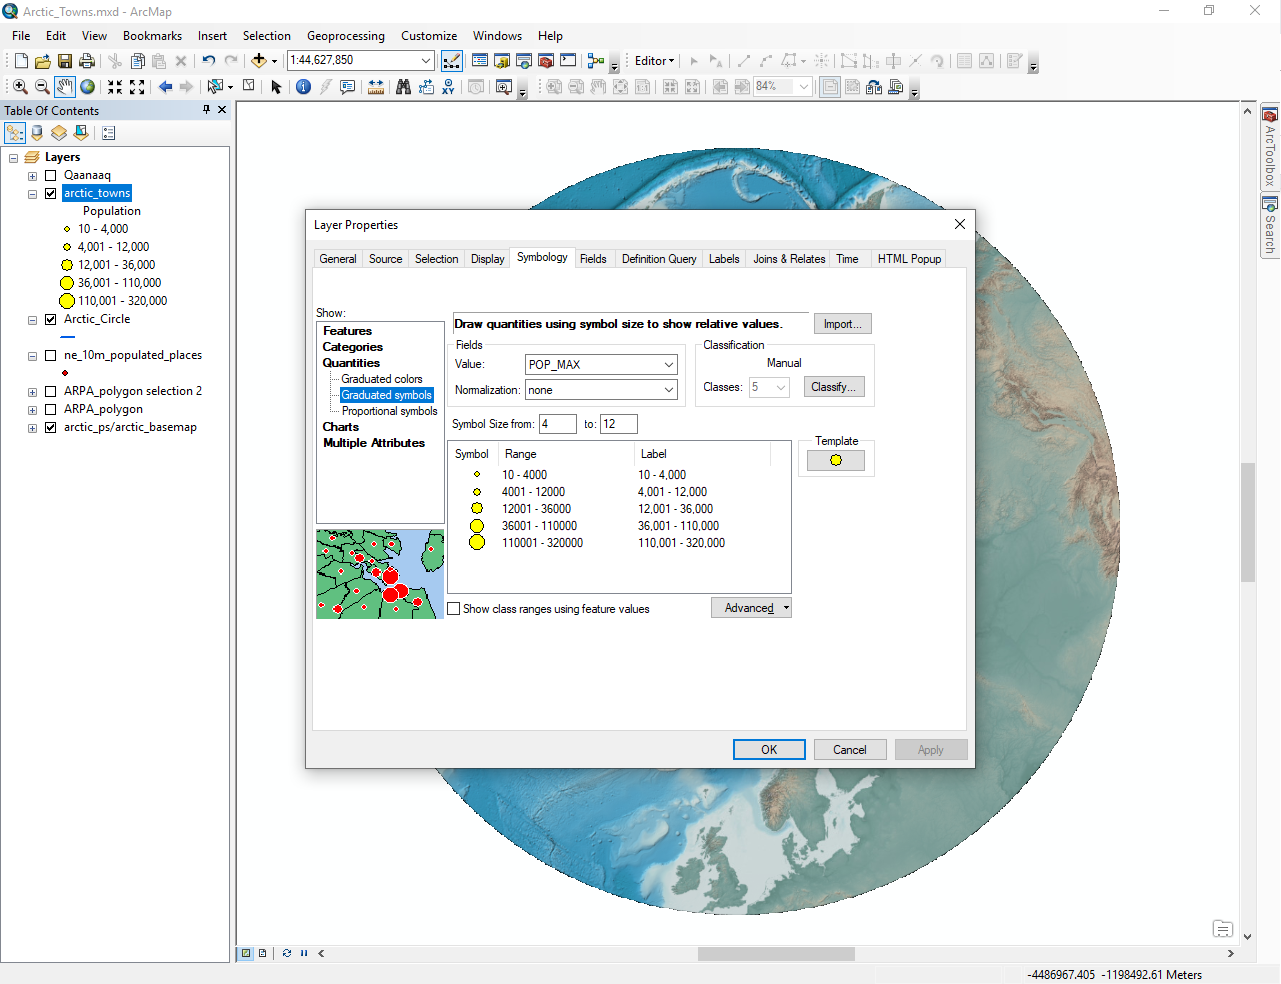
Symbology shows population size
After adding the legend (refer to Section 5.2), this was our map:
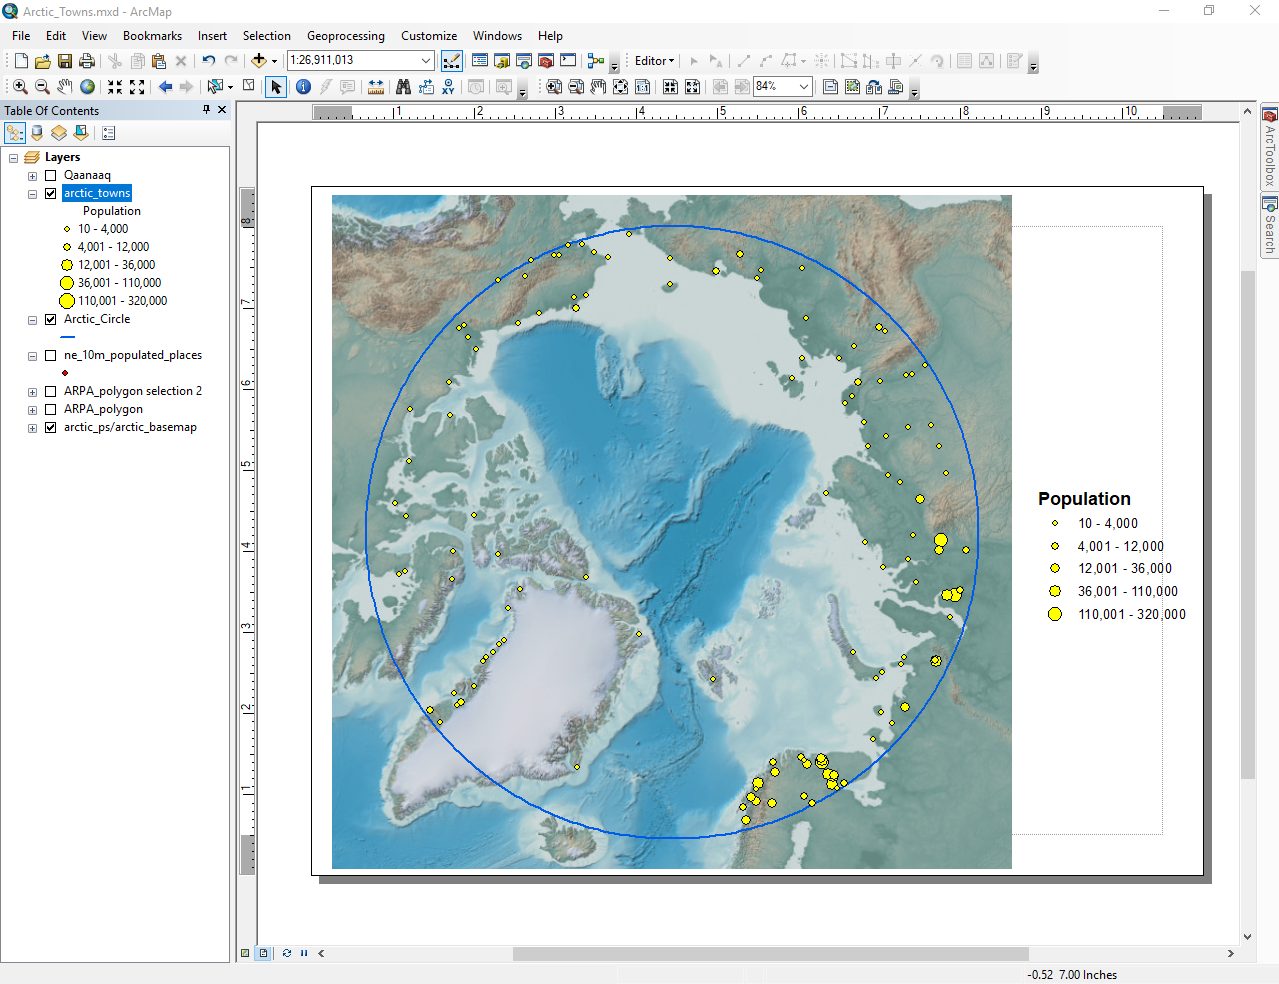
Map of Population Sizes in the Arctic Circle
5.4 Selecting a Specific Point
- Select desired point in attribute table
- Make a new layer
Town shown in red:
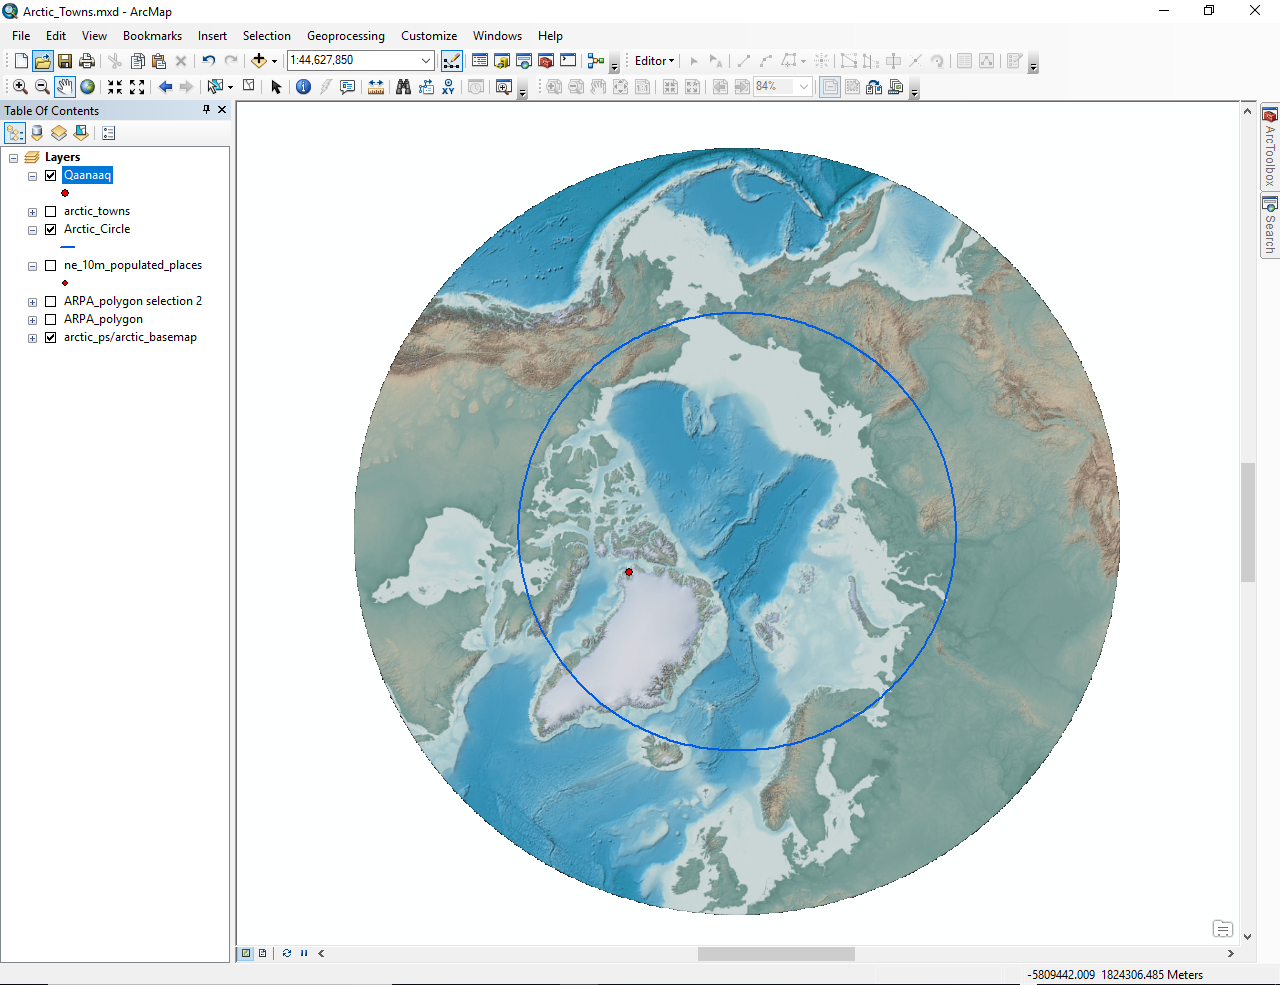
Town of Qaanaaq
5.5 Creating a Map from Google Earth files
5.5.1 Research Expeditions to the Arctic
After you have your basemap, labels (if applicable), and KML (Google Earth) files, you are ready to create a map.
- Use the KML to Layer function (ArcToolbox -> Conversion Tools -> From KML -> KML to Layer) in ArcMap
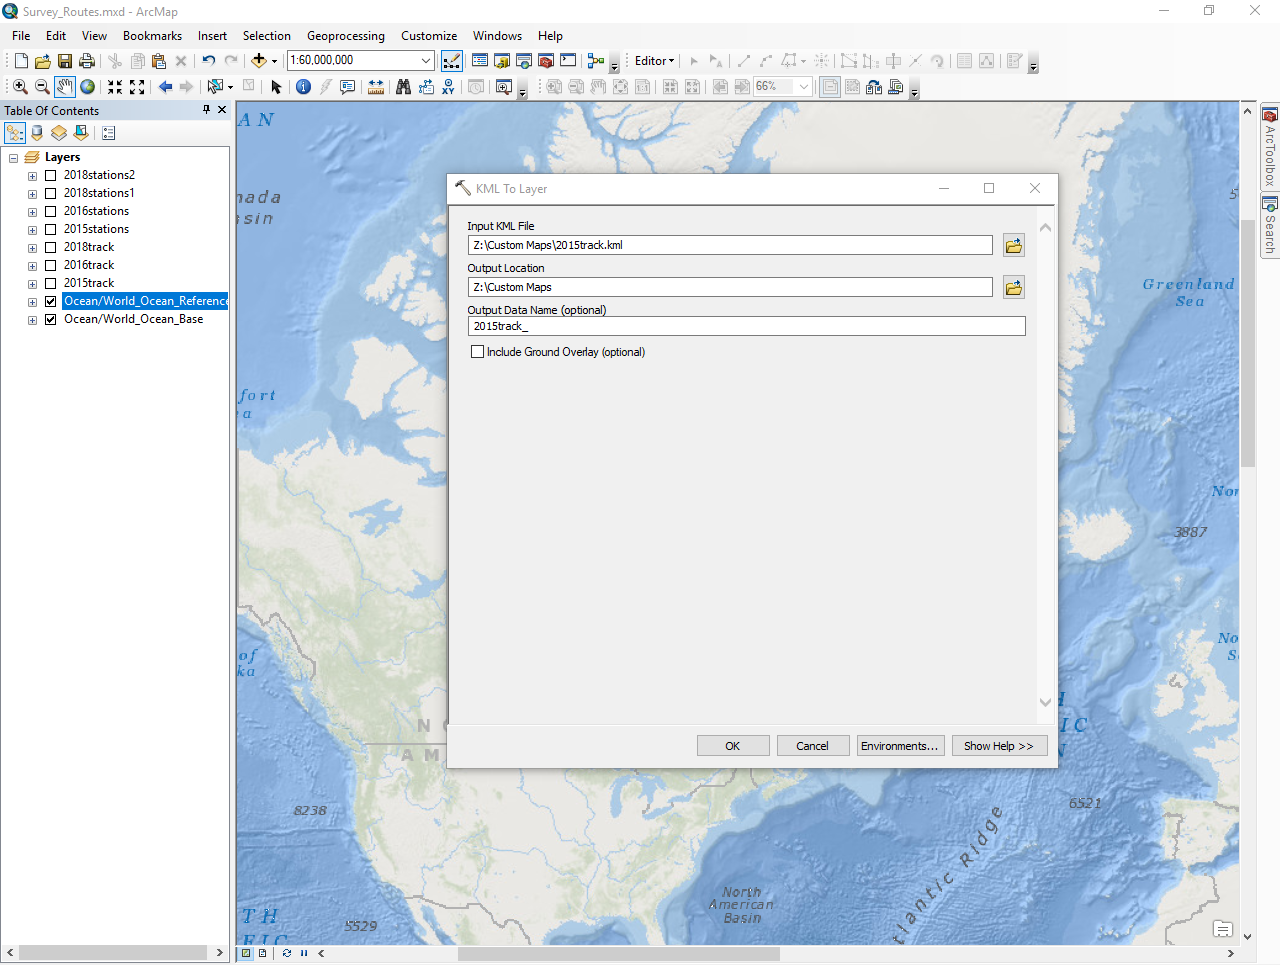
KML to layers
5.6 Overlaying Datasets
5.6.1 Arctic Marine Areas of Heightened Ecological Significance and Arctic Protected Areas
If you want to display two datasets at once, you can overlay them.
You need:
- Your basemap
- Shapefiles for both desired datasets
Open the shapefiles in ArcMap. Export the map with all 3 layers selected - your basemap and the shapefiles.
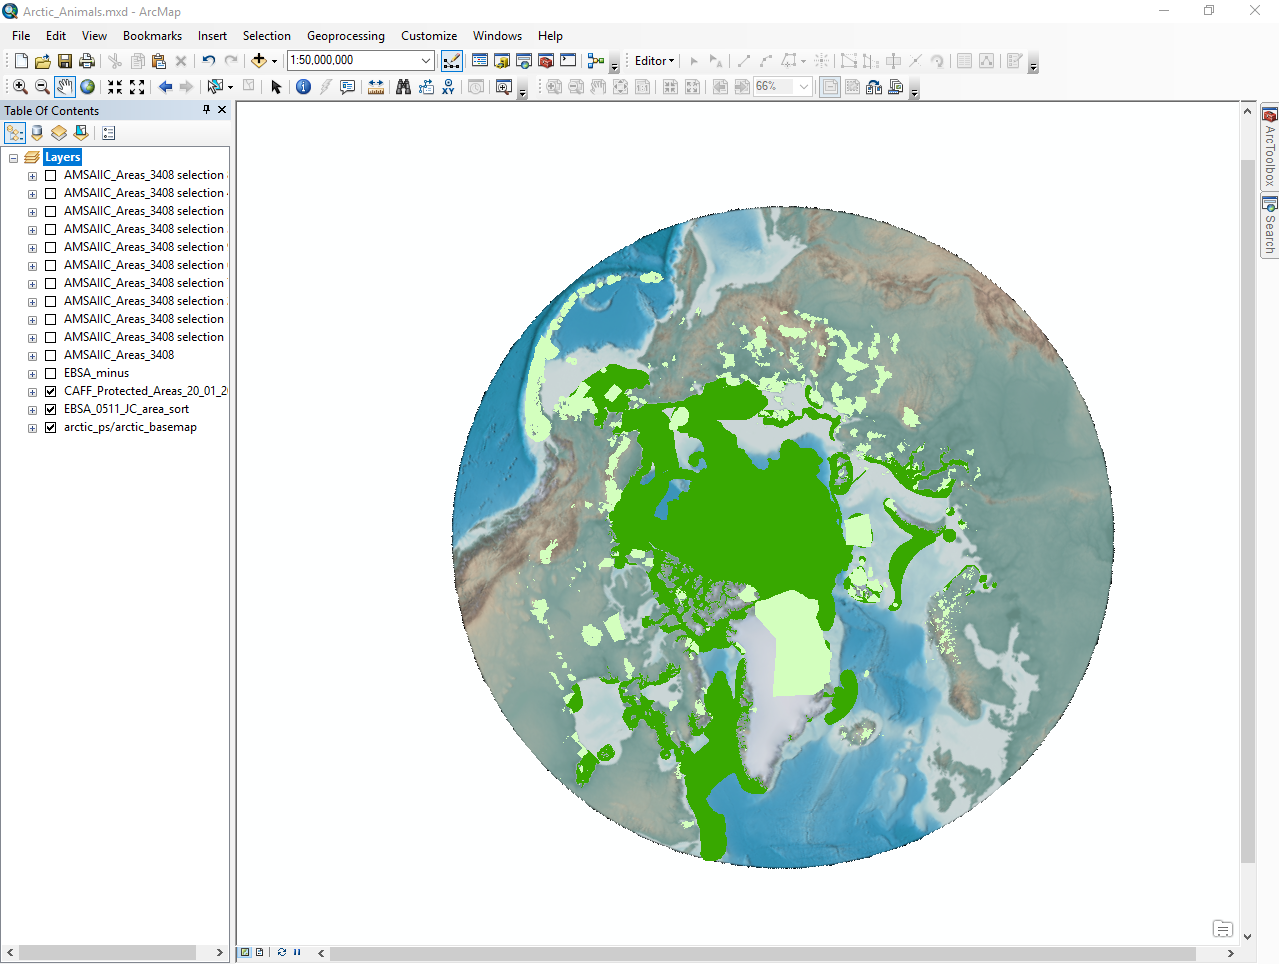
Overlayed Datasets
5.7 Exporting Maps
Export as a JPEG with a resolution of 300 dpi (File -> Export Map).
Adobe Photoshop or Adobe After Effects can be used to take out the white background of the exported pictures.
It is easiest to make maps into PIPs in After Effects so that they are easily visible on all sides of the sphere (see Section 6: Audio/Visual for more information).