Chapter 5 Field Collected Data
To account for the impacts of vegetation and soil on microclimate, we recorded vegetation and soil characteristics. Within a 1 m radius of the logger, we collected measurements of leaf area index (LAI), tallest understory vegetation, litter depth and dominant cover type.
| Data_Type | Files |
|---|---|
| D:/Data/SmithTripp/SmithTripp_Metadata/_Field-Collected-Data/Compiled_Vegetation Data | Compiled_Data.csv |
| For_Plots | |
| D:/Data/SmithTripp/SmithTripp_Metadata/_Field-Collected-Data/GPS_Points | alexfraser.xml |
| GIS_Points.csv | |
| D:/Data/SmithTripp/SmithTripp_Metadata/_Field-Collected-Data/Leaf_Area_Index_Licor_Data | LAI_Plots.xlsx |
| Raw_Files | |
| D:/Data/SmithTripp/SmithTripp_Metadata/_Field-Collected-Data/logger_plotcode.csv | |
| D:/Data/SmithTripp/SmithTripp_Metadata/_Field-Collected-Data/Soil Data | GavinLake_Soils_SMCalibrModelCoeff.csv |
| Sample_Sites_Soil.xlsx | |
| TMS3calibr1-11.xlsm | |
| D:/Data/SmithTripp/SmithTripp_Metadata/_Field-Collected-Data/Tree_Plots | Tree_Data.xlsx |
| tree_locations | |
| treeplot_locations.csv | |
| trees_cartesian.csv | |
| D:/Data/SmithTripp/SmithTripp_Metadata/_Field-Collected-Data/Vegetation and Litter Data | Vegetation_Data_Clean.xlsx |
5.1 GPS Points
GPS points are recorded with a Leica 14 system (Geosystems 2020). These points were processed for accuracy. The raw xml files are included in this database, as well as the r code use to parse them. However, I recommend using the cleaned GPS point locations. Loaded below
## Warning in showSRID(uprojargs, format = "PROJ", multiline = "NO"): Discarded datum North_American_Datum_1983 in CRS definition,
##  but +towgs84= values preserved
5.2 Leaf Area Index LiCOR data
LAI was measured using an Licor 2200 Plant Canopy Analyzer . The Licor 2220 is a passive sensor of leaf area index that combines measurements of solar radiation taken at five concentric circles with angles centered at 7 , 23, 38 , 53 , 68, all relative to 90 degrees . Values of LAI are calculated from the difference of measured radiation below canopy and measurements from nearby non-canopy location (also known as the above measurement). At each microclimate site, four measurements were taken at a 2 m distance from the logger in ordinal directions. These measurements were averaged to produce an LAI for each site location.
Files include the raw LAI data from the above and below canopy wand (see:raw files). Processed data are included in the csv. Note: Some below canopy measurements were taken in above mode and are erroneous. This data has not been cleaned.
| Files |
|---|
| LAI_Plots.xlsx |
| Raw_Files |
5.3 Vegetation and Litter Data
Five measurements of height and litter depth were randomly collected and values averaged for each site-location. Dominant cover was estimated based on percentages between 0-5, 5-10, 10-25, 25-50, 50-75, and 75-100 %. Cover classes included: shrub, herbs, forbs, graminoids, moss, or bare. Litter and vegetation heights are noted Figure (fig:vegdata).
We also collected seedling data.We set up a 1 m^2 seedling plot At points 2,4,5,6, and 8 within each forest plot. We recorded total number according to three morphologies (A, B, C). A is a douglas-fir seedling, B is a lodgepole pine, and C is spruce. These are recorded under “morpho” of the vegatation data. The structure of vegetation data is noted in Table(tab:vegdata). However, these are named with the original plot names - for ease of use I recommend using the fully compiled vegetation data. This does not have the seedling data because we recorded ~ 50 individuals.
If working with seedling data or wanting to access notes, “logger_plotcode.csv” can be used to align plot names.
| Logger | Plot | Date | Time | Veg_1_cm | Veg_2_cm | Veg_3_cm | Veg_4_cm | Veg_5_cm | Lit_1_cm | Lit_2_cm | Lit_3_cm | Lit_4_cm | Lit_5_cm | Perc_Cover | Dom_Cov | Morpho A | Morpho B | Morpho C | Dom_Cov_Seedlings | Comments june-july | Comments Oct | Original Logger |
|---|---|---|---|---|---|---|---|---|---|---|---|---|---|---|---|---|---|---|---|---|---|---|
| 94203293 | 3.52W.6 | 2020-07-29 | 0.51388888888888895 | 0 | 14.0 | 40 | 55 | 30 | 3.2 | 1.5 | 3.0 | 2.2 | 1.8 | 25-50 | shrub | 0 | 0 | herb | 94203211 replaced with 94203293; lots of deer poop | 94203211 | ||
| 94203292 | BTW.6 | 2020-08-25 | 4ish | 0 | 0.0 | 43 | 0 | 59 | 0.5 | 2.4 | 2.6 | 2.0 | 4.8 | 10-25 | shrub, rock | 0 | 0 | moss | pulled out, replaced from 65 to 92 | 94203265 | ||
| 94203291 | 3.66W.8 | 2020-08-09 | around 2pm | 55 | 4.5 | 80 | 20 | 30 | 0.0 | 0.0 | 0.0 | 1.2 | 1.3 | 75-100 | herb/shrub/grass | 0 | 0 | herbs | serial wrong - orig 59 should have been 58; replated with 94203291 | 94203258 | ||
| 94203290 | CC.1 | 2020-08-29 | 0.61111111111111105 | 0 | 0.0 | 0 | 25 | 35 | 2.5 | 2.8 | 8.0 | 6.0 | 3.5 | 10-25 | shrubs (mostly roses) | |||||||
| 94203289 | CC.2 | 2020-08-30 | 0.61458333333333337 | 60 | 0.0 | 0 | 11 | 60 | 1.0 | 0.5 | 0.2 | 7.8 | 3.0 | 10-25 | fireweed, lots of rock | 5 | 0 | pulled out; coordinates stored in Burns Bog folder | ||||
| 94203288 | CC.3 | 2020-08-31 | 0.61458333333333337 | 60 | 8.0 | 11 | 0 | 20 | 2.8 | 2.5 | 2.3 | 2.5 | 6.1 | 25-50 | shrub |
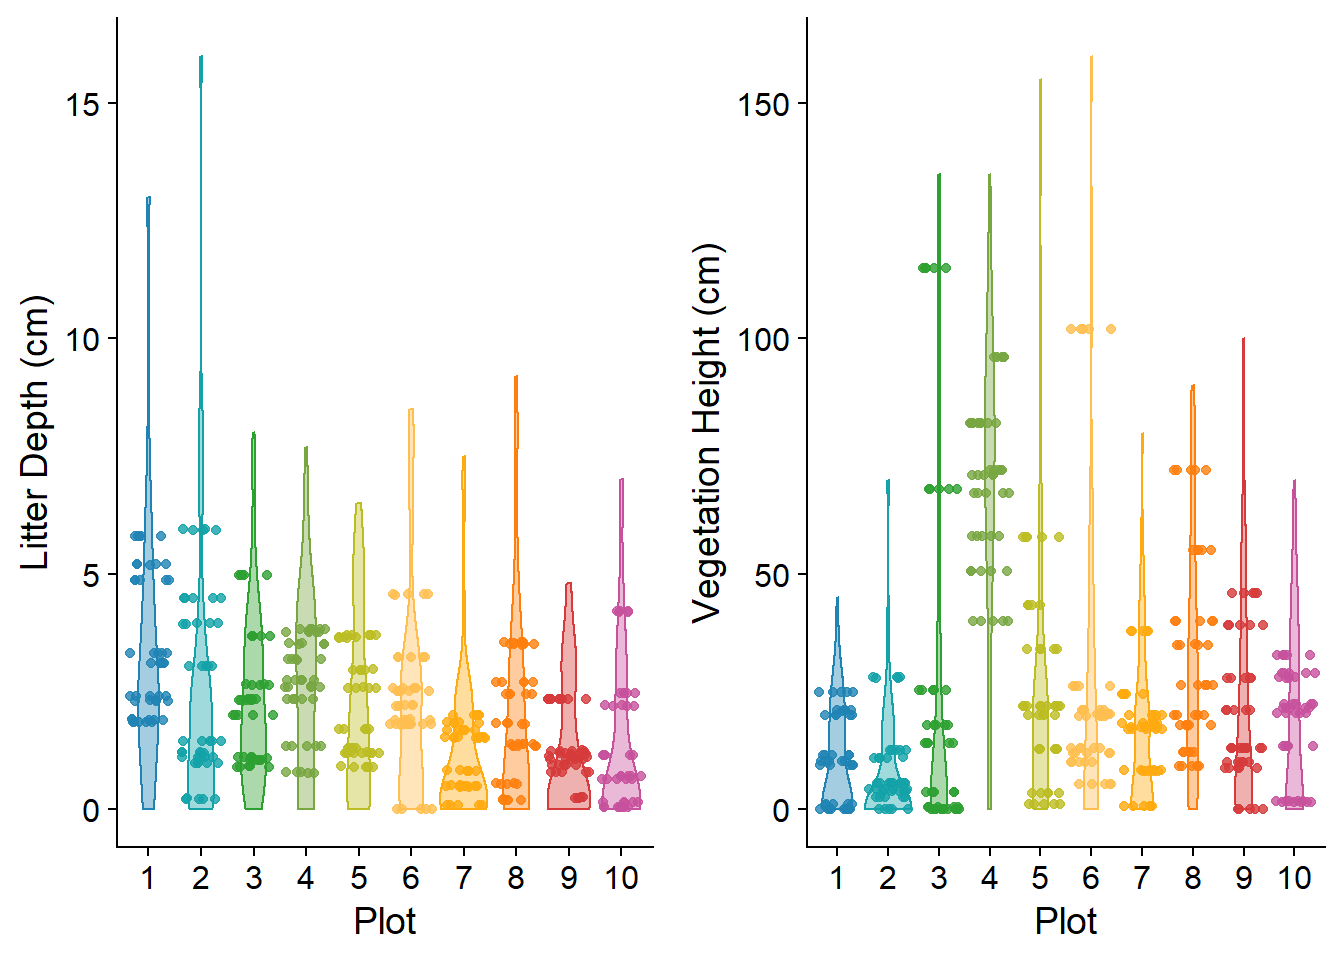
Figure 5.1: Distribution of vegetation ht. and litter depth (cm). Points show mean value for each microclimate site
5.4 Soil Data
Soil cores were collected using a standard push soil sample probe. The volume and number of soil samples varied from site-to-site based on the presence of large clasts. Soil samples were dried over a one-week period at 45 degrees C in a standard drying oven. Soil bulk density was calculated based on the volume of soil collected and the final dry weight. Variation in soil bulk density is noted in figure (fig:soildense). Soil type was classified using the standard soil classification based on percent silt, clay, and sand. Samples with high organic content were noted, but organic material was not digested. Soil composition was used to convert soil moisture counts into volumetric soil moisture (% vol) using “TMS3_Calibr User Soil Properties” function
## Warning: Ignoring unknown parameters: sive## Warning: Removed 2 rows containing non-finite values (stat_boxplot).## Warning: Removed 2 rows containing missing values (geom_point).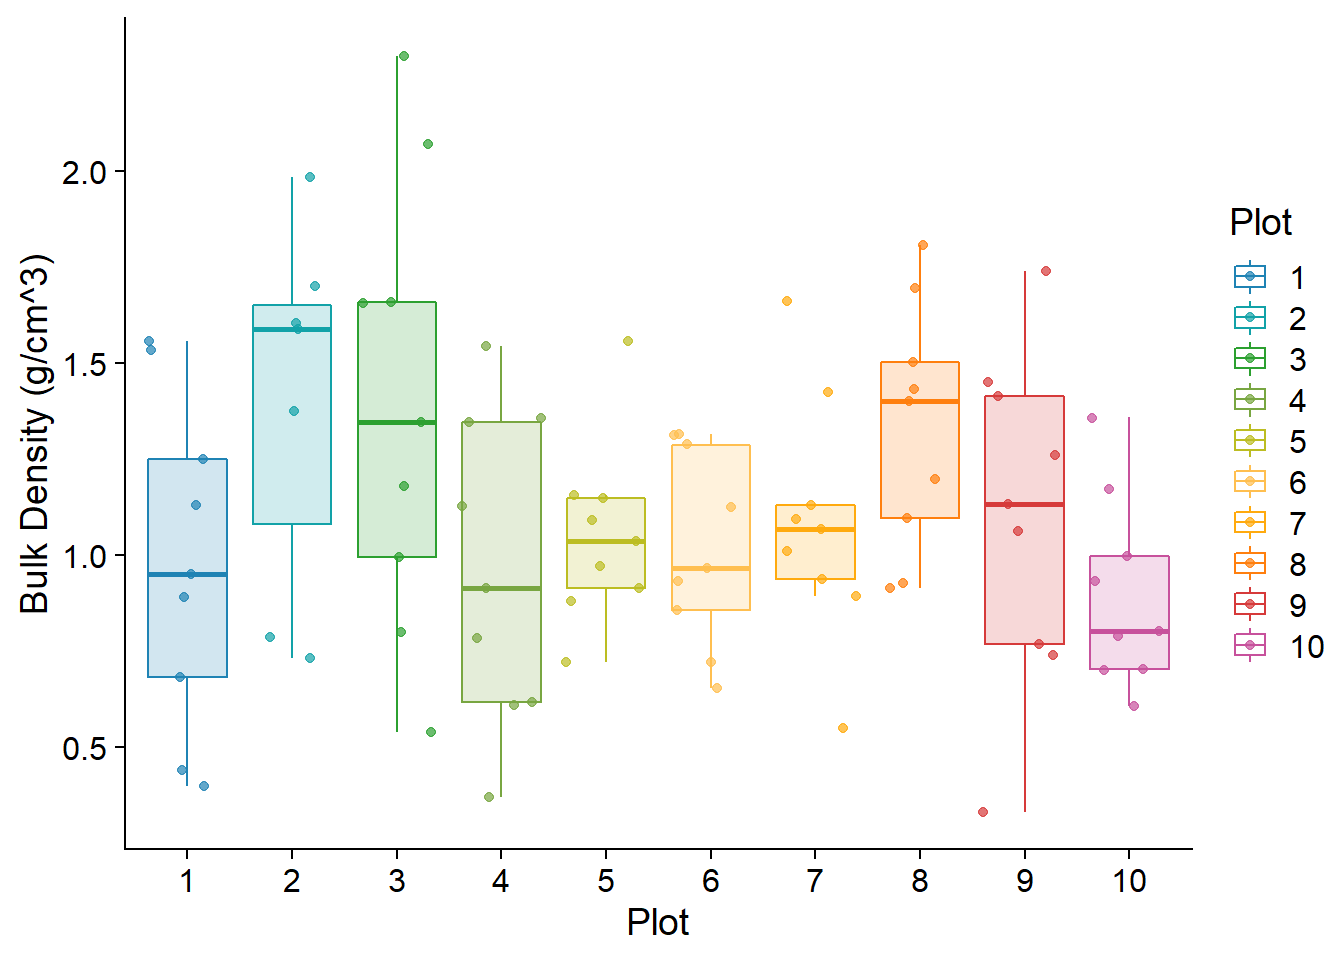
Figure 5.2: Soil Bulk Density (g/cm^3) for each plot. Points are the values derived for each microclimate site
Soil type was classified by Sarah Smith-Tripp as the samples were dried and processed. The soil samples are currently stored in room 105, but have now been combined for each forest plot. The percent of clay, silt, and sand was estimated from each sample. Following this, these percentage values were placed in “TMS3-SoilCalibr Utility” which is an excel macro used to convert soil types. See (Wild et al. 2019) for more details. This outputs a calibration equation whose coefficients are noted in “GavinLake_Soils_SMCalibrModelCoeff.csv.” The calibration equation, where x is the soil moisture count, is as follows:
\[f(x) = a(x)^{2} + b(x)- c\]
5.5 Compiled Vegetation Data
Final compiled vegetation is inluded in “Compiled_Data.csv”. While this data is servicable, for absolute ease of use I would rely more on the data compiled for the SoilTemp database as this has been pivoted and more variables have been added.
5.6 Tree Plots
To verify the DAP derived canopy model, tree heights were collected in 15 6.5 meter radius circular plots randomly located within the flight areas. Locations are noted in 2.1. In total, 295 stems (live and dead) were included, with an average of 18 stems per plot. Plot maps are included in figure 5.3. In each plot, DBH, tree height, and status was recorded. Tree height was measured using a Nikon Forester 550 Hypsometer. Measurements were repeated three times to get an average tree height. For each plot, mean and maximum tree height were tabulated and compared to estimates from the DAP canopy height model to assess the accuracy of DAP models.
Field measured locations are included in “tree_plot_locations.csv”
## Warning in FUN(X[[i]], ...): NAs introduced by coercion## Warning: Removed 19 rows containing missing values (geom_point).## Warning: Removed 295 rows containing missing values (geom_segment).## Warning: Removed 16 rows containing missing values (geom_text).## Warning: Removed 295 rows containing missing values (geom_segment).## Warning: Removed 16 rows containing missing values (geom_text).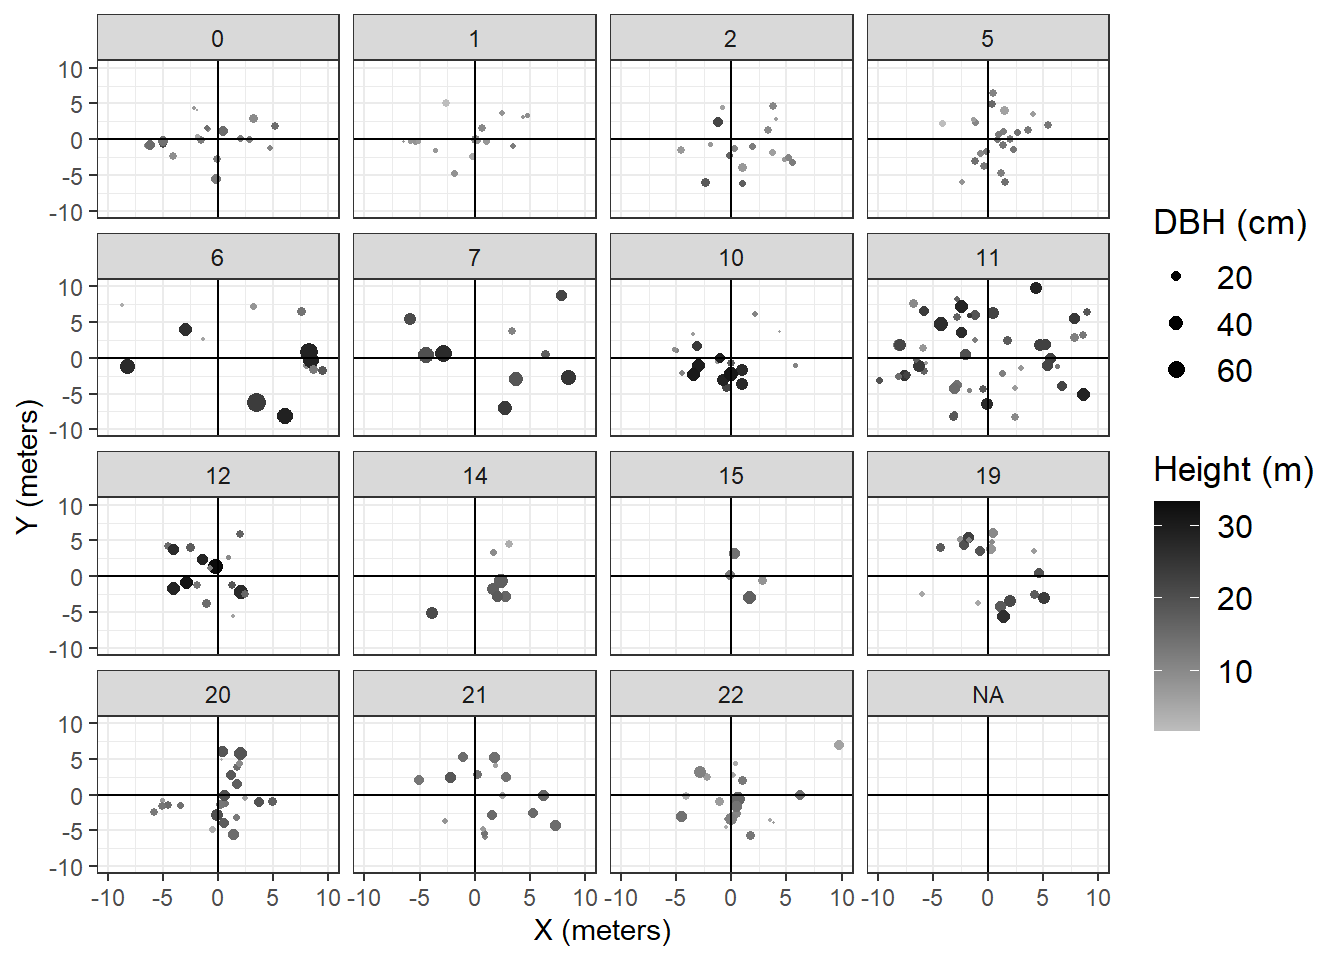
Figure 5.3: Tree Plot Locations
References
Geosystems, Leica. 2020. “Measurement Performance & Accuracy.” Leica Viva GNSS GS14 Receiver Datasheet.
Wild, Jan, Martin Kopecký, Martin Macek, Martin Šanda, Jakub Jankovec, and Tomáš Haase. 2019. “Climate at Ecologically Relevant Scales: A New Temperature and Soil Moisture Logger for Long-Term Microclimate Measurement.” Agricultural and Forest Meteorology 268 (April): 40–47. https://doi.org/10.1016/j.agrformet.2018.12.018.