Chapter 2 Field Site Overview
Our study was located at the Alex Fraser Research Forest Gavin Lake Block (AFRF) 60 km north of Williams Lake, British Columbia. Elevation ranges from 600 - 1250 m (Figure 2). All research plots are within the sub-boreal spruce (SBS) ecologic zone where Douglas fir (Pseudotsuga menziesii var. glauca) is the dominant overstory species. The research was conducted within the Prouton Lakes Fire boundary (C30870), which burned approximately 1000 of the 6000-ha AFRF forest in 2017.Fire severity was variable throughout the burned area – ranging from low-severity ground fire to high-severity canopy fire
From early May 2020 to mid-October 2020 (the AFRF growing season), we established 10 one-hectare forest plots stratified across a gradient of elevation and fire severity with the aim of capturing changes in canopy and its impact on microclimate. Fire severity is calculated from summer 2017 Landsat derived normalized burn ratio (dNBR) acquired after the fire (Miller and Thode, 2007). Plot names were based nominally on fire severity where 1 is the lowest and 10 is the highest. A total of 90 microclimate loggers were deployed across 10 forest plots (9 per plot) spaced approximately 30 meters from each other. An overview of plot set-up is included in Figure 2.1 For clarity, a microclimate site refers to a single logger location and a forest plot refers to a larger gridded logger set-up.
We used high-accuracy and durable TOMST TMS-4 dataloggers to record microclimate site temperature and soil moisture (Wild et al., 2019). These 30 cm long loggers have three thermistors at +15 (near-surface), 0 (surface), and -8 cm (soil) relative to the ground surface. These recorded measurements every 15 minutes.
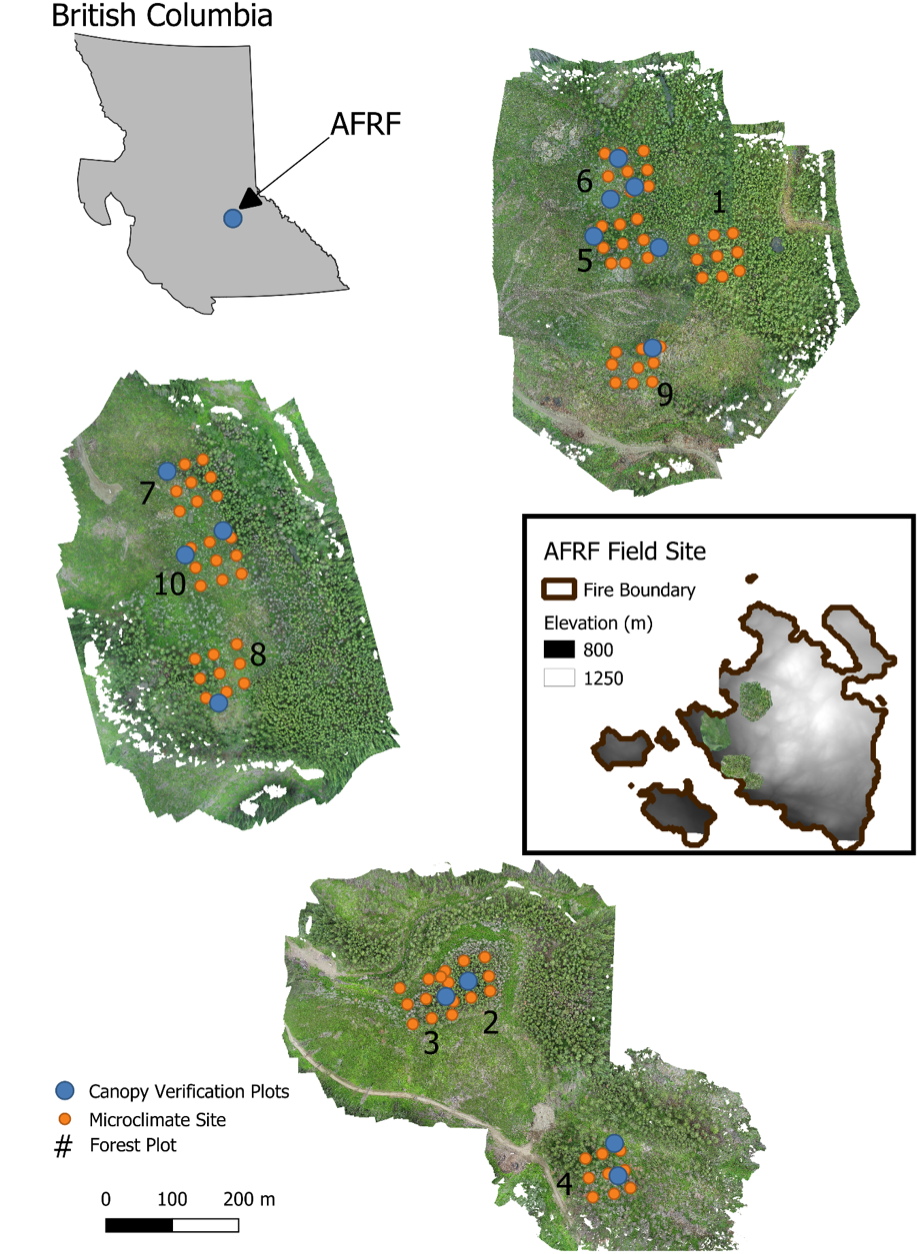
Figure 2.1: Plot Set Up and Orthophotos for Alex Fraser Research Forest
2.1 Prior Data
Site Indices for the Biogeoclimatic Ecosystem Classification System
A study conducted in 2004 discusses the site types present in Alex Fraser Research Forest. Site descriptions are included in the study (Klinka et al. 2004). See Figure 2.2 for plots of what the data should look like.
## OGR data source with driver: ESRI Shapefile
## Source: "D:\Data\SmithTripp\SmithTripp_Metadata\_field-site-data\BecZones_AFRFBoundary\Ecol_BEC_Zonal_Units_Pl.shp", layer: "Ecol_BEC_Zonal_Units_Pl"
## with 9 features
## It has 11 fields
2017 Fire Severity Data
Landsat derived difference in Normalized Burn Ratio (dNBR) as calculated from August and October imagery (pre and post fire). Fire severity is linked for 5 different classes where 5 is the highest fire severity.
## _field-site-data/Fire_Severity/Fire_Severity_Shapes/Fire_Severity_Raster.tif has GDAL driver GTiff
## and has 254 rows and 327 columns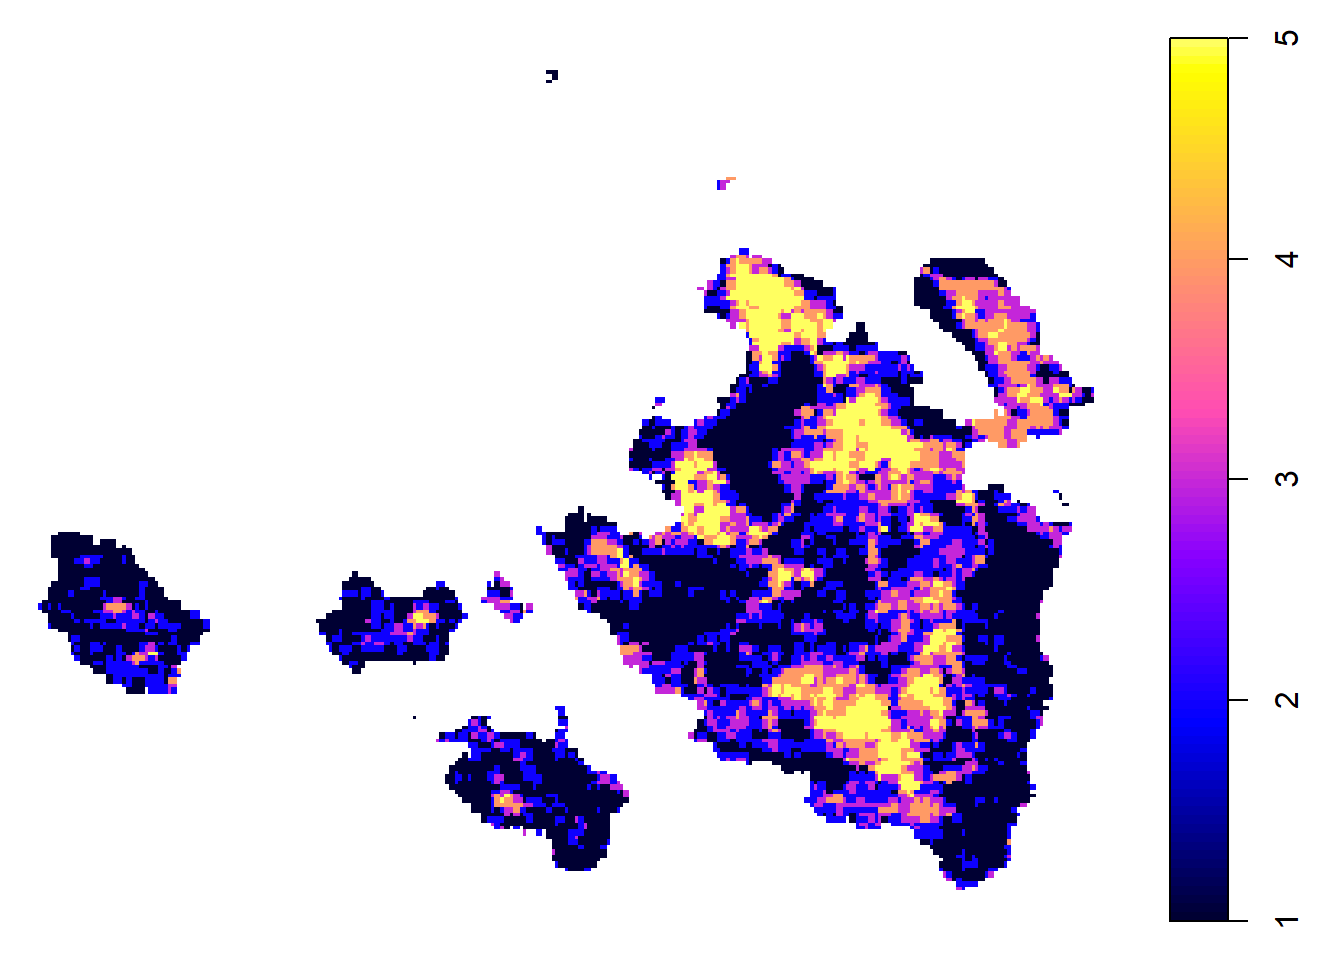
Also included in the fire severity data is a description of the cutblocks and wildlife tree patches. It is important to note many of these locations have changed in 2020 (as I unfortunately found out). The forest is dynamic and the most up-to-date cutblock maps can be acquired by reaching out to Alex Fraser Research forest administration. You can contact them here.
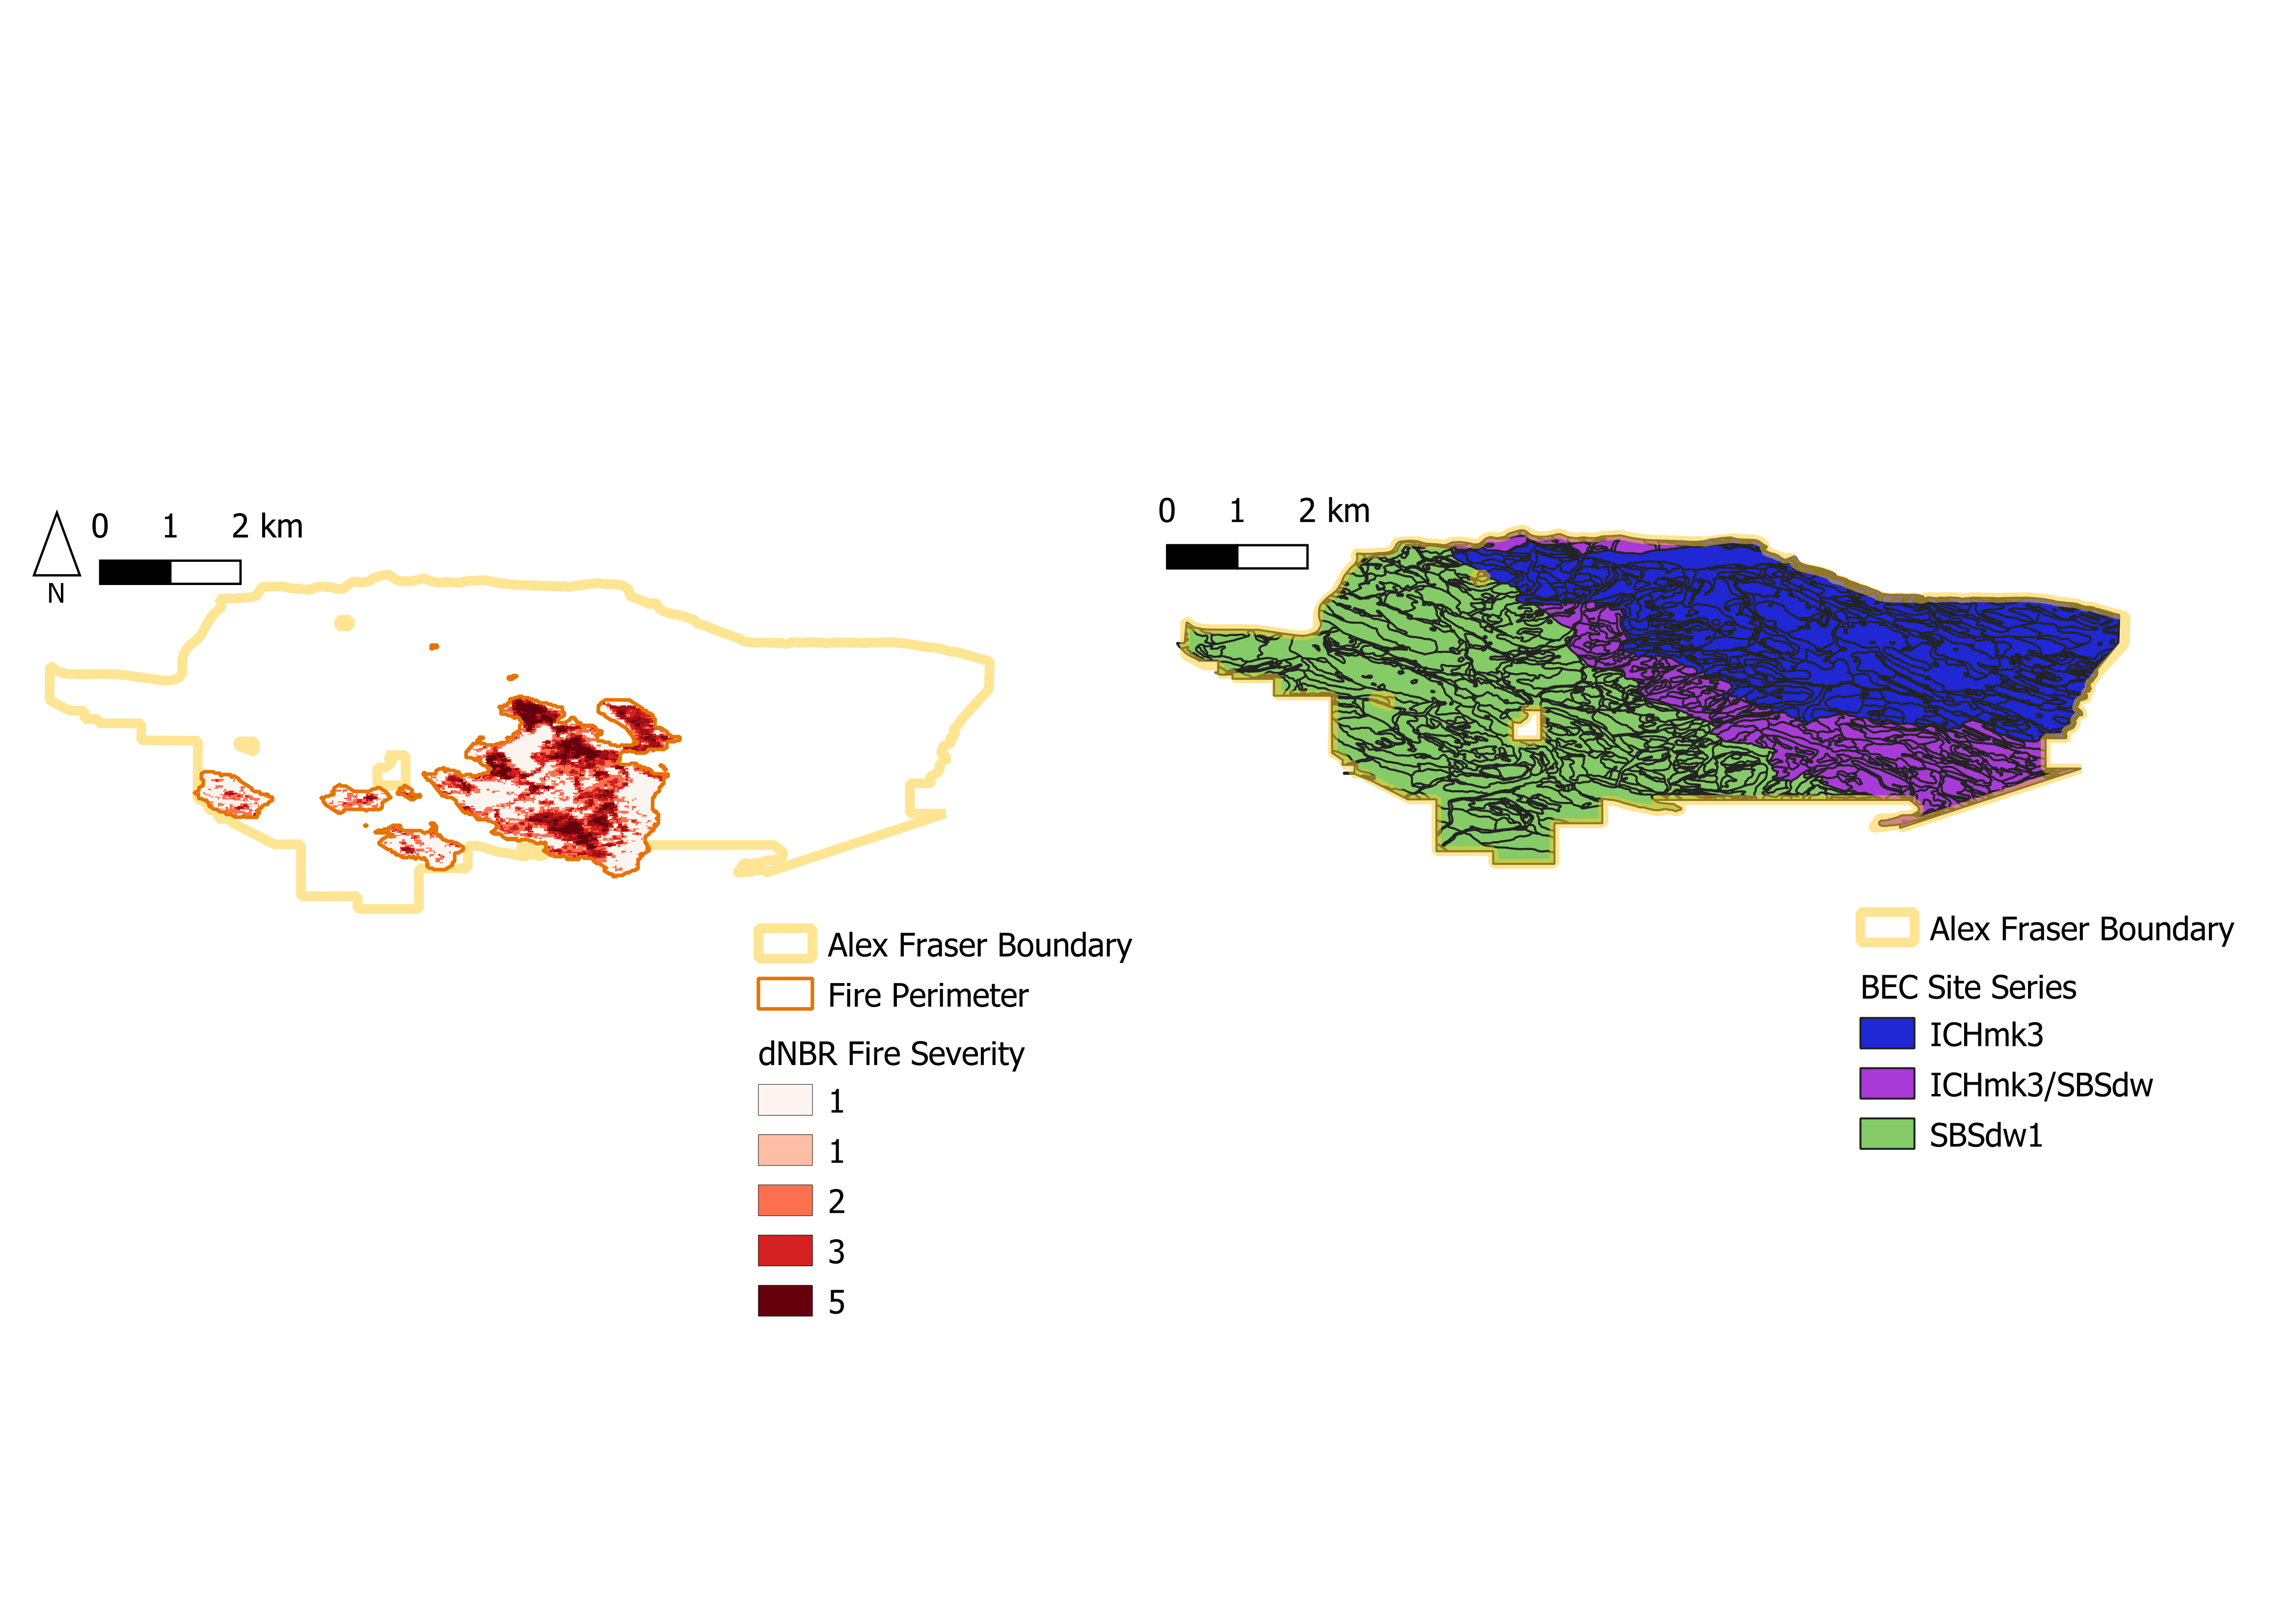
Figure 2.2: External Data not Produced by Sarah Smith-Tripp
References
Klinka, K, P Varga, C Koot, M Rau, J Macku, and T Kusbach. 2004. “Site Units of the University of British Columbia Alex Fraser Research Forest.” Alex Fraser Research Forest: University of British Columbi.