Load Seurat Obj
combined <- readRDS('data/Demo_CombinedSeurat_SCT_Preprocess_FilterLQCells.rds')
Idents(combined) <- 'cluster'
## only for neurogenesis
combined <- subset(combined, idents = c('RG', 'Cycling', 'IP', 'ExN', 'ExM', 'ExU', 'ExDp'))
DefaultAssay(combined) <- 'RNA'
combined <- NormalizeData(combined)
Monocle2 process
cds <- estimateSizeFactors(cds)
cds <- estimateDispersions(cds)
## Removing 459 outliers
## ordering by marker gene per cluster
deg <- readRDS('data/Demo_CombinedSeurat_SCT_Preprocess_FilterLQCells_DEGPerCluster_Minpct03Mindiffpct02.rds')
deg <- deg[which(deg$cluster %in% unique(combined$cluster)), ]
sel.gene <- unique(deg$gene)
cds <- monocle::setOrderingFilter(cds, sel.gene)

## dimension reduciton
cds <- monocle::reduceDimension(cds, method = 'DDRTree')

## ordering cells
cds <- monocle::orderCells(cds)

## ordering cells by assigning root nodes
GM_state <- function(cds){
  if (length(unique(cds$State)) > 1){
    T0_counts <- table(cds$State, cds$cluster)[,"RG"]
    return(as.numeric(names(T0_counts)[which
                                       (T0_counts == max(T0_counts))]))
  } else {
    return (1)
  }
}
cds <- monocle::orderCells(cds, root_state =  GM_state(cds))
Visualization
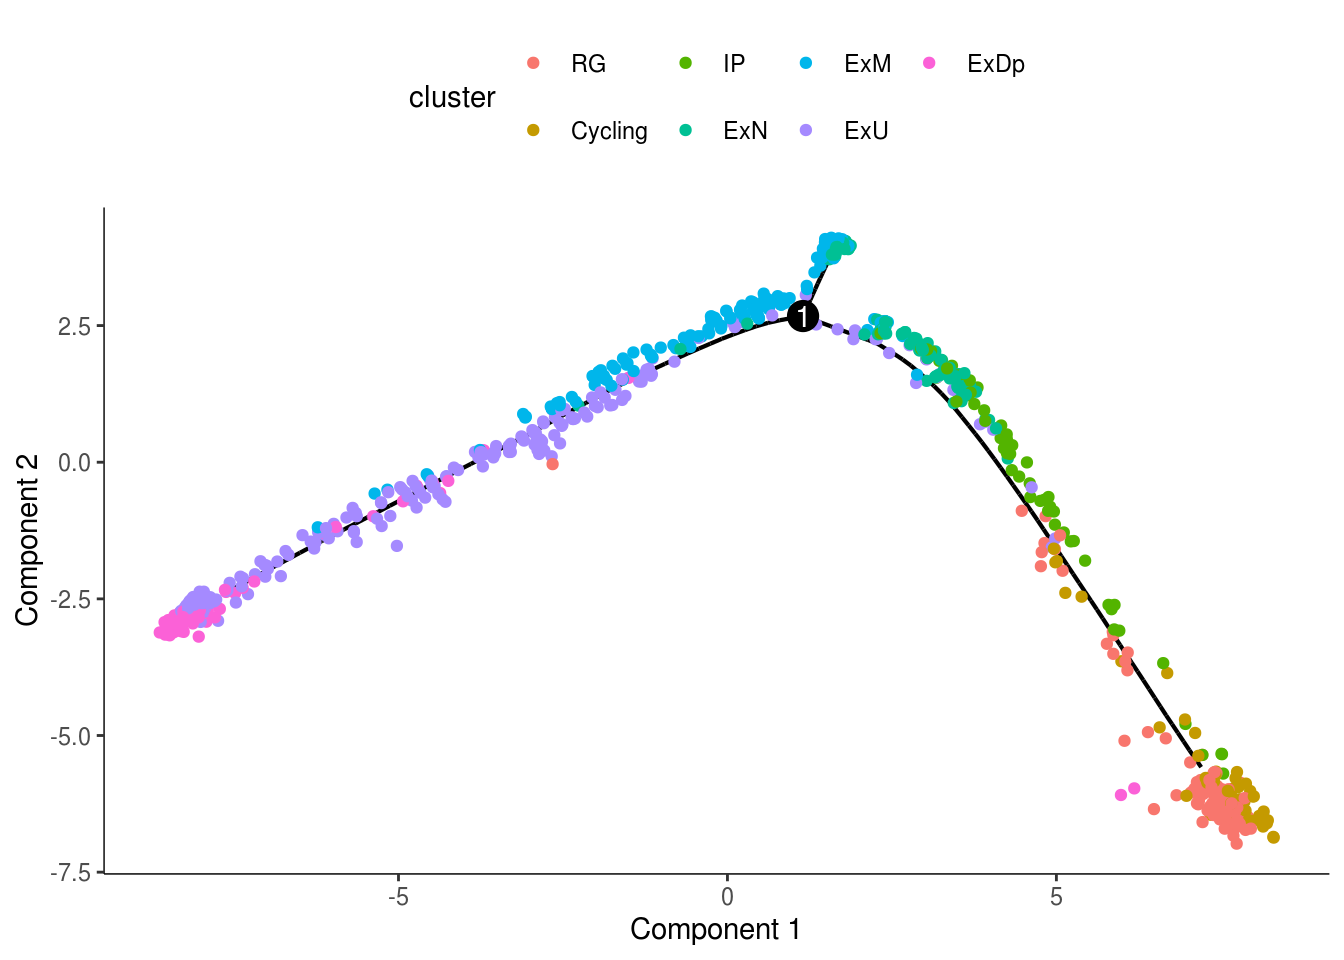
monocle::plot_cell_trajectory(cds, color_by = "cluster")
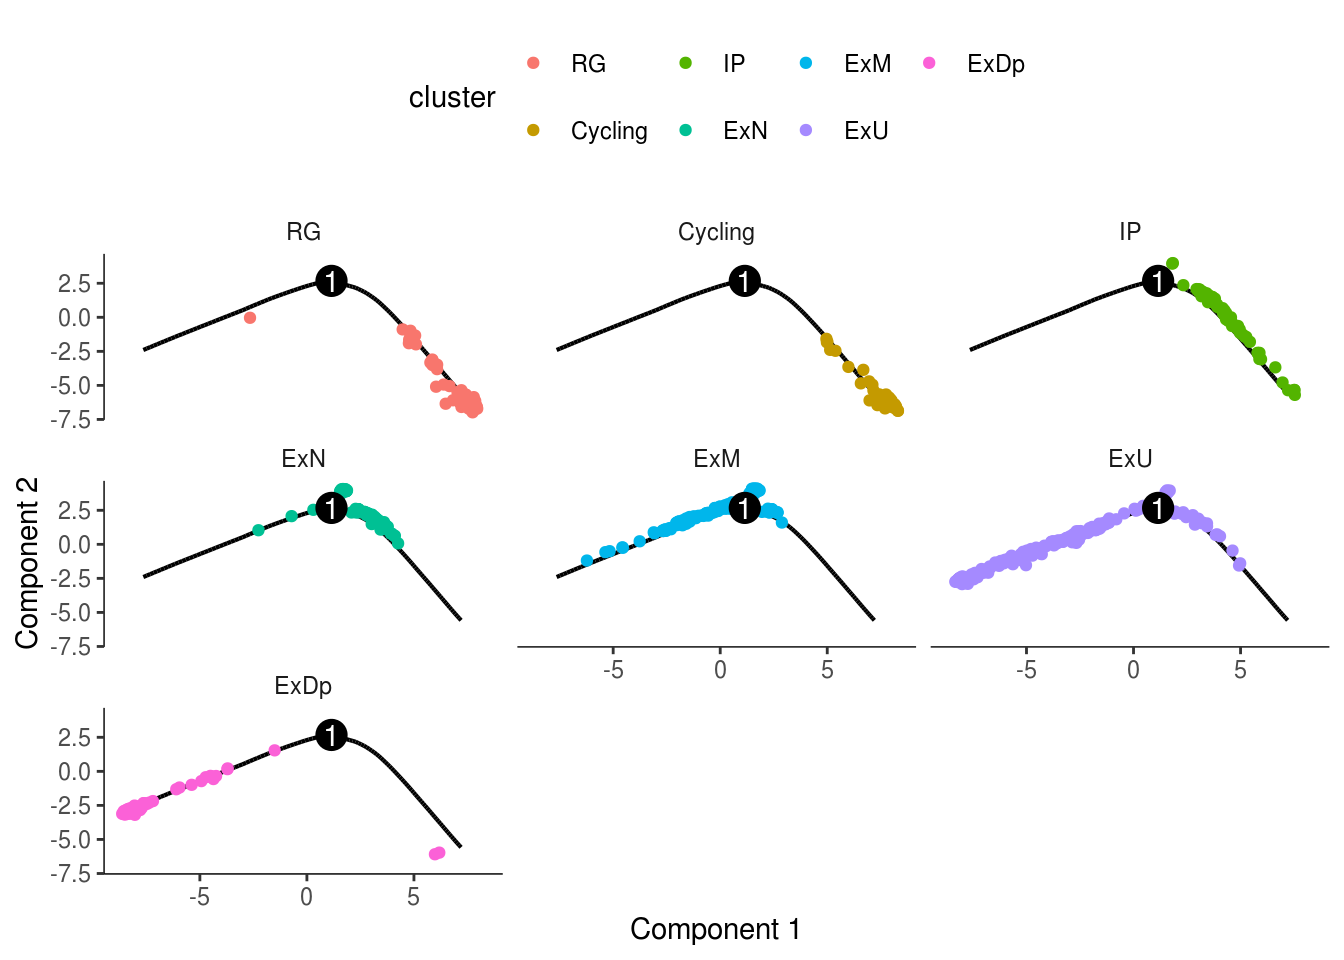
monocle::plot_cell_trajectory(cds, color_by = "cluster") + facet_wrap(~cluster)
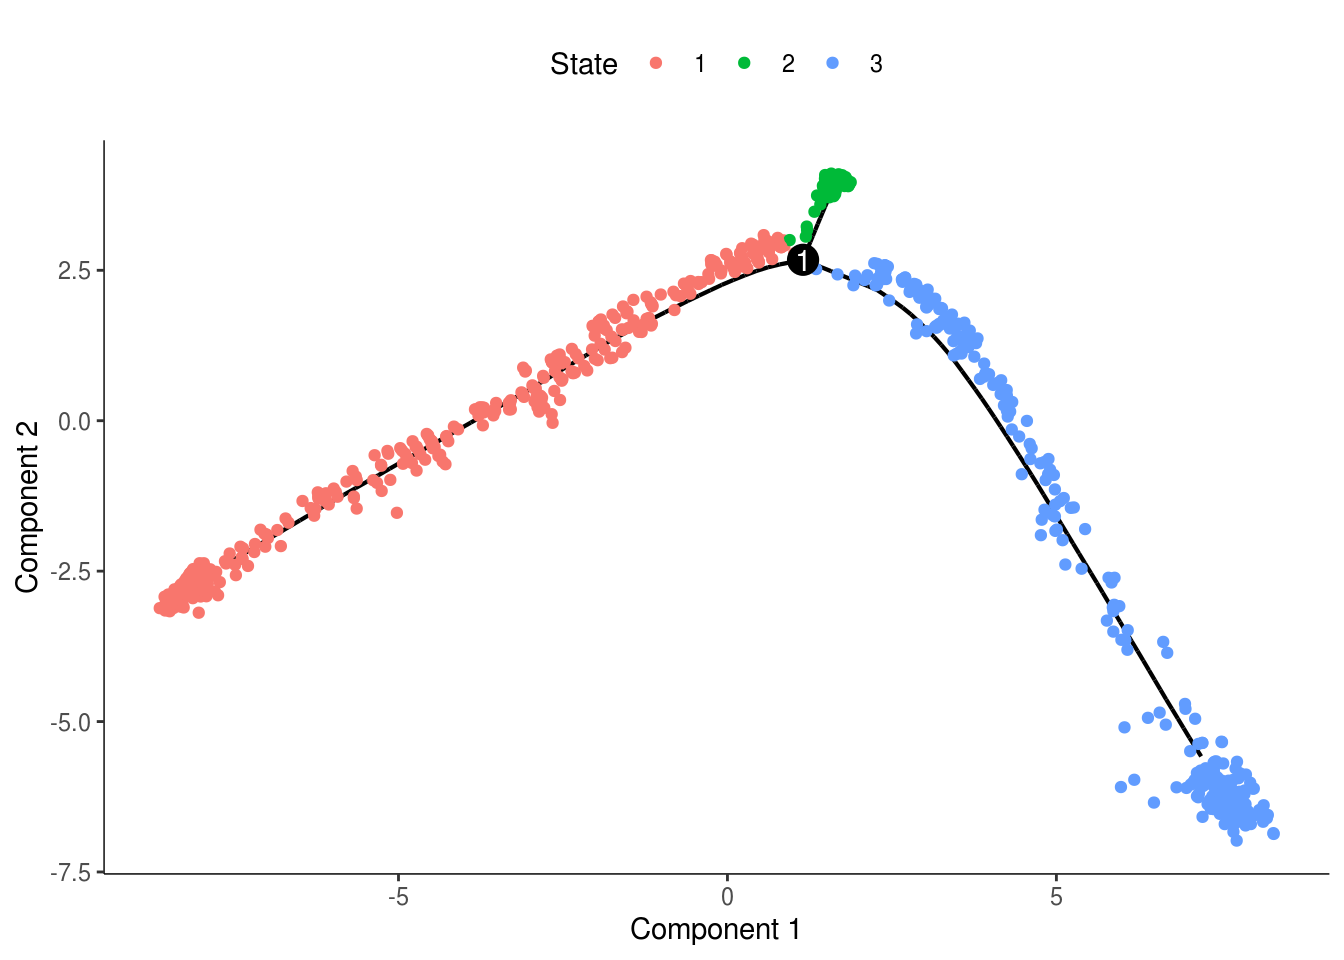
monocle::plot_cell_trajectory(cds, color_by = "State")
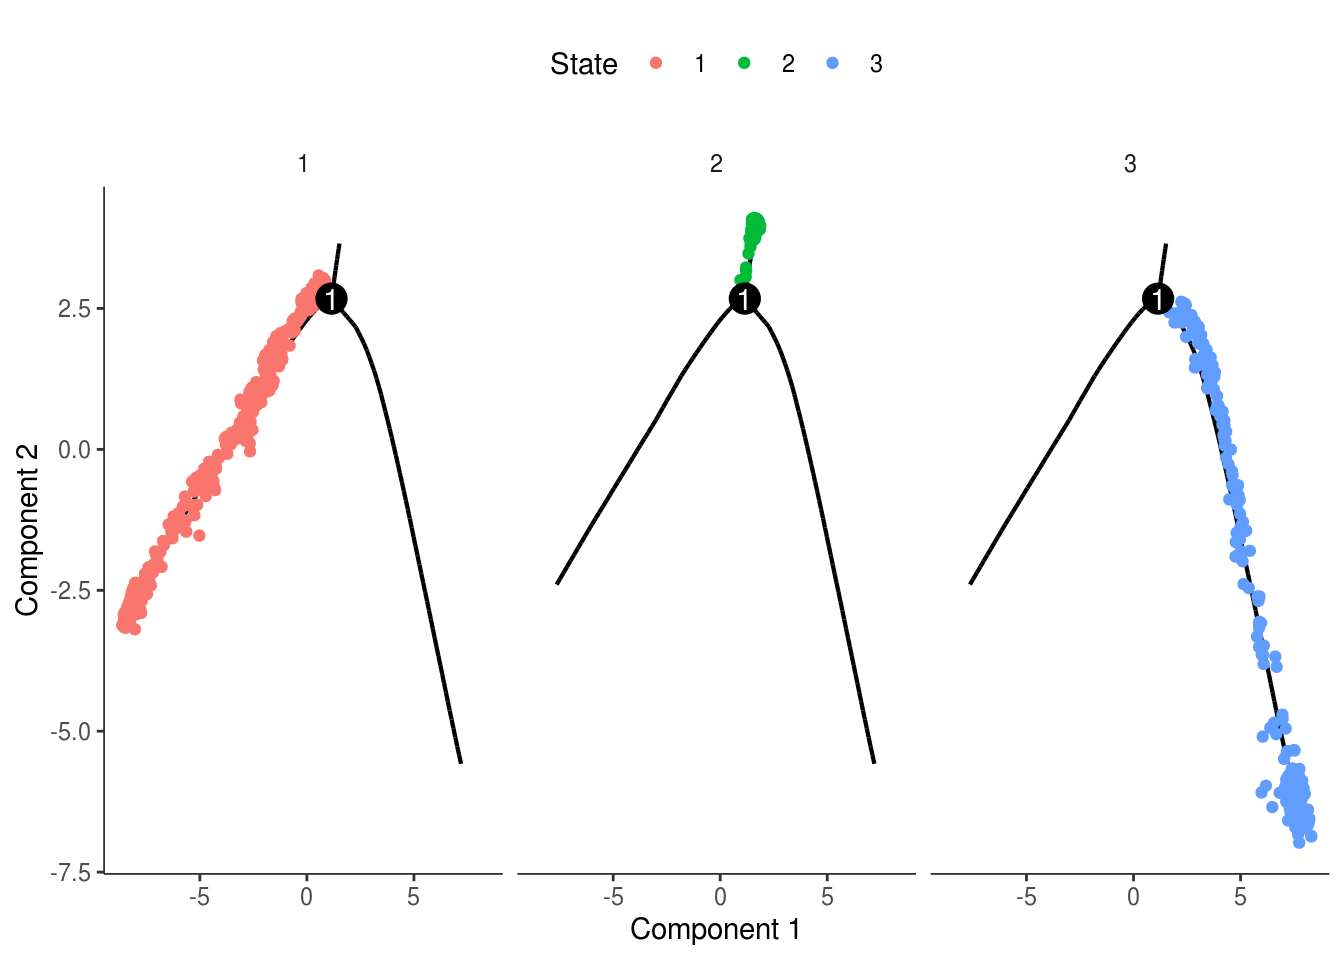
monocle::plot_cell_trajectory(cds, color_by = "State") + facet_wrap(~State)
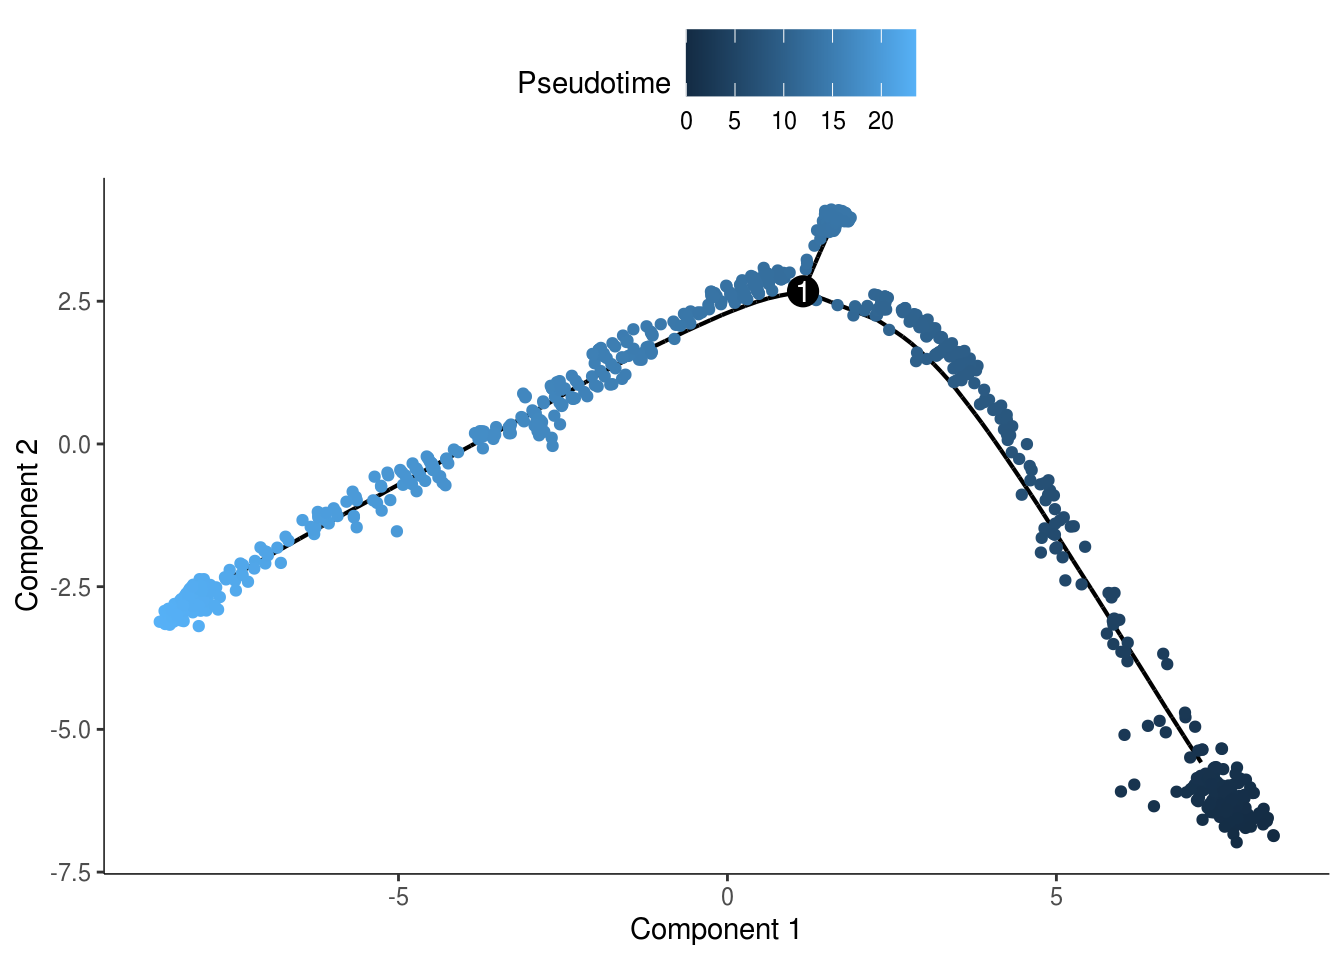
monocle::plot_cell_trajectory(cds, color_by = "Pseudotime")
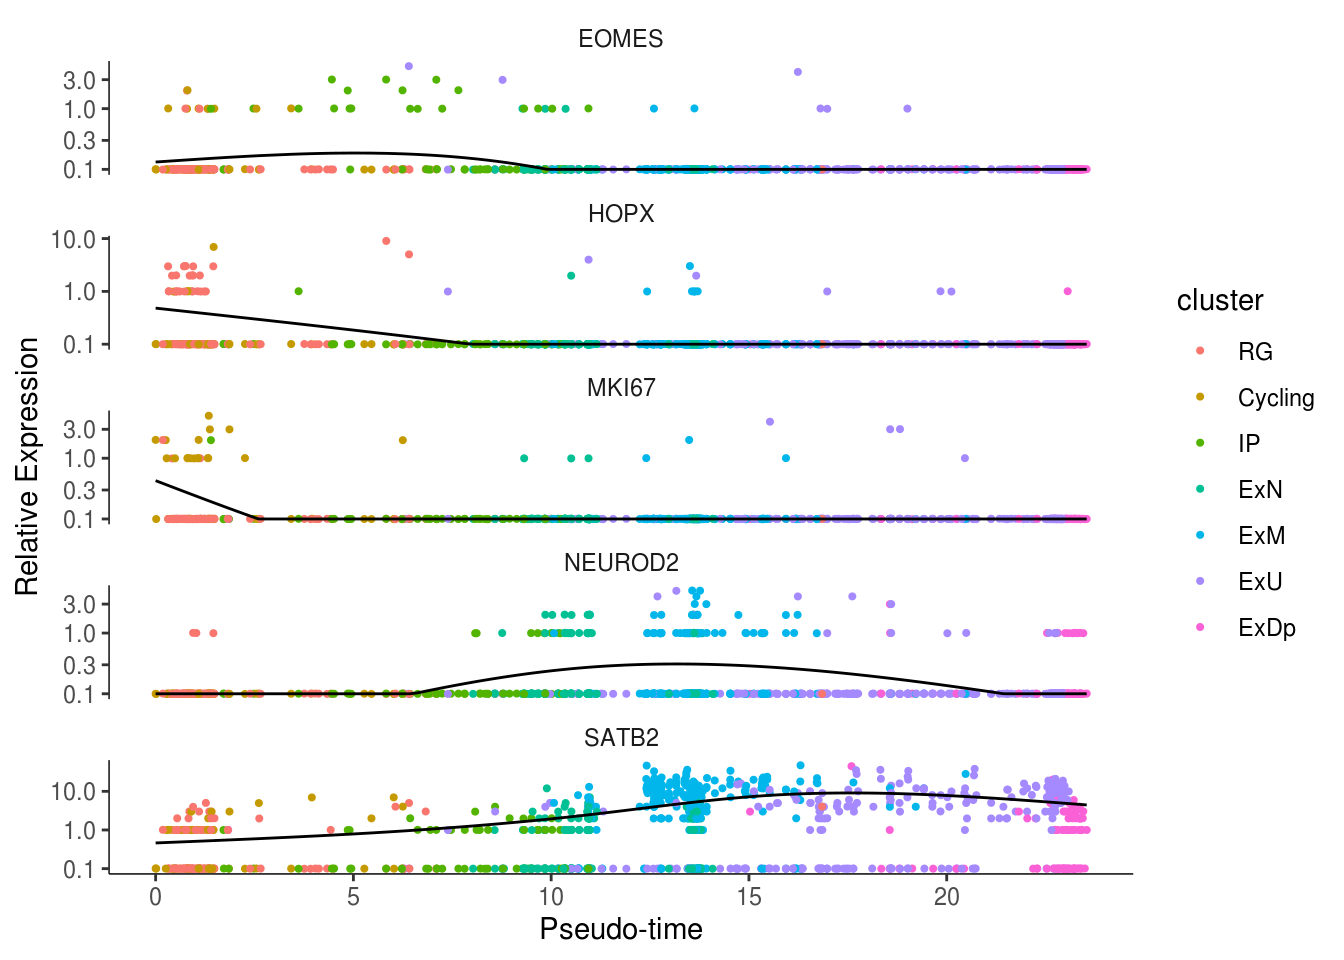
- Visualize gene expression
my_genes <- c("HOPX", "MKI67", "EOMES", "NEUROD2", "SATB2")
cds_subset <- cds[my_genes,]
plot_genes_in_pseudotime(cds_subset, color_by = "cluster")
