Chapter 9 Cardiovascular System II
9.1 Blood Flow Through Vessels
The amount of blood flow through a vessel F is shown in equation (9.1):
F=ΔPR
Where ΔP is the pressure gradient and R is the resistance of the blood vessels.
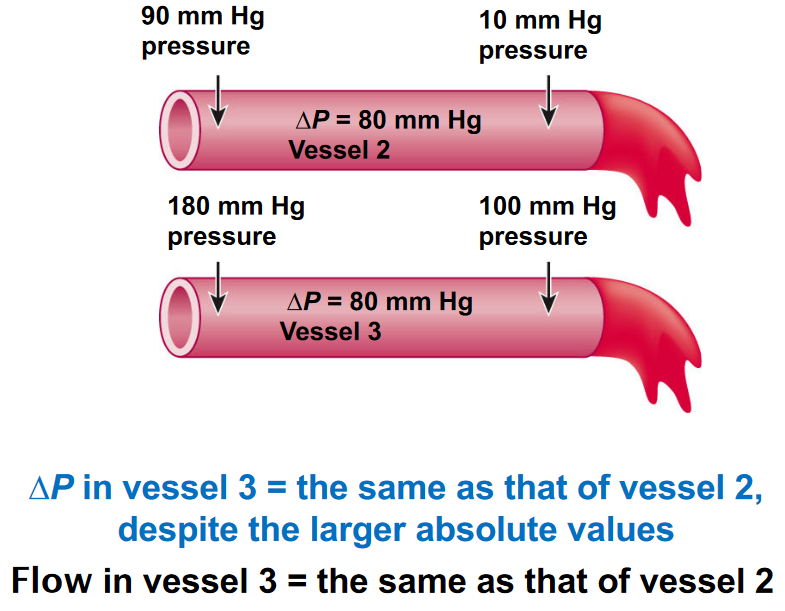
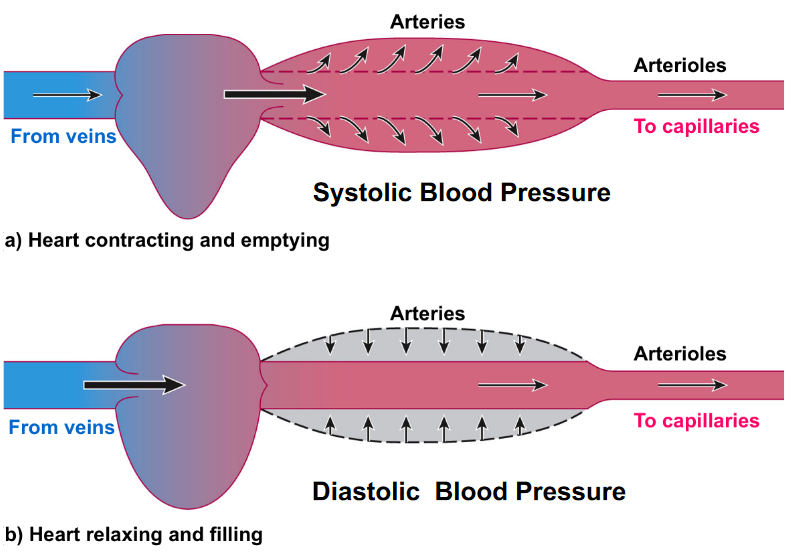
Figure 9.1: An Example of Pressure Gradients
9.1.1 What influences R?
A longer vessel raises the resistance of the vessel. Similarly, a smaller vessel radius r also confers a greater resistance.
In general, R is proportional to 1r4.
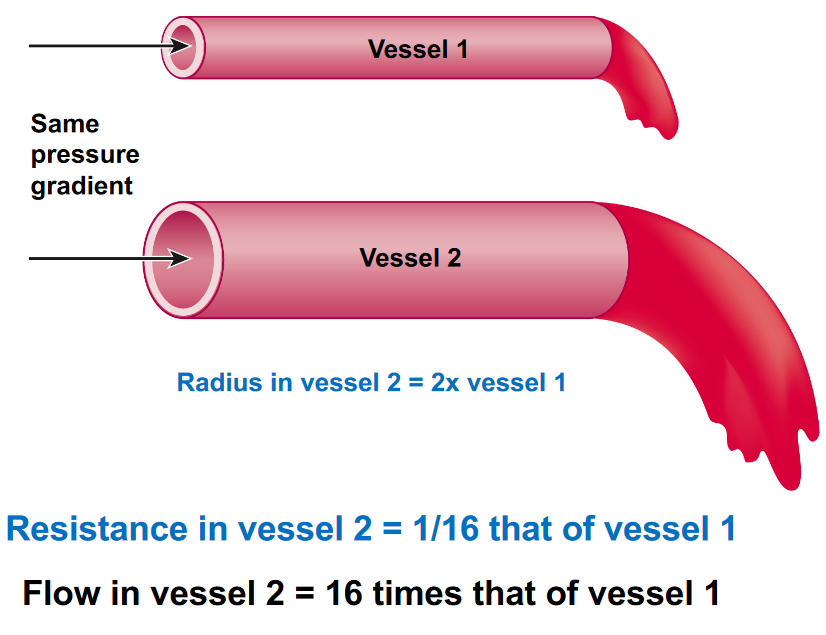
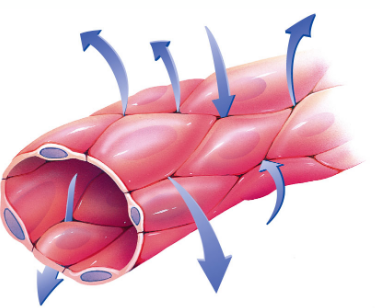
Figure 9.2: Vessel Radius Demonstration
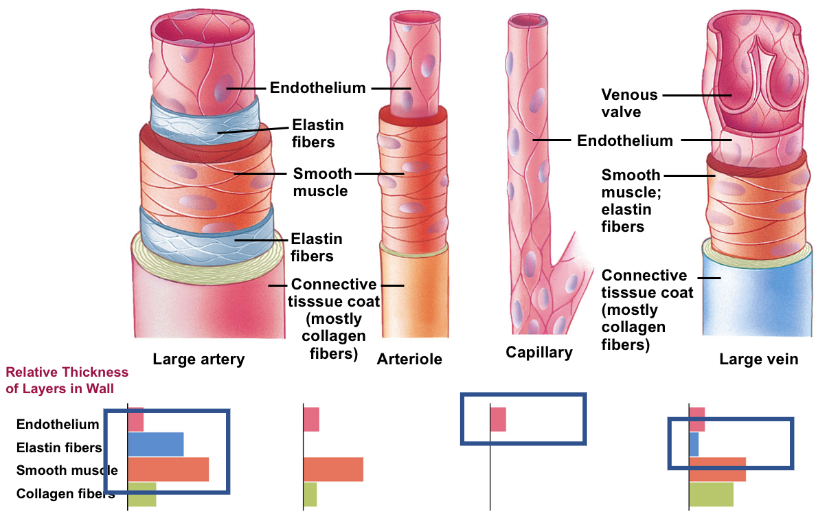
9.2 Blood Vessels
9.3 Heart Beat
All cardiac impulses originate at the sinoatrial (i.e., SA) node and spreads to the left and right atria (hence resulting in atrial contractions). The electrical impulse passes from the atria to the atriovenicular node.
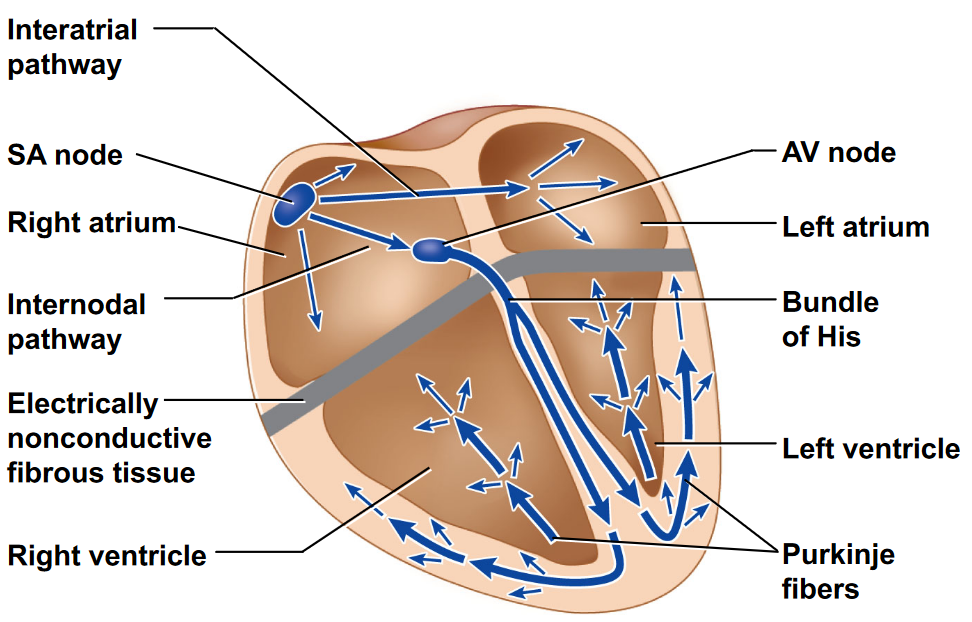
Figure 9.6: Electrical Signals in the Heart
The impulse then travels down the bundle of his (i.e., left and right bundle) before it rapidly moves through the Purjinke fibers and cause ventricular contraction.
9.3.1 Generating the electrical impulses.
Autorhythmic cells generate electrical impulses spontaneously; they deliver electrical impulses to gap junctions and carry excitations to neighboring cardiac muscle cells (i.e., contractile cells):
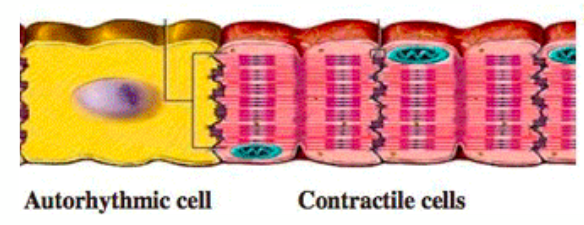
Figure 9.7: Contractile and Autorhythmic Cells
9.3.2 Ions and ion channels
There are two kinds of sodium ion channels:
- A fast channel
- A funny channel (i.e., slow)
Similarly, there are also two kinds of calcium ion channels:
- T type transient calcium channel (fast)
- L type long lasting calcium channel (slow)
Potassium ions diffuse out of the cell - there are also many types of potassium ions channels.
9.3.3 Pacemaker action potential
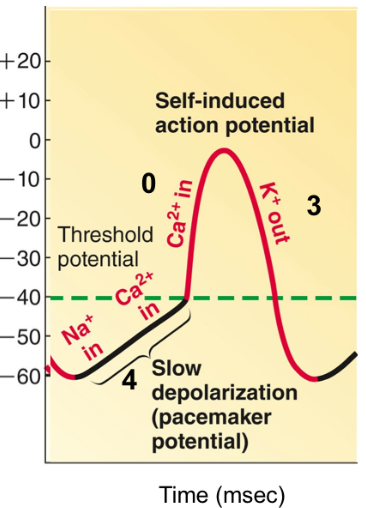
Figure 9.8: Pacemaker Action Potential
In phase 4, sodium ions diffuse in via the funny channels; calcium ions diffuse in via the L type channels at phase 0. In phase 3, potassium ions leak out of the heart.
Note that the SA node is the natural pacemaker in the human heart; when the SA node is diseased, other tissues can “take over.”
The heart rate is also moderated by the autonomic nervous system. The parasympathetic nervous system slows down heart rates by delaying the closure of potassium ion channels. This is in contrast to the sympathetic nervous system which increases heart rates by increasing the influx of sodium ions:
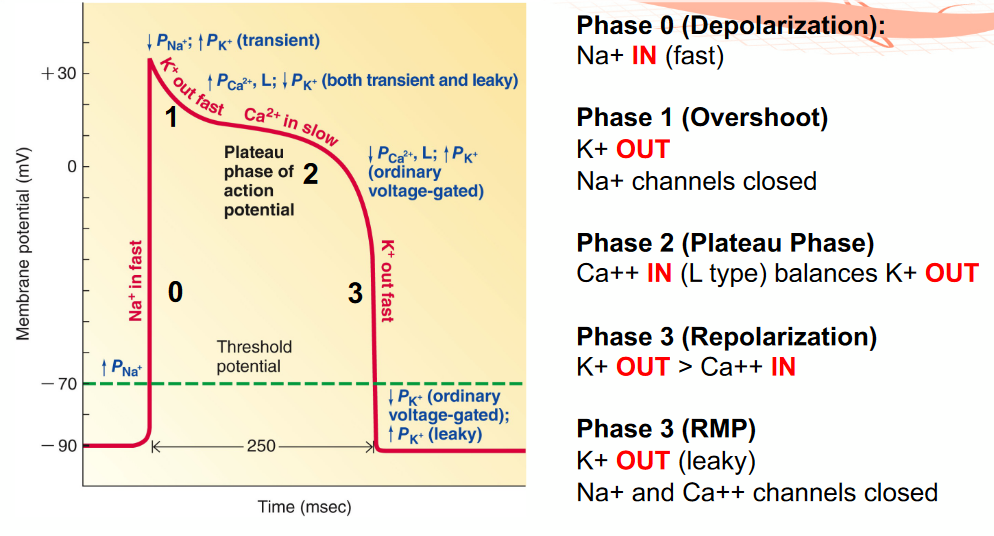
Figure 9.9: Contractile Cell Action Potential
Also, note the following differences between autorhythmic and contractile cells:
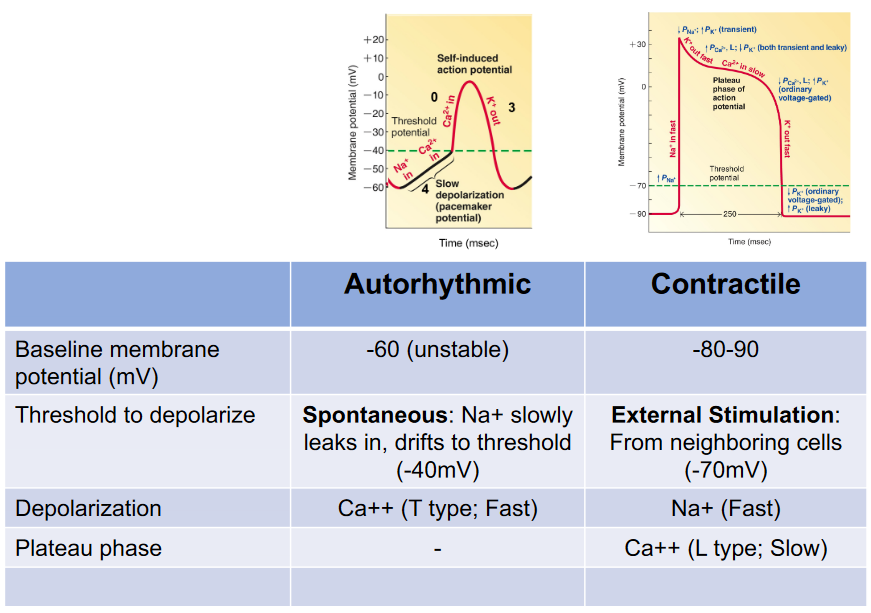
Figure 9.10: Differences Between Autorhythmic and Contractile Cells
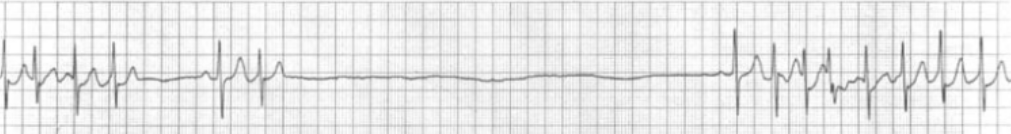
9.4 Electrocardiograms (ECGs)
The electrical activity of the heart can be captured via a 12-lead electrocardiogram - a heart beat is represented as such:
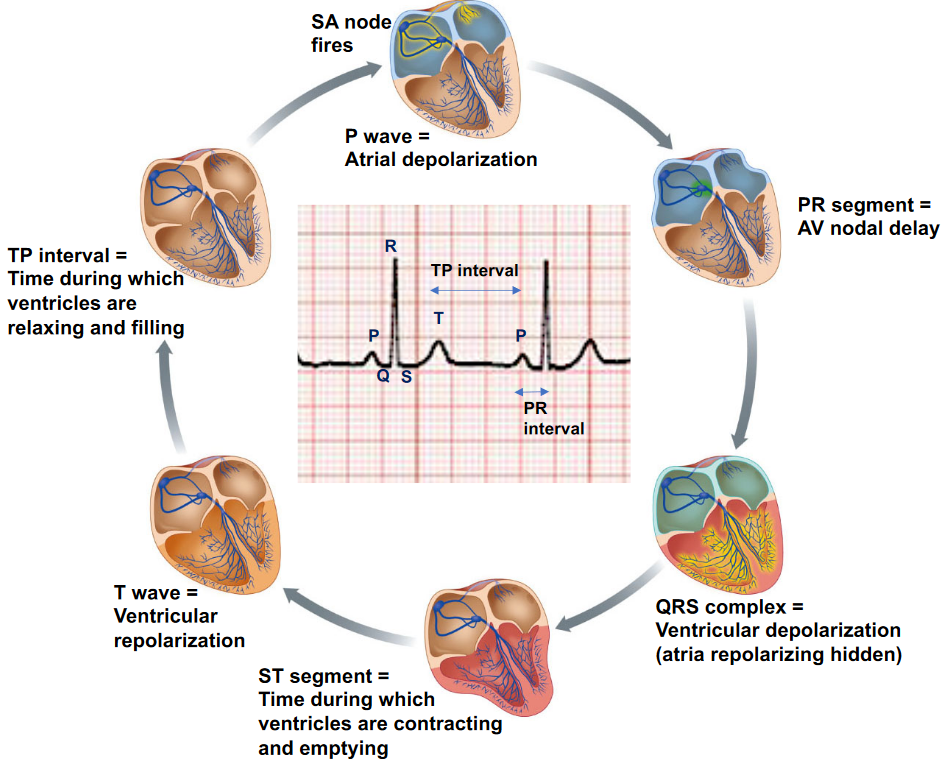
Figure 9.12: Segments of a Heart Beat
The P wave represents atrial contraction; the QRS complex represents ventricular contraction and atrial relaxation. The T wave represents ventricular relaxation and the PR segment represents the delay in the AV node.