Chapter 8 Cardiovascular System
In this lecture, the following topics will be covered (in order):
- Anatomy of the Heart
- Dual Circulation of the Heart
- Cardiac Cycle and LV Hemodynamics
- Flow, Pressure, and Resistance in the Blood Vessels
- Electrical Conduction in the Heart
8.1 The Heart
The heart is about the size of one’s fist (i.e., 200 - 400 grams in mass); it beats about 100000 times per day and pumps about five to seven liters of blood per minute.
8.1.1 Just where is the heart and what does it do?

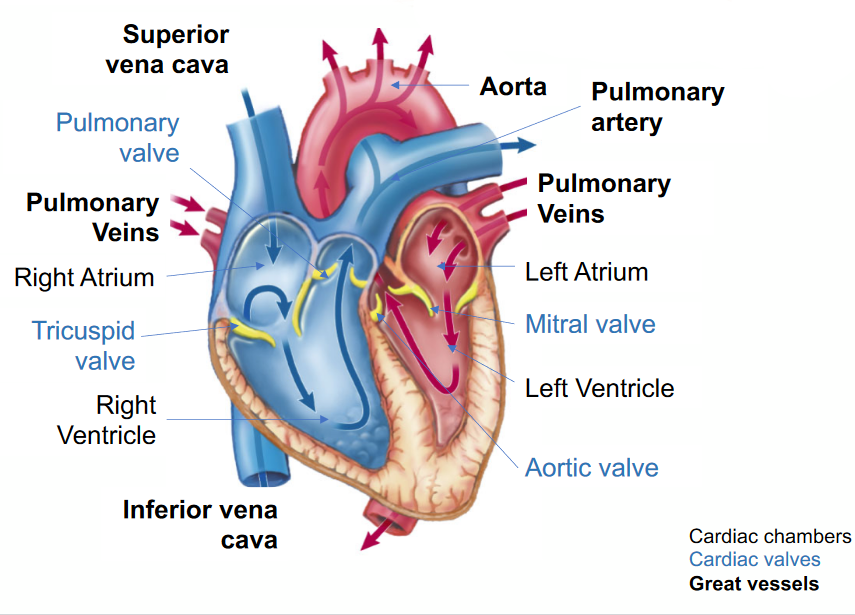
Figure 8.1: Structures of the Heart
The heart is between the lungs and slightly oriented to the left (in most individuals) - it is also a part of the body’s circulatory system (obviously)!
Figure 8.2: Location of the Heart on an X-Ray
The heart serves to oxygenate blood (via pulmonary circulation) and deliver it (via systemic circulation) to organs while also collecting deoxygenated blood from organ systems.
Figure 8.3: Pulmonary and Systemic Circulation of the Heart
Note that blood in systemic circulation takes the following pathway: pulmonary veins - left atrium - left ventricle - aorta - systemic arteries - organs.
Blood in pulmonary circulation takes on the following pathway: pulmonary artery - capillaries - pulmonary veins
8.2 Cardiac Events and Layers of the Heart

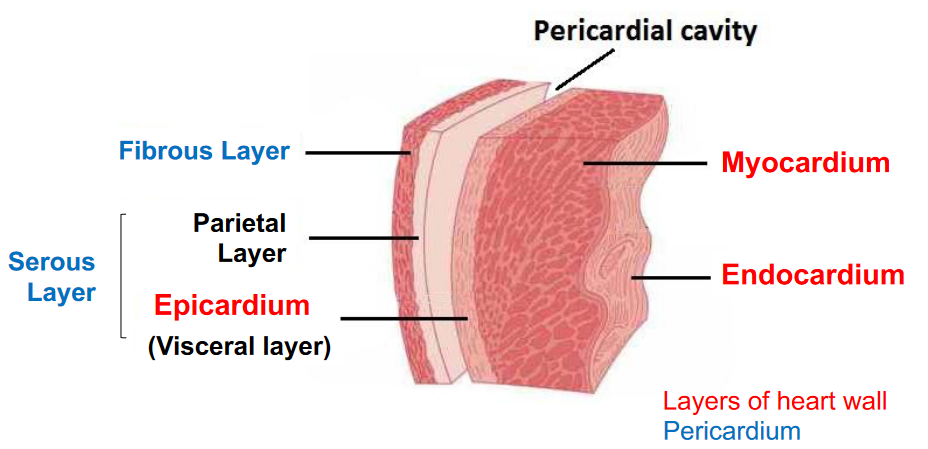
Figure 8.4: Layers of the Heart
The fibers in the heart (i.e., Purjinke fibers) are oriented in a clockwise manner:
Figure 8.5: Orientation of Heart Fibers
8.2.1 Cardiac Events
Here are some cardiac events to take note of:
The ventricular systole happens when the ventricle contracts to eject blood out of the aorta. Consequently, LV pressure increases to open the aortic valve; the mitral valve also closes.
This is in contrast to the ventricular diastole: where the ventricle relaxes and fills with blood from the left atrium. LV pressure drops, the mitrial valve opens, and the aortic valve closes. This event also has two phases: an early passive filling and an active atrial contraction.
Furthermore, the isovolumetric ventricular contraction happens when all valves are closed. The LV pressure increases and there is no change in volume; this happens prior to the aortic valve opening.
Isovolumetric ventricular relaxation also happens when all valves are closed. There is no change in volume and this happens before the mitral valves are opened.
Figure 8.6: Cardiac Activity
8.2.1.1 Left ventricular volumes and function
The End-diastolic volume(i.e., the EDV) is the LV volume when the LV is the “largest.” This is in contrast to the End-systolic volume (i.e., the ESV): the LV volume when the LV is the “smallest.”
The stroke volume is the difference between EDV and ESV (i.e., stroke volume = EDV - ESV).
The ejection fraction can be calculated via the following formula:
Ejection fraction=SVEDV∗100
This represents the fraction of blood ejection with each cardiac cycle.
The cardiac output is the product of the stroke volume and the time in hours.
The cardiac input is the quotient of the cardiac output and the body surface area (i.e., Cardiac input=cardiac outputtotal body surface area).
The left ventricle’s pressure-volume (i.e., PV) looks something like this (descriptions are taken from prof. Malcolm’s slides):
Figure 8.7: PV Loop in Left Ventricle
8.2.1.2 Left ventricular PV loop
This requires a pressure catheter in the left ventricle for accurate assessment (an invasive process).
This pressure-volume loop is also important for understanding cardiac physiology and diseases. Not only does it lend insight into the mechanical properties of the heart (i.e., contractility, stiffness, and compliance), but it also guides diagnoses and the treatment of cardiovascular diseases.
8.2.1.3 Preload, afterload, and inotropy
An increased preload on the heart leads to an increased stroke volume up to a certain point (i.e., the Frank Starling Law).
An increased afterload on the heart leads to the left ventricle having a reduced stroke volume.
Lastly, increased inotropy increases the contractility of the left ventricle.
NB: All of the above are inter-related - a change in one of these factors will affect the rest!
8.2.1.4 Frank Starling law
“Stroke volume of the heart increases in response to an increase in the volume of blood in the ventricle, before contraction…”
— Some source off prof. Malcolm’s slides
The Frank-Starling law states that the contraction strength of the heart is directly proportional to the initial length of the muscle fiber. Hence, when ventricular muscle is stretched by an increased amount of blood, the more powerful the contraction of the ventricle and the larger the stroke volume (i.e., SV).
Hence, increasing the contractility of the ventricle also increases the preload of the ventricle.
8.2.2 Adaptation of the myocardium
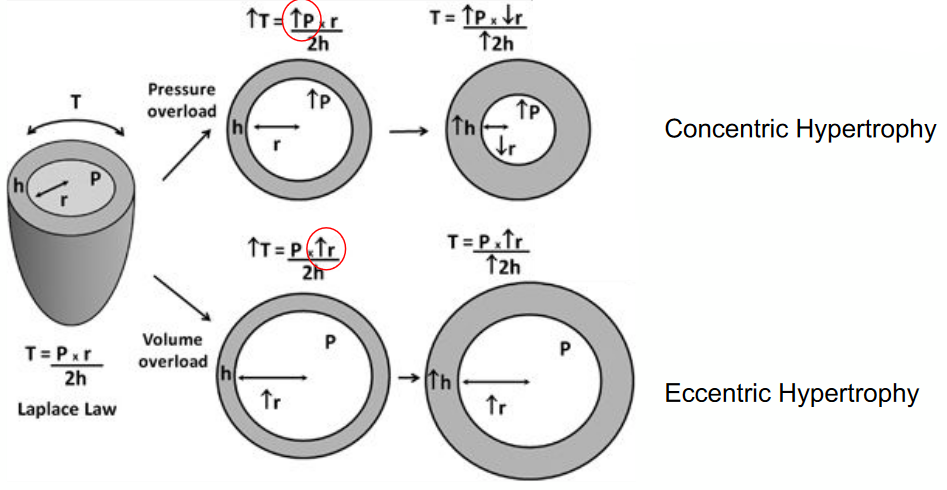
The myocardium adapts to various conditions to maintain cardiac output. Hence, when the myocardium fails to adapt, heart failure and decompensation occurs.
Many cardiovascular diseases have mechanisms that are complex and multi-factorial: a combination of preload, afterload, contractility, and compliance.

Figure 8.8: LaPlace’s Wall Stress Formula
8.2.3 Effects of preloop, afterloop, and interloop on PV loop
8.2.3.1 The preload
Figure 8.9: Preload and PV Loop
The pressure-volume loop shifts to the right, there is an increase in the EDV, the stroke volume, the ESV, and the LV pressure.
The preload is another term to refer to the EDV.
8.2.3.2 The afterload
Figure 8.10: Afterload and PV Loop
The PV loop shifts to the right, there is an increase in LV pressure, ESV, and EDV, but a reduction in stroke volume.
The afterload is the tension that ventricles must develop to effectively pump blood against the resistance of the vascular system. Note that damaged valves (e.g., stenosis) makes valves harder to open and hence cause an increase in the afterload.
8.2.4 ESPVR and EDPVR
The end-systolic pressure volume relationship (i.e., ESPVR) is a measure of LV contractility or inotropy. The steeper the slope, the higher the contractility:
Figure 8.11: ESPVR Slopes
The end-diastolic pressure volume relationship (EDPVR), on the contrary, is a measure of LV compliance. A steeper slope indicates a less compliant left ventricle.
8.2.4.1 Contractility and Compliance and their effects on the PV loop
An increase in contractility shifts the PV loop to the left (hence a more non-compliant LV), hence increasing stroke volume and LV pressure and decreasing the ESV and the EDV.
Figure 8.12: Compliance and the PV Loop
Contractility is the force of the contraction of the heart muscle - the stronger the contraction, the greater the stroke volume and the smaller the end systolic volume (i.e., ESV).
An increase in compliance shifts the PV loop to the right, increases stoke volume, ESV and EDV, and the LV pressure.