5.1 Quick revision
Lunn and McNeil (1991) compared the dimensions of jellyfish at two sites at Hawkesbury River, NSW (Dangar Island; Salamander Bay) to determine the difference between the jellyfish at each site. A histogram of the breadth of jellyfish at Dangar Island Bay is shown in Fig. 5.1.
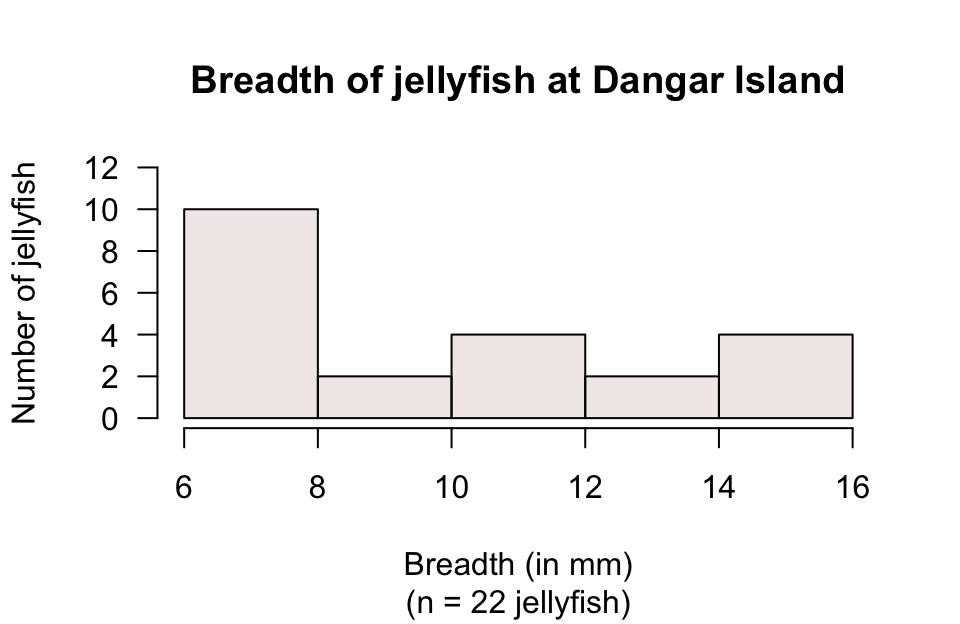
FIGURE 5.1: A histogram of the breadth of jellyfish at Dangar Island
- Two students are arguing about the median breadth. Who is correct?
Student 1 says:
The bars in the histogram have heights of \(10\), \(2\), \(4\), \(2\) and \(4\). When these numbers are put in order, they are: \(2\), \(2\), \(4\), \(4\), \(10\). The median breadth is the median of these numbers, so the median breadth is the middle one: \(4\) mm is the median.
Student 2 responds:
You have the correct answer, but for the wrong reason! There are five bars, and the middle bar is the third bar. Since the third bar has a height of \(4\), the median breadth is \(4\) mm.
- Describe the histogram.
- A boxplot comparing the breadths of jellyfish at Dangar Island and Salamander Bay is shown in Fig. 5.2. Describe and compare the breadths of the jellyfish.
- Which box in the boxplot represents the Dangar Island jellyfish (shown in Fig. 5.1)?
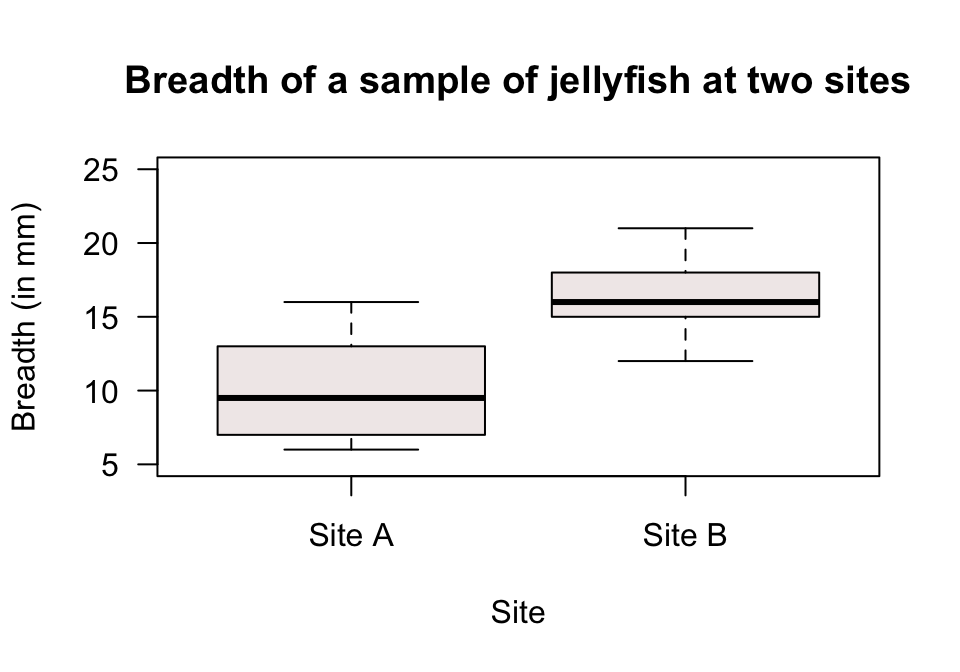
FIGURE 5.2: A boxplot of the breadth of jellyfish at two sites
- Discuss in class.
- The sample is small, so hard to too certain: Average about \(10\) mm; data from about \(6\) to \(16\) mm; slightly right skewed; no outliers..
- Discuss in class.