4.3 Folding of Polypeptides to Globular Structures
Christian Anfinsen’s classic experiment in 1961 proved that the amino acid sequence of a protein determines its 3D structure.
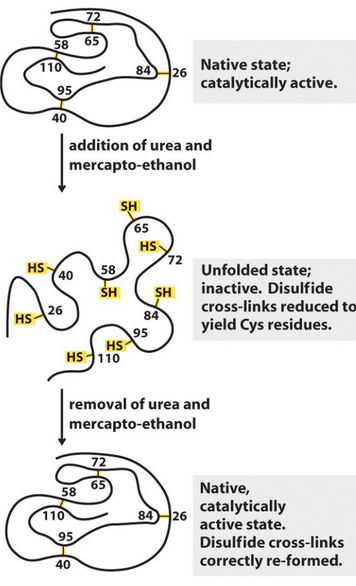
Figure 4.9: Denaturation of Ribonuclease
As shown in figure 4.9, the enzyme ribonuclease can be unfolded with urea and β-mercapthoethanol via the cleaving of disulfide bonds.
Nonetheless, Anfinsen showed that the structure (and hence function) of ribonuclease could be restored under the correct conditions.
4.3.1 Critical concepts in protein folding
Protein folding and stability are carried out by a delicate balance of many weak (and noncovalent) forces that balance each other out to favor the folded state.
Using equation (1.1), one can state that:
ΔGunfolded→folded=ΔHU→F−TΔSU→F<0
Where:
- S describes all the possible configurations associated with the protein and its solvent.
- H includes all the internal energy components of the protein and the solvent - for instance, electrostatic bonding, hydrogen bonding, and van der Waals interactions.
Hence, the ΔHU→F−TΔSU→F portion of equation (4.1) can be re-written as:
ΔGU→F=(ΔHpro+ΔHsol)−T(ΔSpro+ΔSsol)
Depending on the signs of ΔS and ΔHpro in equation (4.2), several critical generalizations can also be made:
When ΔS<0, there is an unfavorable protein conformational entropy: the unfolded state of the protein is favored.
When ΔSsol>0, there is a favorable solvent entropy: hydrophobic groups are buried in the protein.
When ΔHpro<0, there is a favorable protein enthalpy: intermolecular interactions favor the folded state.
4.3.1.1 Unfavorable protein conformational entropy
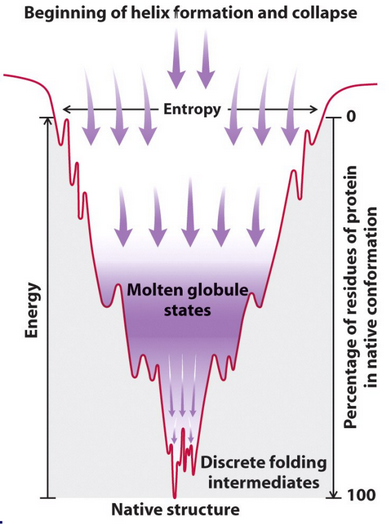
Figure 4.10: Entropy Collapse in Helix Formation
When ΔSpro<0, the protein goes from a disordered state (i.e., many microstates) to one that is well defined (i.e., few microstates). This is illustrated in figure 4.10.
The above is the very essence of protein structure-function; there needs to be a massive investment of energy to compensate for this highly unfavorable term.
Furthermore, hydrophobic groups in proteins will also tend to associate with one another as ΔSsol>0. In other terms, there are more microstates for proteins to be arranged in.
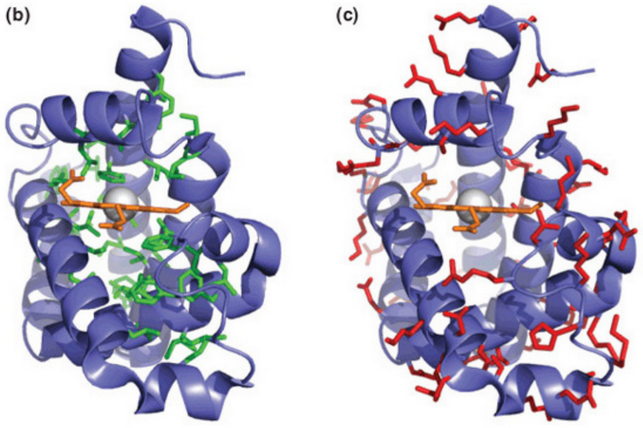
Figure 4.11: Hydrophobic and Hydrophilic Regions in Proteins
Generally speaking, hydrophilic groups (shown in red in figure 4.11) are exposed to the solvent. On the contrary, hydrophobic groups are buried (shown in green in figure 4.11).