6 Applications
Questions
- How are PC scores of wCV related to SQI?
- Which genes highly contribute to PC1?
- Is there any trend of wCV according to gene and sample properties?
- Descriptive statistics by SQI? Two groups are significantly different?
6.1 Principal component analysis
# Convert NA to 0
wCV.mat2 <- wCV.mat
wCV.mat2[is.na(wCV.mat2)] <- 0

# Remove constant rows (zero variance rows)
wCV.mat2 <- wCV.mat2[apply(wCV.mat2, 1, var)!=0, ]

# Perform PCA
pca_result <- prcomp(t(wCV.mat2), scale=TRUE)

# Contributions of each gene to the PC1
pc1_contributions <- abs(pca_result$rotation[, 1])
top_genes <- order(pc1_contributions, decreasing=TRUE)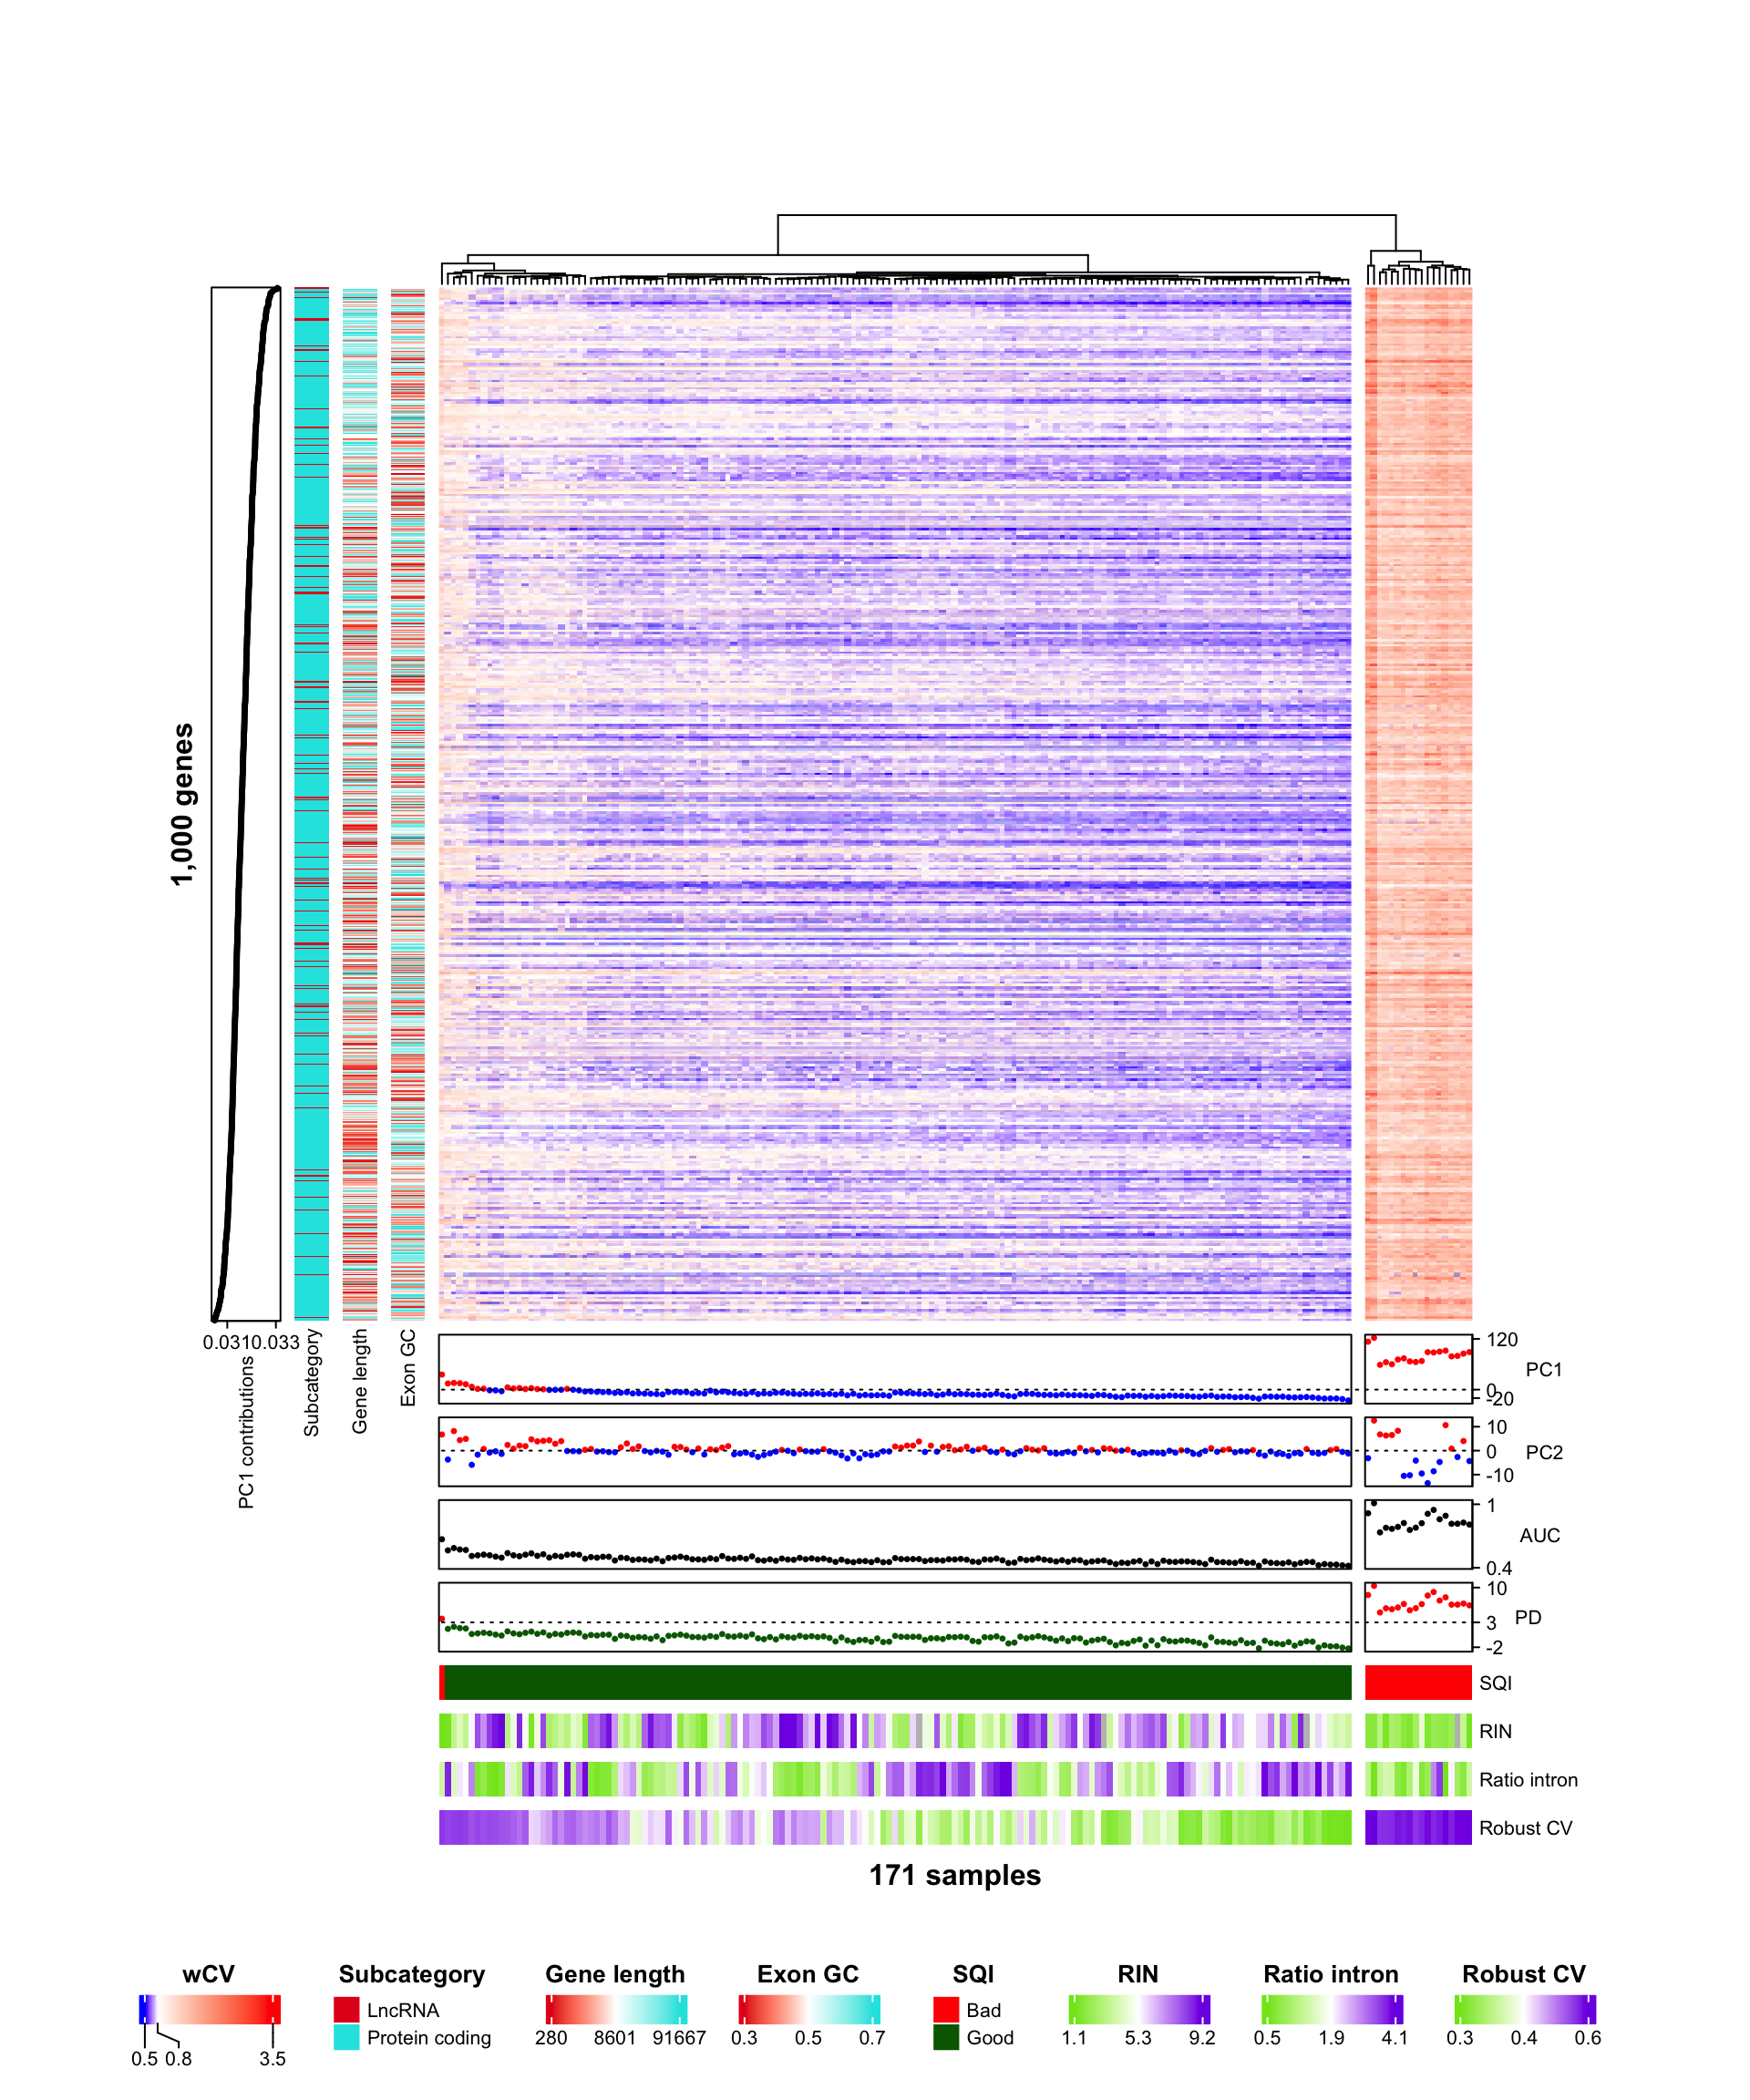
6.3 Table
table1(~ AUC + PD + RINs + RatioIntron + robustCV | SQI,
       data=SplAnnomat,
       render.continuous=function(x) {sprintf("%.2f [%.2f, %.2f]", median(x, na.rm=TRUE), min(x, na.rm=TRUE), max(x, na.rm=TRUE))}
)| Bad (N=19) |
Good (N=152) |
Overall (N=171) |
|
|---|---|---|---|
| AUC | 0.82 [0.67, 1.01] | 0.47 [0.42, 0.59] | 0.48 [0.42, 1.01] |
| PD | 6.58 [3.74, 10.34] | -0.12 [-2.25, 2.13] | 0.00 [-2.25, 10.34] |
| RINs | 2.80 [1.10, 4.60] | 5.70 [1.30, 9.20] | 5.30 [1.10, 9.20] |
| Missing | 1 (5.3%) | 3 (2.0%) | 4 (2.3%) |
| RatioIntron | 1.33 [0.57, 2.80] | 1.93 [0.46, 4.07] | 1.85 [0.46, 4.07] |
| robustCV | 0.56 [0.48, 0.60] | 0.36 [0.29, 0.44] | 0.36 [0.29, 0.60] |