3 Genome Alignment Profiles
The transcriptome coverage directly affects the accuracy of vital features of all gene expression studies1. Thus, we compared the coverage distribution of reads mapped in unaligned (unmapped bases), intergenic, intronic, and exonnic/protein coding and UTR regions in the FFT samples.
In the plot_GAP function, each percentage is defined as a proportion in the total regions of the genome using metrics about the alignment of RNA-seq reads.
##  PCT_Unaligned PCT_Intergenic   PCT_Intronic PCT_Coding.UTR
##           10.8           20.8           32.9           35.5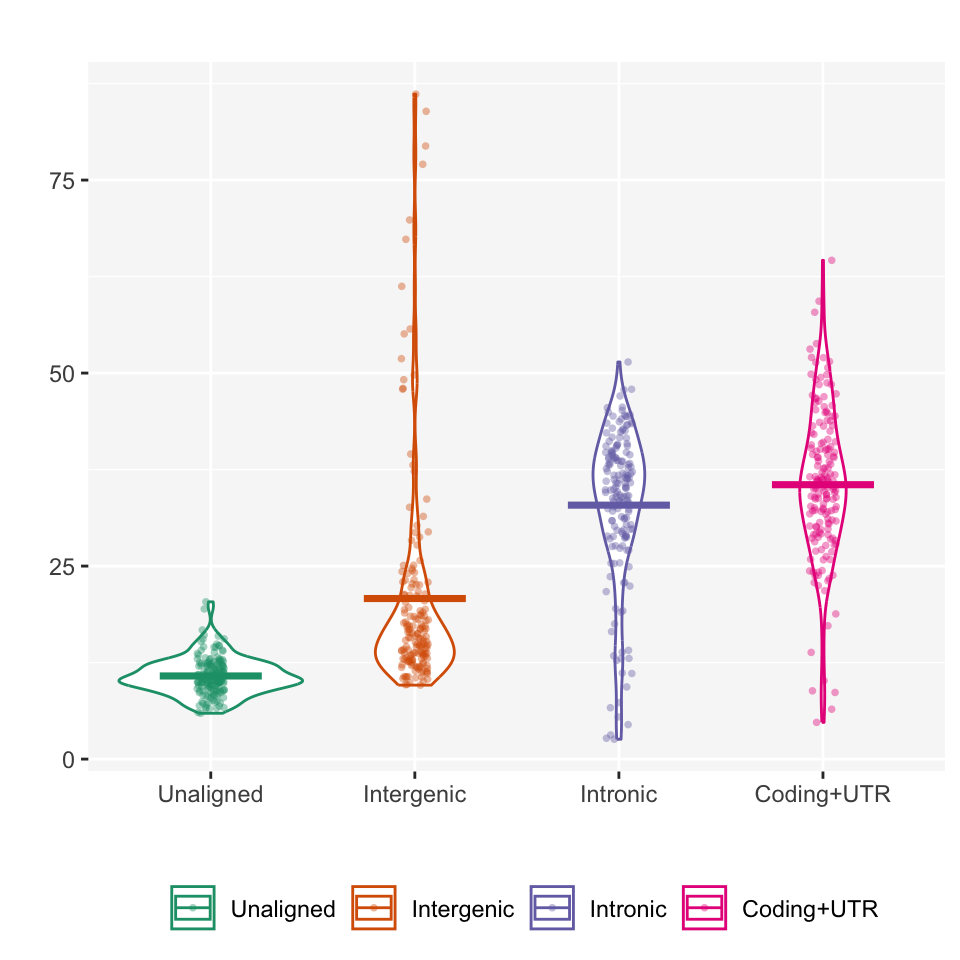
Zhao, W., He, X., Hoadley, K.A. et al. Comparison of RNA-Seq by poly (A) capture, ribosomal RNA depletion, and DNA microarray for expression profiling. BMC Genomics 15, 419 (2014). https://doi.org/10.1186/1471-2164-15-419↩︎