5.2 Boxplots
For this section, the data introduced in Sect. 4.1 are used.
- Use the jamovi menu: select Analyses> Exploration> Descriptives.
- Add the variables. Place the quantitative variable in the Variables area, and the qualitative variable in the Split by area.
- Then, click on the right-pointing arrow next to Plots, and in the Box Plots area select
Box plot. - You will have your graph in the jamovi Output window.
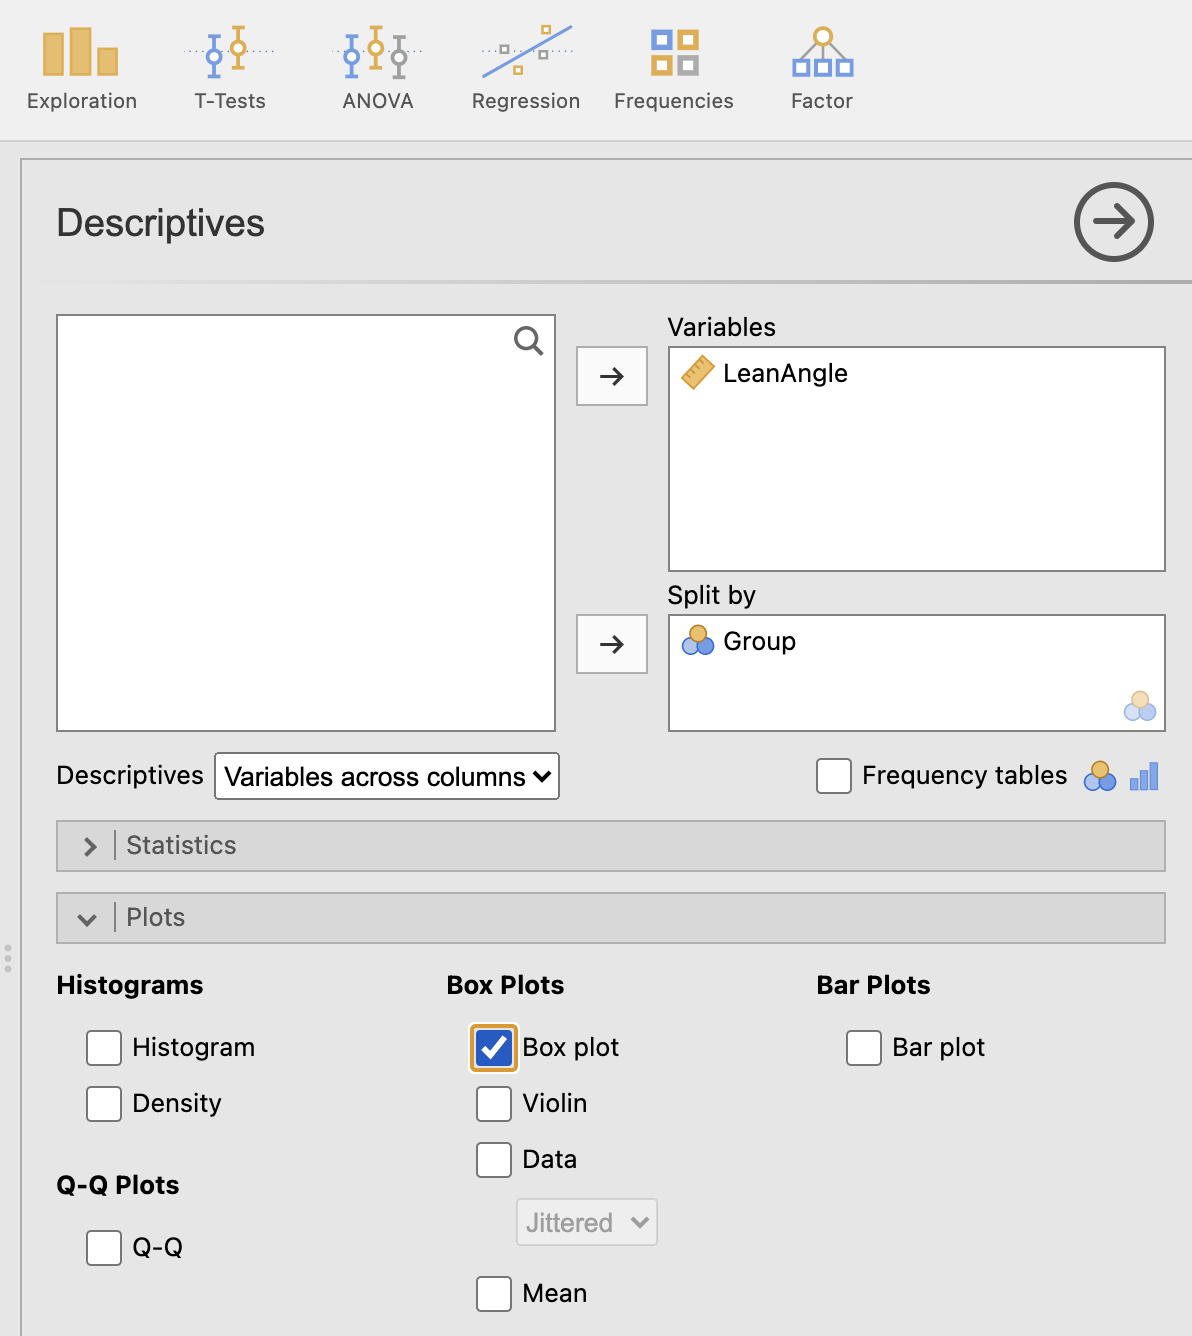
FIGURE 5.3: Selecting the variables for a boxplot