3.2 Data entry
In jamovi, the two columns are set up as follows:
- Diet:
1means ‘Vegetarian’ (i.e. in Row 1 of the data table), and2means ‘Non-vegetarian’ (i.e. in Row 2 of the data table in Table 3.1). - B12:
1means ‘B12 deficient’ (i.e. in Column 1 of the data table), and2means ‘Not B12 deficient’ (i.e. in Column 2 of the data table in Table 3.1); see Fig. 3.1.
The data needs to be set up so that each row represents one unit of analysis. That means there will be \(124\) rows of data: one for each person (unit of analysis).
In jamovi, the data are entered as shown in Fig. 3.1; there are \(124\) rows, but we only show some of these rows to save space.
Each row in the jamovi data represents one unit of analysis.
Each column in the jamovi data represents one variable.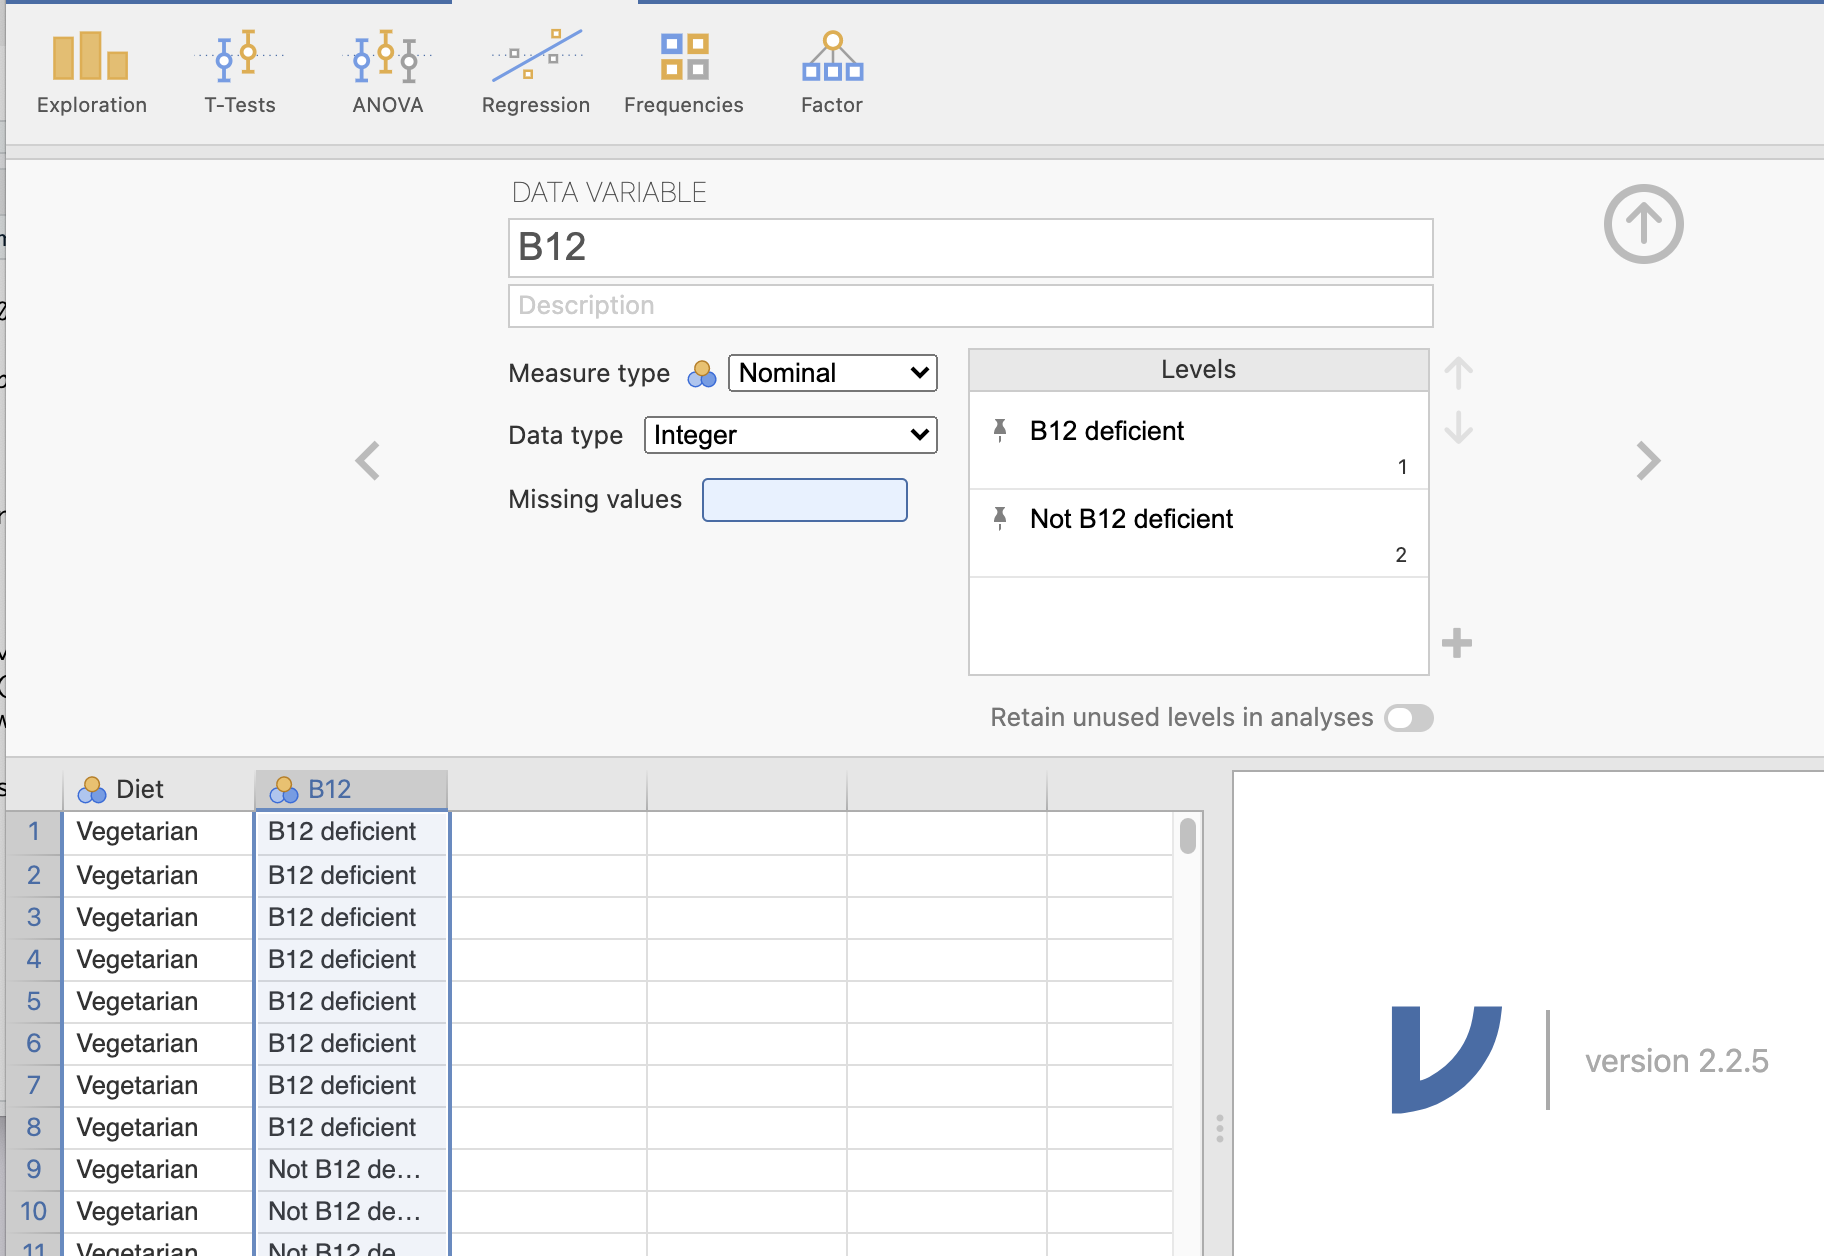
FIGURE 3.1: The B12 data entered into jamovi
Note that I entered
1 and 2 into the jamovi worksheet:
jamovi just shows what these mean in the worksheet, because I have told jamovi what the 1 and the 2 mean.
Your data is now set up and ready to use.