5.7 Determining estimated positions
We’ve determined a course to steer, which we intend to hold constant throughout the crossing. We know that the tidal stream will vary through the crossing, so we’ll follow a curved track relative to the seabed. It is useful to find out what this track will be. Firstly, this allows us to check that we’re not going to end up somewhere that we don’t want to be - e.g. in a shipping lane or an area of overalls. Secondly, we can use these estimated positions to check our progress - by comparing them to our actual positions each hour, determined by GPS or other means.
The estimated positions are used by sequentially laying out the tidal drift vector (different each hour), then the paddling vector (the same each hour).
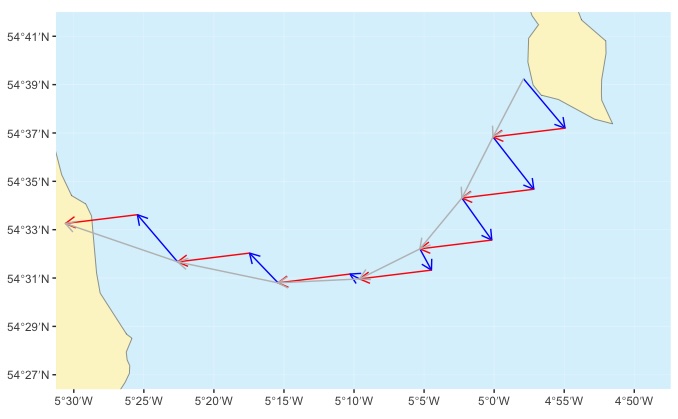
In the diagram, the tidal drift arrows are shown in blue and the paddling arrows in red. We’ll follow a track that is close to the grey line.
We’ll remind ourselves of the tidal drifts we expect each hour for our example crossing:
| Time (BST) | Bearing | Expected rate August 9th |
|---|---|---|
| 09:30-10:30 | 76˚ | 2.0 kt |
| 10:30-11:30 | 70˚ | 1.1 kt |
| 11:30-12:30 | 172˚ | 0.5 kt |
| 12:30-13:30 | 234˚ | 1.4 kt |
| 13:30-14:30 | 262˚ | 2.8 kt |
In the previous section, we calculated that our course to steer is 173˚ - and, of course, our paddling vectors will be 3 nautical miles for each hour given our 3 knot paddling speed.
So, we’ll draw out:
Hour 1 tidal drift arrow: 2 nautical miles at 76˚
Hour 1 paddling arrow: 3 nautical miles at 173˚
Hour 2 tidal drift arrow: 1.1 nautical miles at 70˚
Hour 2 paddling arrow: 3 nautical miles at 173˚
Hour 3 tidal drift arrow: 0.5 nautical miles at 172˚
Hour 3 paddling arrow: 3 nautical miles at 173˚
etc…
We’ll end up with a plot that looks something like this:
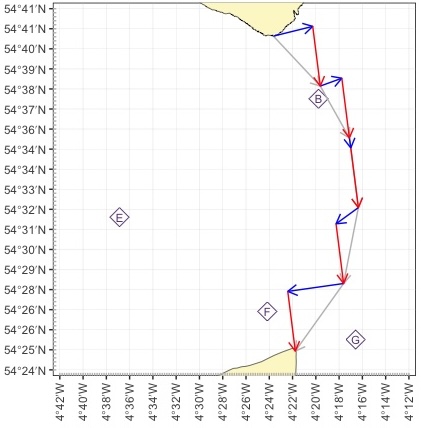
The tidal drift hours are shown in blue, the paddling arrows in red. Our course is going to follow the grey lines.