5.2 Long crossings
We’ve already looked at crossings of channels with tidal flow where the crossing took around an hour or less. With these short crossings, it’s reasonable to assume that the tidal stream remains constant throughout the crossing, making the vectors approach fairly simple.
If you’re planning a crossing that’s going to take several hours, the tidal stream is going to change its speed and possibly its direction during the crossing. Clearly that needs to be taken into account when planning the crossing.
5.2.1 Option1: Multiple 1 hour vectors
A simple approach to planning a long crossing is simply to apply the simple vectors approach to short crossings to each hour, aiming to stay on a straight line between the start and finish points. This works. Here’s a long crossing planned out using this technique:
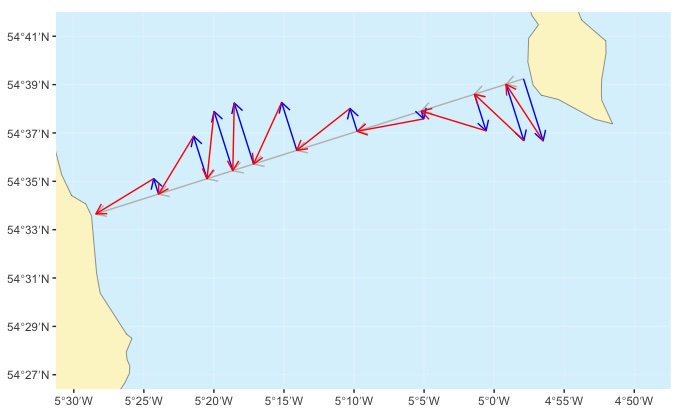
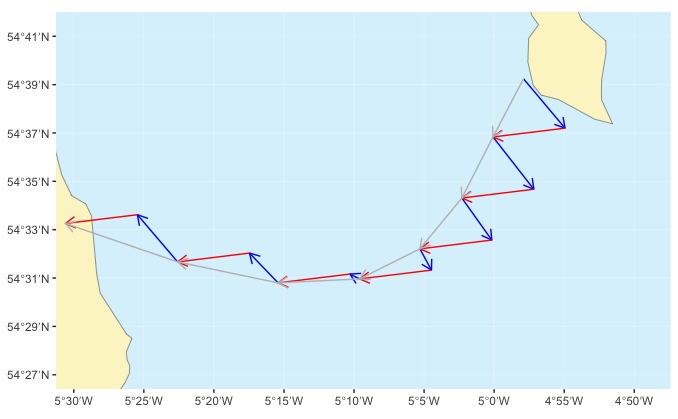
Long crossing (Crammag Head, Mull of Galloway to Ballywalter in Northern Ireland) planned using a series of 1-hour vector triangles
For each hour, a blue vector has been drawn to represent how far the tide would make the kayak drift if the paddler did nothing for the hour. Then a red vector, representing the paddling speed had been added between the tip of the blue arrow and a (grey) line drawn between start and finish points for the crossing. As we saw in the simple vectors approach, the angle of the red arrows needs to be adjusted such that the end reaches the grey line.
As you can see from the map, the crossing is planned to take 10 hours. The paddler will need to adjust the bearing on which they paddle every hour. During some hours - e.g. the 1st and the 7th, the paddler makes very little progress towards their destination - they’re mostly just fighting the tide. And the paddler begins the crossing by paddling north-west to fight the tide…. but ends it by padding south-west against the tide once it’s turned.
So, whilst this method does work, it doesn’t seem to be very efficient. Let’s look at a better approach.
5.2.2 Option 2: Vectors over several hours
The big problem with the previous approach was that the paddler spends a lot of time fighting the tide in one direction, then the opposite direction. It would be better to simply let the tidal stream push the paddler south for the first 4 hours, then let the stream push them back northwards. Here’s the same trip, with the same tidal streams and paddling speed planned with this approach:
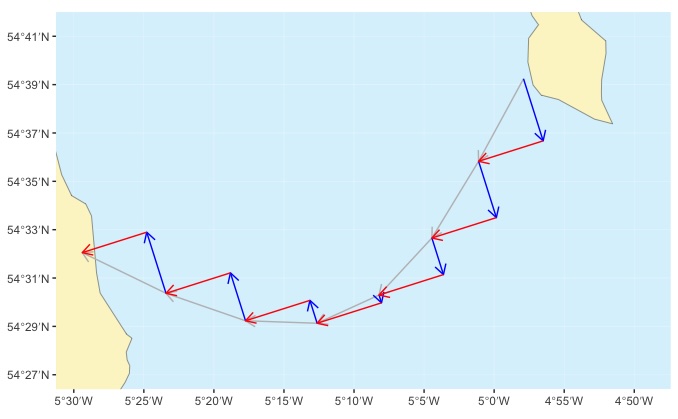
Long crossing planned with a constant course to steer
With this approach, the paddler steers a constant bearing throughout the entire crossing (red arrows). The tide (blue arrows) pushes the paddler south during the start of the crossing, then back north. Their course isn’t a straight line, but follows a curve (grey arrows). And notice that the crossing now only takes 7 hours to complete - little or no time is wasted paddling against the tide.
5.2.3 Introduction to multiple hour vector method
So, how do we calculate the course to steer for this more efficient approach? We begin by laying out all the tidal stream vectors, end to end for all the hours of the crossing:
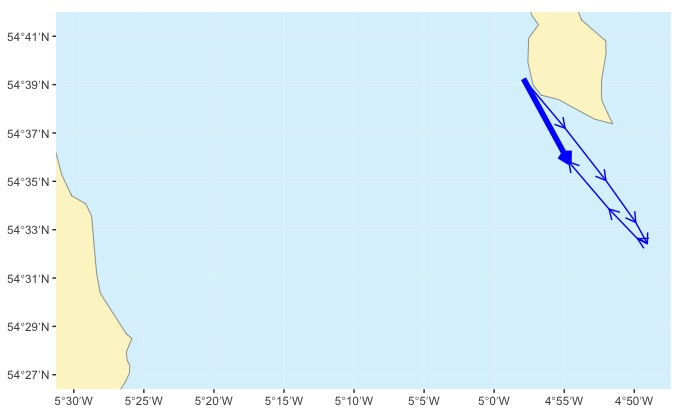
These (thin blue) arrows represent what would happen to the boat if we simply let it drift for 7 hours. If we want to, we can represent the total tidal drift by a single arrow (thick blue) that represents the total effect of the stream over the entire 7 hour crossing.
We now have a vector for the tidal effect, just like we had for the 1 hour vector triangle. We also know how far we can paddle during the crossing - it’s simply the crossing time (7 hours) multiplied by our paddling speed (e.g. 3 knots - to give 3X7 = 21 nautical miles). We have everything we need to draw a vector triangle that represents the entire 7 hour crossing, setting the direction of the 21 mile arrow so that it meets a line drawn from departure point to destination:
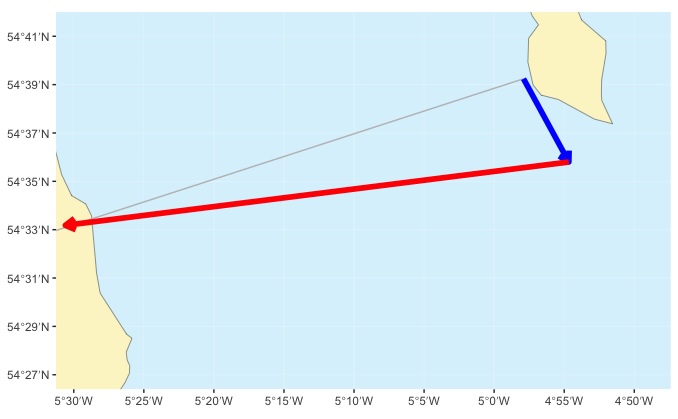
Vector triangle drawn for entire 7 hour crossing
The bearing of the red arrow (~260˚) tells us the course we need to steer throughut the crossing. Note that the point where the paddling speed vector (red arrow) meets the line drawn from departure point to destination (grey line) is slightly beyond the destination. This simply indicates that the crossing will take a little less than 7 hours to complete.
If we like, we can now find our where we’re going to be during the crossing - remember that using this technique, we’re likely to end up following a curved path. We simply lay out the tide and paddling vectors for each hour:
Vectors laid out for each hour of the crossing to give the course that will be followed
For the first hour, we draw the tide vector for hour 1 (furthest right blue arrow) and draw a paddling vector with length equal to our speed (e.g. 3 knots / 3 nautical miles) along the bearing that we calculated for the course to steer (260˚) (furthest right red arrow). The end of this red arrow tells us where we’ll be after 1 hour of paddling.
For the second and subsequent hours, we do the same, starting at at the calculated position for the previous hour. This gives us the position at the end of each hour and our actual course (grey arrows). If you’ve got everything right, the final position should be somewhere near your planned destination.
That’s a very high level explanation of a somewhat complex process that requires a lot of chart work. We’ll go through it slowly, with an example, over the next few sections
For our example, we’ll plan a crossing from Burrow Head in southern Scotland to Point of Ayre, the northern point of the Isle of Man in August 2025.
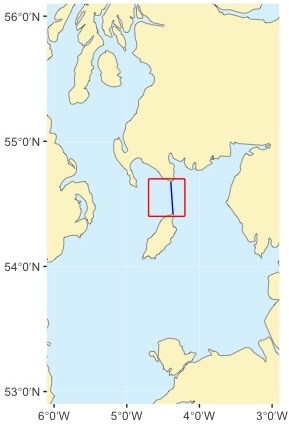
Crossing from Burrow Head to Point of Ayre (Isle of Man) - blue line. The area shown on the simplified chart is shown as a red box.
We’d likely plan this crossing on Admiralty chart 2094 “Kirkcudbright To Mull of Galloway & Isle of Man”, and the example will work fine if you want to do that. However, to make things easier to see, and to provide a chart that you’re able to print off without contravening copyright, We’re going to use the simplified chart here:
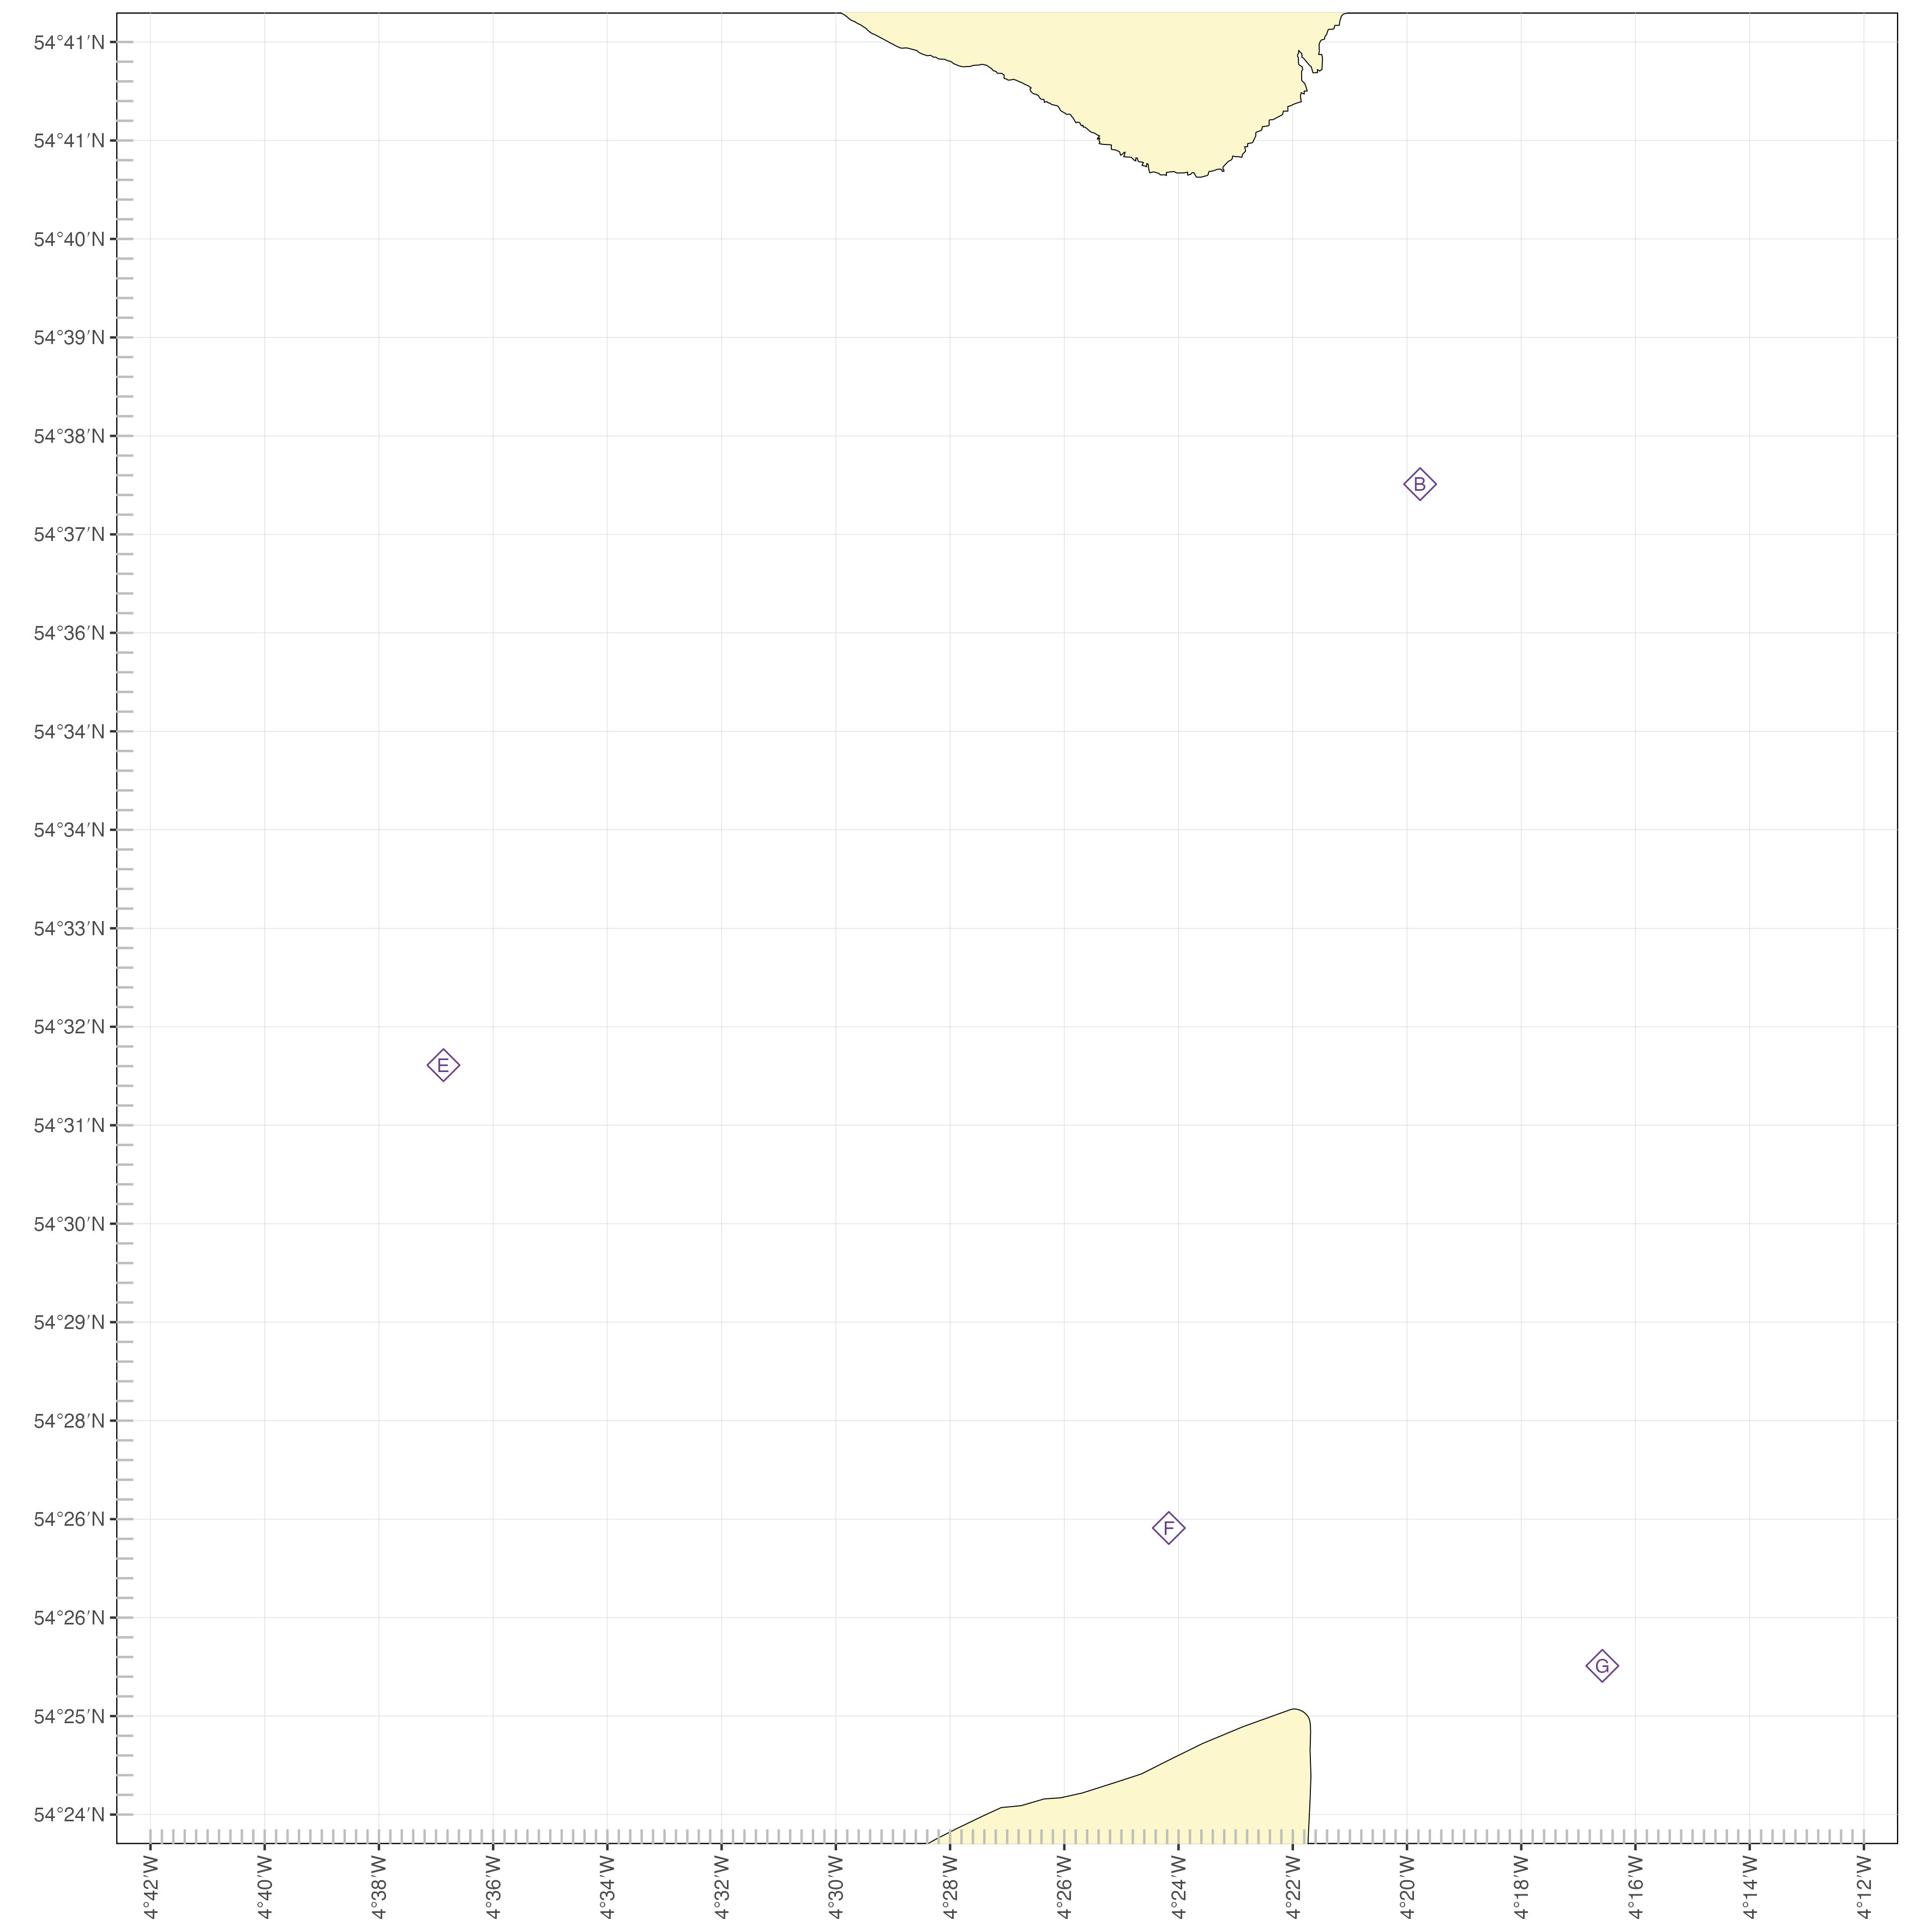
Simplified chart of the area between Burrow Head and Point of Ayre. Feel free to open this image in a different tab and print if off large to allow you to follow along with the example.
The chart has 4 tidal diamonds on it. Here’s the data for those diamonds:
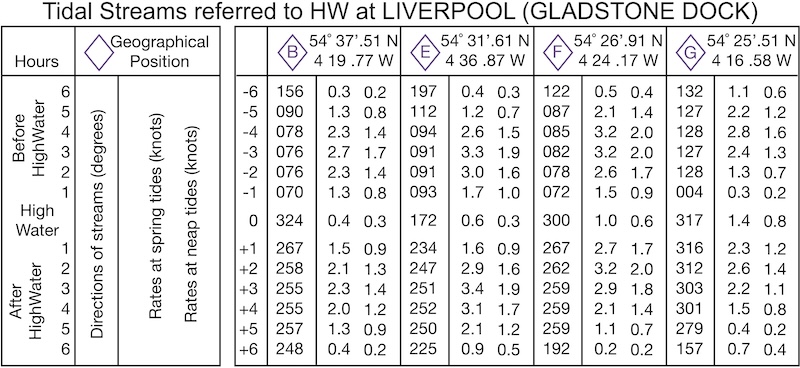
We’ll show how to use this information to plan the crossing in subsequent sections.