5.4 Finding tidal stream data for long crossings
The tidal stream data that we use for crossings can come from any of the usual sources - e.g. pilots, guidebooks or stream atlases. If we’re going to use the information for formal navigation, it makes sense to use the most accurate data that we can. Where possible, we’ll tend to use tidal diamonds. However, in some places there simply aren’t tidal diamonds available and in others we may need to augment them with other information sources, for example to account for faster flows near the shore.
During a long crossing, we may pass through areas that have different tidal streams. We need to decide what source of information to rely on for each hour of the crossing.
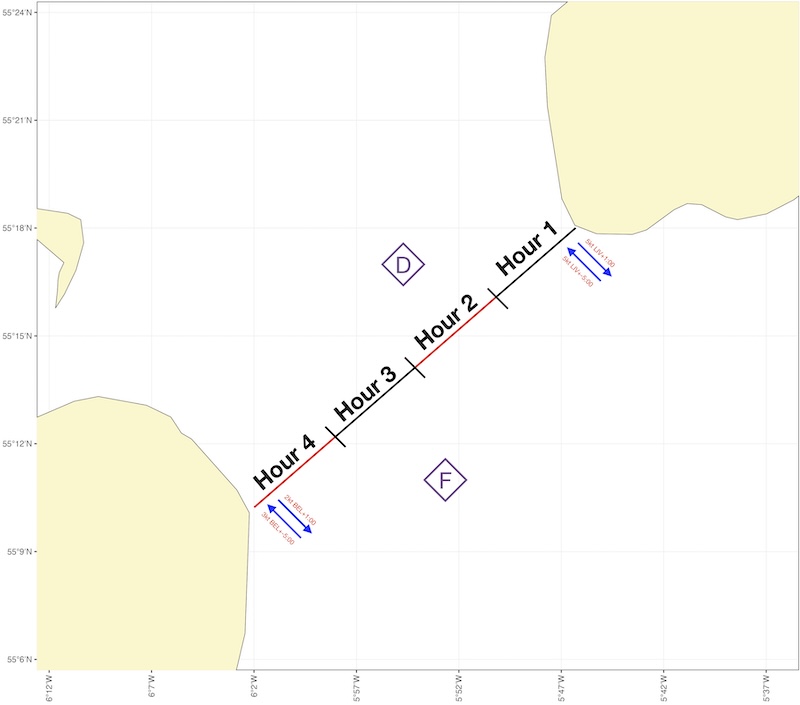
To do this, we need to estimate where on the crossing we expect to be at each hour. To do this, draw a line from the start point to the end point, and mark off 1 hour distances each corresponding to a hour’s paddle (e.g. 3 nautical miles for 3 kt paddling speed):
This approach assumes that our progress along the crossing won’t be greatly affected by the tide. This is reasonable for crossings across the tide with slack water in the middle of the crossing. If we’re paddling down tide, we can modify our speed accordingly.
We can now choose which tidal data to use for each hour. In the illustration above, we might choose to use:
Data from pilot books or guidebooks, shown as blue arrows, for hours 1 and 4 to account for the stronger flows inshore
Diamond D for hour 2
Diamond F for hour 3
Of course, this choice is subjective. If we believe that the inshore flow at the western end of the crossing is very localized near the coast, we might choose to use diamond F for hour 4… and plan to deal with the localized flow once we get there - perhaps using transits, or planning to arrive suitably up-tide of our final destination.
We’ll need to use the techniques that we’ve learned in earlier sections to determine the tidal flows that we expect on the day in question.
For our example crossing, the best information available is from a series of tidal diamonds. We need to decide which to use for each hour.
Begin by drawing a line from the start point of the crossing to beyond the end (the extended line will be useful later). Then mark off each hour of paddling distance along the line. On this crossing, we expect to paddle at 3 knots, so we mark every 3 nautical miles:

Marking the line from start point to destination and dividing it into hours. 1,2 drawing a line from start point to destination - the plotter is simply being used as a ruler here. 3 setting the dividers to 3 nautical miles using the latitude scale. 4 ‘walking’ the dividers along the line and marking off 3 nautical mile segments
The final result is shown below:
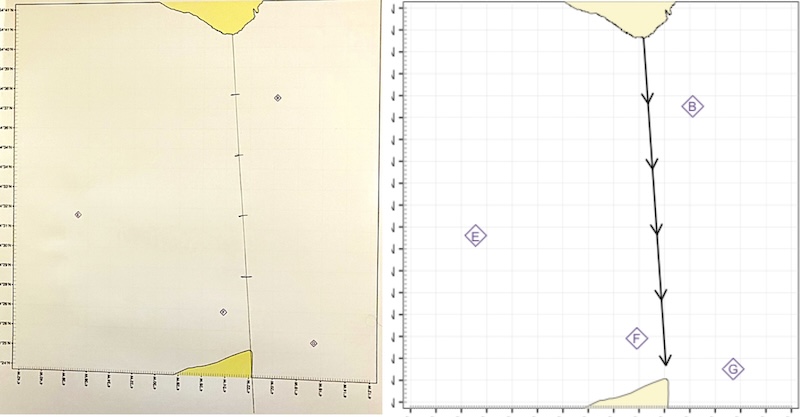
Crossing marked up with 1 hour segments - pencil drawing on left, schematic on right
We can now decide which diamonds to use for each hour of the crossing. Clearly, we will want to use diamond B for the first 2 hours. Diamond F would be a good choice for the final hour (it’s closer to the crossing line than diamond G), but will likely be too much affected by it’s proximity to the Point of Ayre to be a sensible choice for other parts of the crossing.
For hours 3 and 4, you could choose to use either diamond B or diamond E. Diamond B might better reflect the way the tide is ‘squeezed’ into the channel that we’re crossing, but diamond E may better reflect the conditions in the middle of the channel. Looking a a tidal stream atlas might help you to make the choice, but it is subjective. We’ll choose diamond E:
| Time relative to HW Liverpool | Time (BST) | Source of tidal data |
|---|---|---|
| -2 (-2:30 to -1:30) | 09:30-10:30 | Diamond B |
| -1 (-1:30 to -0:30) | 10:30-11:30 | Diamond B |
| 0 (-0:30 to +0:30) | 11:30-12:30 | Diamond E |
| +1 (+0:30 to +1:30) | 12:30-13:30 | Diamond E |
| +2 (+1:20 to +2:30) | 13:30-14:30 | Diamond F |
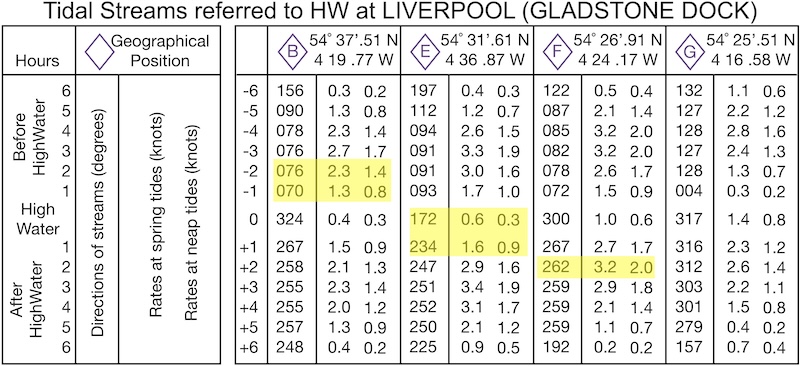
We can now copy the required data from the tidal diamonds. The required information is highlighted below and captured in the next version of our table:
| Time relative to HW Liverpool | Time (BST) | Source of tidal data | Bearing | Spring rate | Neap rate |
|---|---|---|---|---|---|
| -2 (-2:30 to -1:30) | 09:30-10:30 | Diamond B | 76˚ | 2.3 kt | 1.4 kt |
| -1 (-1:30 to -0:30) | 10:30-11:30 | Diamond B | 70˚ | 1.3 kt | 0.8 kt |
| 0 (-0:30 to +0:30) | 11:30-12:30 | Diamond E | 172˚ | 0.6 kt | 0.3 kt |
| +1 (+0:30 to +1:30) | 12:30-13:30 | Diamond E | 234˚ | 1.6 kt | 0.9 kt |
| +2 (+1:20 to +2:30) | 13:30-14:30 | Diamond F | 262˚ | 3.2 kt | 2.0 kt |
We can now use the tidal range on the day we’ve chosen for the crossing (7 metres) together with the neap and spring ranges at Liverpool (8.27, 4.29 metres) to calculate the expected flow on August 9th. We might use a graphical or a numerical method to do this - see the earlier notes on ‘Predicting speeds of tidal streams’ for how to do this. Here’s the results:
| Time (BST) | Source of tidal data | Bearing | Spring rate | Neap rate | Expected rate August 9th |
|---|---|---|---|---|---|
| 09:30-10:30 | Diamond B | 76˚ | 2.3 kt | 1.4 kt | 2.0 kt |
| 10:30-11:30 | Diamond B | 70˚ | 1.3 kt | 0.8 kt | 1.1 kt |
| 11:30-12:30 | Diamond E | 172˚ | 0.6 kt | 0.3 kt | 0.5 kt |
| 12:30-13:30 | Diamond E | 234˚ | 1.6 kt | 0.9 kt | 1.4 kt |
| 13:30-14:30 | Diamond F | 262˚ | 3.2 kt | 2.0 kt | 2.8 kt |